Meet Canvas: Your AI-guided Workspace Within Honeycomb
Canvas is an AI-guided workspace inside Honeycomb that combines an AI assistant with an interactive notebook for visualizing query results and traces. You can ask a natural language question about your data and Canvas will immediately start exploring your traces, through multiple queries and other tools, to find the right next steps.

By: Morgante Pell
AI’s Unrealized Potential: Honeycomb and DORA on Smarter, More Reliable Development with LLMs
Watch Now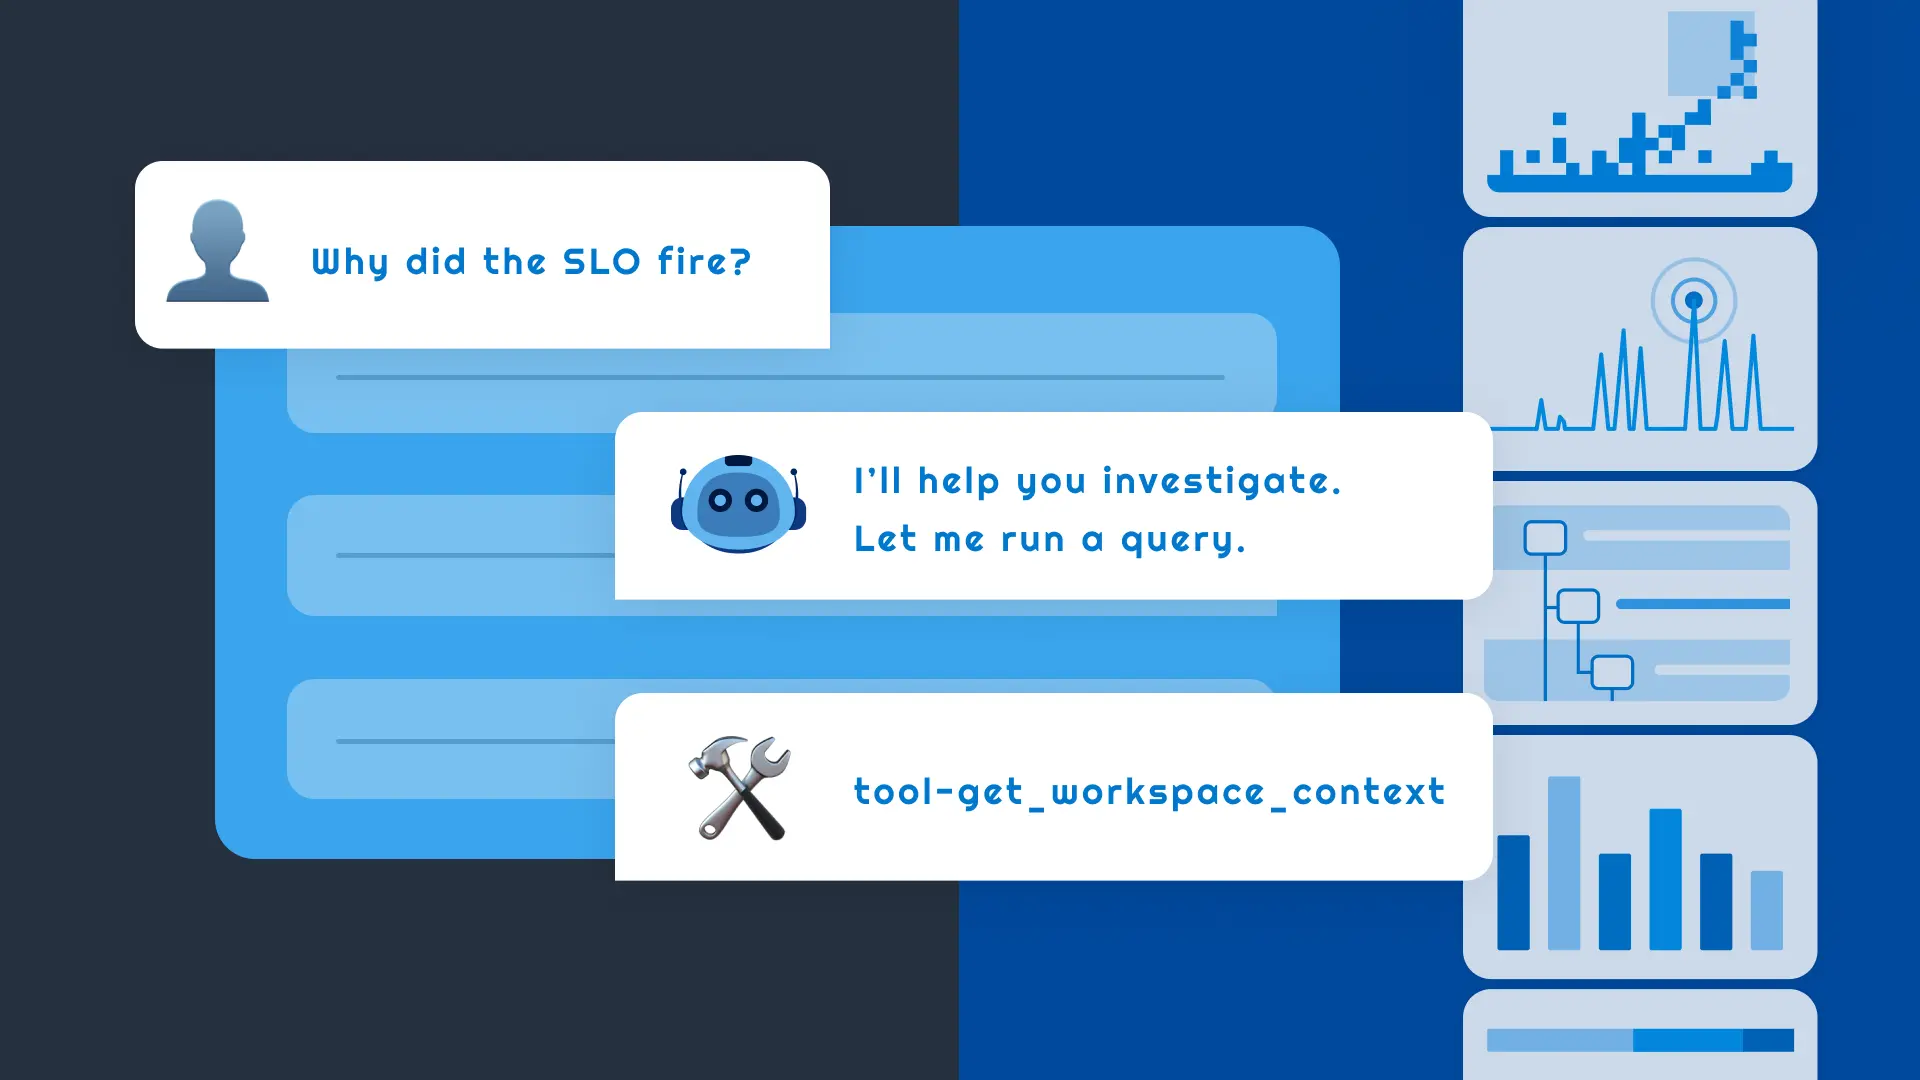
Modern systems are wonderfully capable, but relentlessly complex. Debugging across microservices, frontends, and cloud edges often means switching between five or more tools, trying to stitch together “what changed” and “why it broke.” Honeycomb’s wide events model has proven to be a superpower for taming that complexity, by allowing you to easily observe and query end-to-end traces without worrying about how much granular data you attach to your events.
The downside of this model is that it requires expertise to properly query and understand. When you have thousands of different event fields spread across multiple microservice, it’s challenging for a developer to have enough context to immediately find the data they’re looking for visualized in the format they can understand.
Canvas changes that dynamic by providing a natural language interface to your observability data. Just bring your questions and Canvas will allow you to find answers and share interactive analysis with the rest of your team. The end result is less time spelunking and more time shipping.
What exactly is Honeycomb Canvas?
Canvas is an AI-guided workspace inside Honeycomb that combines an AI assistant with an interactive notebook for visualizing query results and traces. You can ask a natural language question about your data and Canvas will immediately start exploring your traces, through multiple queries and other tools, to find the right next steps. Instead of having to write each query yourself, Canvas automatically proposes relational queries, comparisons, and visualizations that explain why an SLO fired or what changed after a deploy.
Crucially, as the assistant investigates your question, you can follow along with live visualizations of the data it’s looking at. This allows you to easily verify its conclusions and to ask additional follow-up questions. When the investigation is ready to share, you can post a live Canvas snapshot directly into Slack, where teammates can continue the analysis with interactive charts. This makes collaboration seamless and ensures that context never gets lost.
Why we built Canvas
We launched our first AI feature at Honeycomb in 2023 with Query Assistant. This was designed as a simple question-to-query converter: if you know exactly what data you’re looking for, Query Assistant can translate that into Honeycomb’s query syntax. This was effective for the time, right after the release of GPT-4, but still required a lot of expertise to understand which columns matter and how they’re related. It was designed as a “single shot” experience: Query Assistant can generate a query for you, but any analysis and follow-up still relies on your expertise.
Since then, products like ChatGPT agent and Claude Code have demonstrated that the best AI experiences come from deep, multi-turn collaboration between humans and AI. When empowered with powerful tools, frontier LLMs can explore their environment autonomously but can still benefit from human direction on where to go deeper. Canvas embraces this by giving the assistant over a dozen different tools to explore your Honeycomb data, but also allows you to redirect its investigation with additional questions or context.
What makes Canvas different
Most AI observability features are, frankly, underwhelming. It’s hard to build an effective chatbot when the only data you have to work with are course metrics and unstructured logs that quickly exceed even increasingly large context windows. This is why Honeycomb’s columnar data store is a real asset for any AI agent trying to understand production systems: agents can rapidly fire off different Honeycomb queries to find the data they need.
That’s why when Honeycomb acquired Grit I originally focused our efforts towards building a best-in-class MCP server. When our strength is our data model, the best thing we can do is bring that data to our AI agent of choice. This has certainly worked well, with top customers like Slack and Intercom using Honeycomb’s MCP server to run hundreds of queries per week from their IDEs.
Yet one of the top feature requests has consistently been for the MCP server to include links back to the Honeycomb UI. It turns out that AI agents are great for helping craft high-level queries, but when you want to drill down into a specific trace or to explore outliers in a dataset, it’s hard to beat the expressive power of Honeycomb’s interactive UI.
That’s why Canvas combines the two together into a single interface: you can chat with the assistant to drive the direction of an investigation, but still click on a chart to explore a specific data point. And once you’ve found the data you need, you can share the canvas with the rest of your team where they can also see the full history of the investigation.
Where Canvas shines
Early customers have found Canvas especially powerful for investigating systems they’re unfamiliar with. When responding to an incident, you can rapidly explore multiple hypotheses in parallel by asking Canvas to investigate changes in different services. With only high-level direction about what services you’re interested in, it can quickly find the right patterns to investigate and even run built-in BubbleUp to find out what changed.
We’ve also found Canvas is particularly useful for allowing those who haven’t used Honeycomb much to quickly get value from observability data. In fact, our own sales team has started using Canvas to explore how their customers are using Honeycomb: you can easily ask Canvas a question, like “What are the main features used by my top 10 accounts?” and get back multiple helpful graphs.
How to get the most from Canvas
Canvas shines when you give it a clear direction to investigate, like “What’s driving a spike in our database request volume?” or “Which user cohorts are seeing higher latency?” You can lean on its suggestions for queries and visualizations, which often reveal the “why” more quickly than manual digging.
You can trust it to run multiple queries to find plausible hypotheses, but as with all AI products, Canvas won’t always make the right conclusion the first time. Instead of abandoning the chat session when it makes a mistake, we encourage you to try redirecting it with additional information by mentioning specific columns or datasets of interest. We’ve found the most successful investigations require two or three user questions in order to reach a meaningful conclusion.
The launch of Canvas is also a great opportunity to open up access to Honeycomb for other people in your organization who might not be observability experts. There’s no additional cost to using Honeycomb Intelligence, so it can be a great entry point for anyone who was previously intimated by the complexity of our existing query builder.
Part of the Honeycomb Intelligence family
Canvas is one part of the larger Honeycomb Intelligence story. It pairs naturally with the hosted MCP server, which brings Honeycomb data into AI-powered IDEs like Cursor and Claude Code. This helps developers debug and ship without constant context switching. It also works alongside Honeycomb Anomaly Detection, which automatically learns what “normal” looks like for your applications and surfaces genuine issues. Each anomaly comes with timeline context and an immediate path into deeper Canvas-led exploration.
Together, these capabilities fulfill the Honeycomb Intelligence promise: they help every developer understand their systems quickly, move from chaos to clarity, and act with confidence.
Try Canvas
Canvas is part of Honeycomb Intelligence. If you already use Honeycomb, you can dive right in from the sidebar. If you’re new to Honeycomb, you can start for free or book a demo to see for yourself how quickly Canvas can turn production signals into useful answers and paths for exploration.