The Problem with Pre-aggregated Metrics: Part 1, the “Pre”
This is the first of three posts focusing on the limitations of pre-aggregated metrics, each corresponding to one of the “pre”, “aggregated”, and “metrics” parts of the phrase. The second can be found here….

By: Christine Yen
This is the first of three posts focusing on the limitations of pre-aggregated metrics, each corresponding to one of the “pre”, “aggregated”, and “metrics” parts of the phrase. The second can be found here.
Pre-aggregated, or write-time, metrics are efficient to store, fast to query, simple to understand… and almost always fall short of being able to answer new questions about your system. This is fine when you know the warning signs in your system, can predict those failure modes, and can track those canary-in-a-coal-mine metrics.
But as we level up as engineers, and our systems become more complicated, this stops being feasible: things are going to start breaking in unpredictable ways, and we need tools that can allow our future selves to be one step ahead of our past selves.
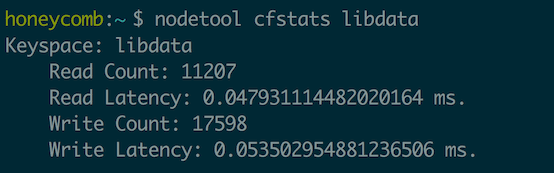
Let’s look at a situation in which this would be frustrating in the wild. Imagine we’re running a Cassandra cluster and want to monitor read and write latencies. (Really, any database might work here, Cassandra just exposes built-in metrics that suit our purposes nicely.)
Seems like a pretty reasonable assumption to start off with what the Cassandra folks decided to package up for us by default! We get to work, wire these metrics into a time series system, and we might end up with a few graphs like this, tracking the AVG by default and maybe the P95 if we’re feeling fancy:
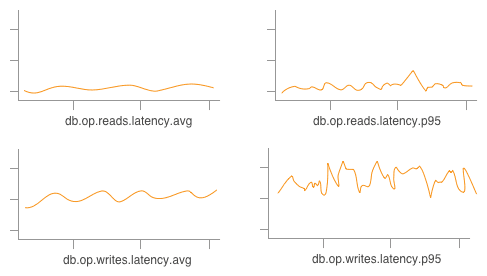
Well, great! This seems fine, four graphs are pretty easy to keep an eye on. Except… sometimes we care whether a write is an increment vs an update vs a deletion! Or which column family/table we’re writing to. And averages are fine, but percentiles are better and sums illustrate total load on our system—so, soon enough, our four graphs now look a little more like:
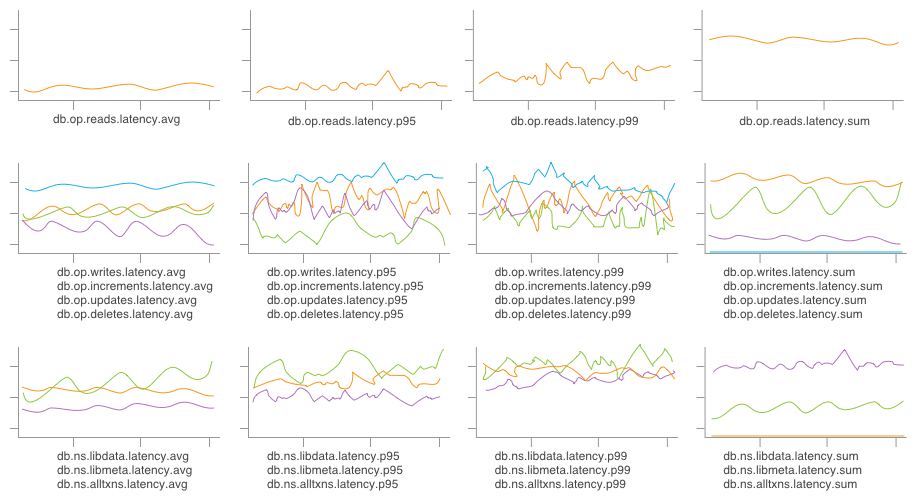
… A little less straightforward to skim through, now.
By relying on pre-aggregation, we’ve lost the ability to get answers tailored to the question we’re asking (e.g. “Some of my database writes have been timing out, what’s going on?”); instead, we have to rely on answers that were packaged up for us in the past. We’re also necessarily biased by the graphs already in front of us, and can be blinded to other potential root causes.
Even given the above graphs, produced by storing just the first-order slices on the operation and table attributes, we’re unable to graph the cross product—for example, only updates affecting libdata—without first defining a new metric (db.op.updates.ns.libdata.latency.avg) and waiting for our graph to fill in with new data.
When each postmortem ends with an action item or three to add new metrics to a dashboard, the “anticipate everything; graph everything” strategy quickly enters a tailspin.
Intrigued? Give us a shot!
Honeycomb can produce any of the graphs shown above, and so much more. By preserving data for aggregation at query time, we can log whichever attributes tickle our fancy as a full event—then group by an arbitrary combination of those attributes or filter out all but an arbitrary slice of data.
Take a look at what Honeycomb’s approach looks like by browsing through our dogfooding posts, or just give us a whirl today!
Up next, we’ll talk a bit about the problem with the “aggregation” side of “pre-aggregation”—how implementation details of the aggregation step can make it next to impossible to get as deeply and flexibly into our data as we need.
Want to know more?
Talk to our team to arrange a custom demo or for help finding the right plan.