3 Easy Ways to Get Started With Distributed Tracing
We’re here to show you three ways you can jumpstart a distributed tracing effort, starting small and expanding as it makes sense. These examples involve only a little code and perhaps a bit of a mindset change. Starting small with distributed tracing can even be fun, because who doesn’t like getting customized results without much work?

By: Nick Rycar

Not to put too fine a point on it, but we think distributed tracing gets a very bad rap for being too complicated and labor-intensive.
We’re here to show you three ways you can jumpstart a distributed tracing effort, starting small and expanding as it makes sense. These examples involve only a little code and perhaps a bit of a mindset change. Starting small with distributed tracing can even be fun, because who doesn’t like getting customized results without much work?
There’s no question that customized results are the holy grail of modern software development teams. The first step in finding a problem is knowing where to look, but without true observability, “where to look” could literally be anywhere or everywhere. Log searching is painful and time consuming (which is one reason we recommend log analysis instead) and it is ultimately not very effective. Distributed tracing, however, gives teams a fast and configurable magnifying glass, which really is the coolest thing ever.
But don’t take our word for it: Slack reduced flakey tests by 10x just by adding distributed traces to its builds.
So what’s the quickest way to get started with distributed tracing? Remember: building instrumentation is additive. You can start with just a single trace. Here are three quick ways to get going quickly.
Instrument a Node.js application
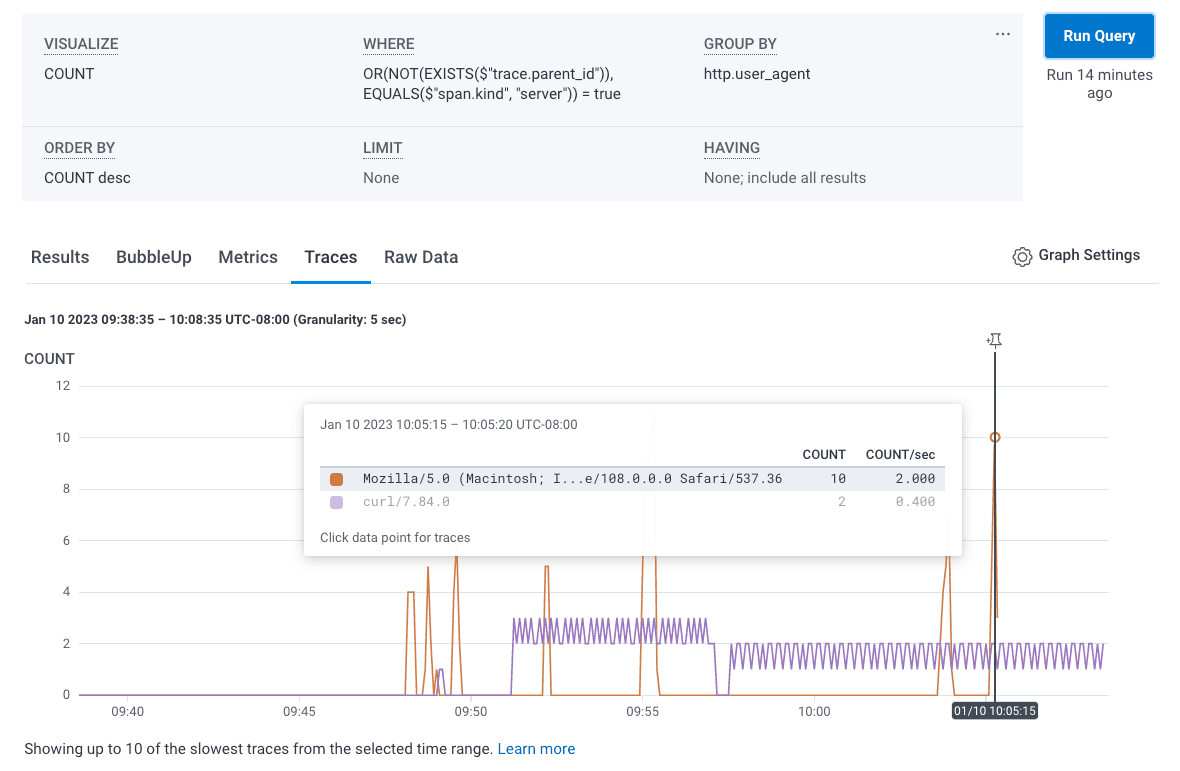
The single easiest way to begin experimenting with distributed tracing is to leverage the boilerplate configuration available in our SDKs. You can configure our Node.js distribution by copying and pasting the existing code into an instrumentation file to set up some very basic traces on any Node.js app. Before adding any manual instrumentation, you’ll be able to query and visualize your requests based on a variety of built-in dimensions. The screenshot below shows a count of all requests to a demo application, grouped by user agent to differentiate human-initiated requests from an automated load test with curl.
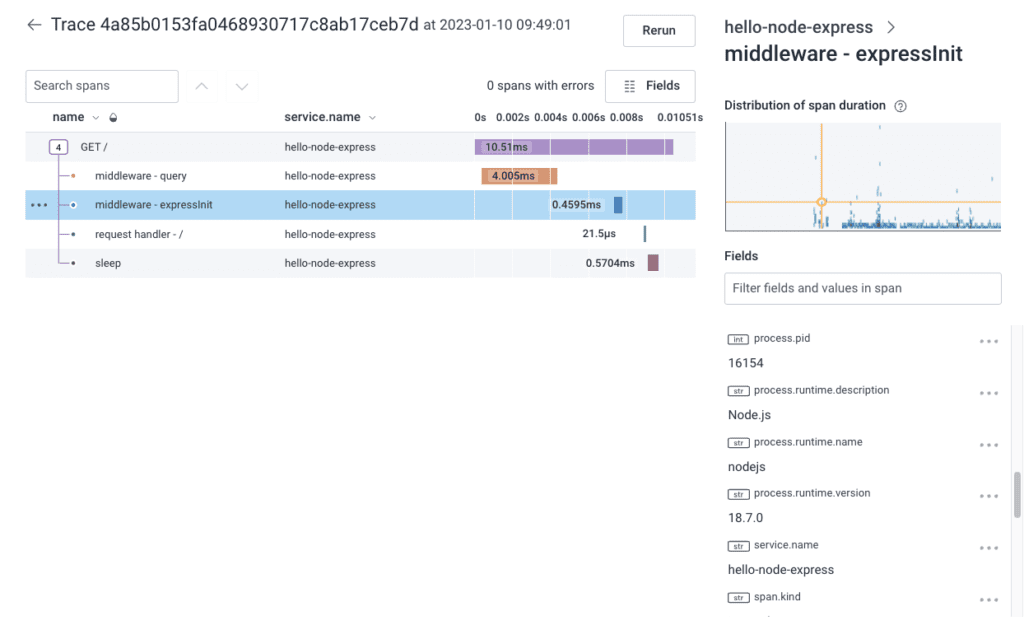
Honeycomb’s SDKs provide support for various middleware, and can automatically populate traces accordingly. Below we see a trace with autogenerated spans for the express framework.
To see this in action, you needn’t have a Node.js app at the ready. We provide a few javascript and typescript example apps to get you started quickly. You’re not limited to Node.js either, though it is Honeycomb’s newest SDK. Options for Golang, Java, and .NET are also available, and there are a number of OTel instrumentation options for other languages.
Set up NGINX logs
It’s also very straightforward to add a bit of code to NGINX logs: install the lightweight tool honeytail, configure it to point at your NGINX logs, then launch. You’ll start getting data in Honeycomb in a snap.
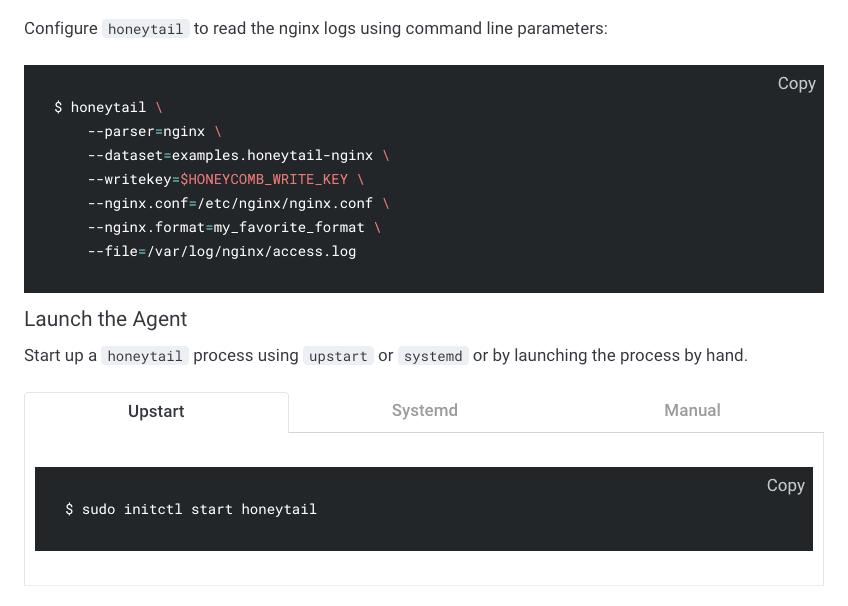
Find more details in the example app and see how other users connect NGINX to Honeycomb.
Work with build pipelines
And, finally, don’t forget CI builds, which can easily be configured to send a wide variety of data to Honeycomb. Buildevents is another lightweight tool for building traces out of your CI/CD pipelines. It can be used with any build system, but there are some specific guides and integrations available. It’s published as a CircleCI orb, and there are PDF quickstart guides available for CircleCI, GitHub Actions, and GitLab.
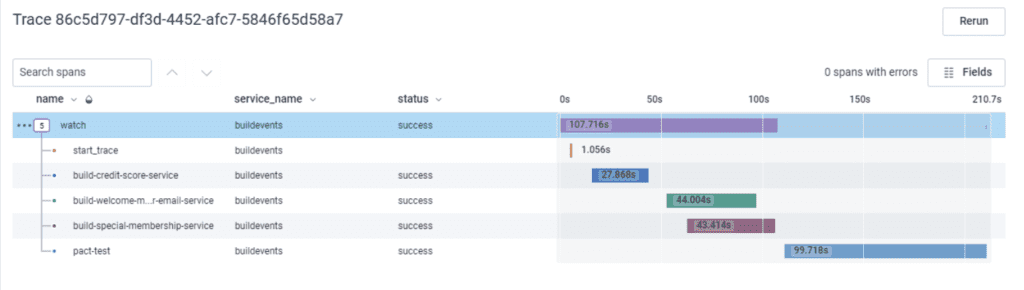
When visualized as a trace, you can easily see how much time is being spent building vs. testing, your biggest bottlenecks, and the impact of serial vs. parallel steps. See below for an example trace from our CircleCI guide.
For a real world example of using Honeycomb traces to improve CI practices, including some more advanced use cases like flaky test identification, be sure to check out How Slack Transformed Their CI With Tracing.
The bottom line
You can (and should) put observability around nearly everything. We’ve gone over the pros of observability a ton of times, so we won’t bore you too much, but we’ll leave you with this: faster MTTWTF; happier developers; less stress when incidents happen. Why wouldn’t you want that?
Curious? Watch the full webinar today.
Want to know more?
Talk to our team to arrange a custom demo or for help finding the right plan.