Integrating JMX and OpenTelemetry
The OpenTelemetry community and the contributors to the Java Special Interest Group (SIG) have spent a great deal of time integrating core Java technologies into the project. An integration that is particularly useful is Java Management Extensions (JMX).

By: Alex Boten

The Director’s Guide to the Future of Observability: AI, OpenTelemetry, and Complex Systems
Read Now
The OpenTelemetry community and the contributors to the Java Special Interest Group (SIG) have spent a great deal of time integrating core Java technologies into the project. An integration that is particularly useful is Java Management Extensions (JMX). It has been around since J2SE 5, and has been mature for some time. Many of the most widely used Java applications have adopted it over time and support this extension.
What is JMX?
The Java Management Extensions provides an interface to monitor and manage Java applications that is defined via a specification. This gives applications a standard way to provide a wide range of useful functionality. Specifically for the use case of this article, JMX provides a way to expose metrics about the application via management beans (MBeans), which can be useful to understand the state of the application and the Java Virtual Machine.
Integrating JMX with OpenTelemetry ensures the data collected from Java applications is using the same standard that is ubiquitous in enabling effective observability. The OpenTelemetry integration for JMX utilizes configuration files specified in YAML to describe how the application’s metrics should be translated into OpenTelemetry metrics. These rules are provided to a JMX metrics scraper which interacts with the JMX API. Many existing Java applications can be configured to emit metrics via JMX. The following applications have predefined rules files supported by the community:
- Activemq
- Cassandra
- Hbase
- Hadoop
- Jetty
- Jvm
- Kafka
- Solr
- Tomcat
- Wildfly
This means that when using the JMX scraper, it is possible to identify the target application as one of the options above and have metrics automatically scraped without any additional configuration.
There are multiple ways to extract data from an application using OpenTelemetry’s JMX integrations:
- Running the JMX metrics scraper JAR and pointing it at your application
- Running the OpenTelemetry Java Agent alongside the application
- Running the OpenTelemetry Collector and configuring the JMX receiver to fetch metrics via JMX
The JMX metrics scraper is an easy and convenient way to test exporting metrics from a Java application with the minimum amount of additional dependencies involved. The OpenTelemetry Java Agent is a much more mature and proven mechanism, but as it introduces additional instrumentation, it may also introduce some overhead. The OpenTelemetry Collector is a solid alternative, if running a separate process or workload in your environment is acceptable. We’ll explore all three options in this article.
Setup
Before jumping into the OpenTelemetry integrations, it’s worth ensuring that the application that will be tested is exposing a JMX endpoint correctly. The following command starts a Tomcat server in a Docker container to reduce the amount of dependencies necessary on the local system. It uses the JAVA_OPTS environment variable to enable JMX and make it available on port 9999.
$ docker run -it --rm -p 9999:9999 -p 8888:8080 -e JAVA_OPTS="-Dcom.sun.management.jmxremote -Dcom.sun.management.jmxremote.local.only=false -Dcom.sun.management.jmxremote.authenticate=false -Dcom.sun.management.jmxremote.port=9999 -Dcom.sun.management.jmxremote.rmi.port=9999 -Djava.rmi.server.hostname=0.0.0.0 -Dcom.sun.management.jmxremote.ssl=false" tomcat:9.0There are many tools to validate that the JMX port can be accessed and is producing metrics. The following uses the JConsole and connects to the port opened:
$ jconsole localhost:9999This will bring up an application that may prompt you about the connection being insecure. This warning can safely be ignored for local development.
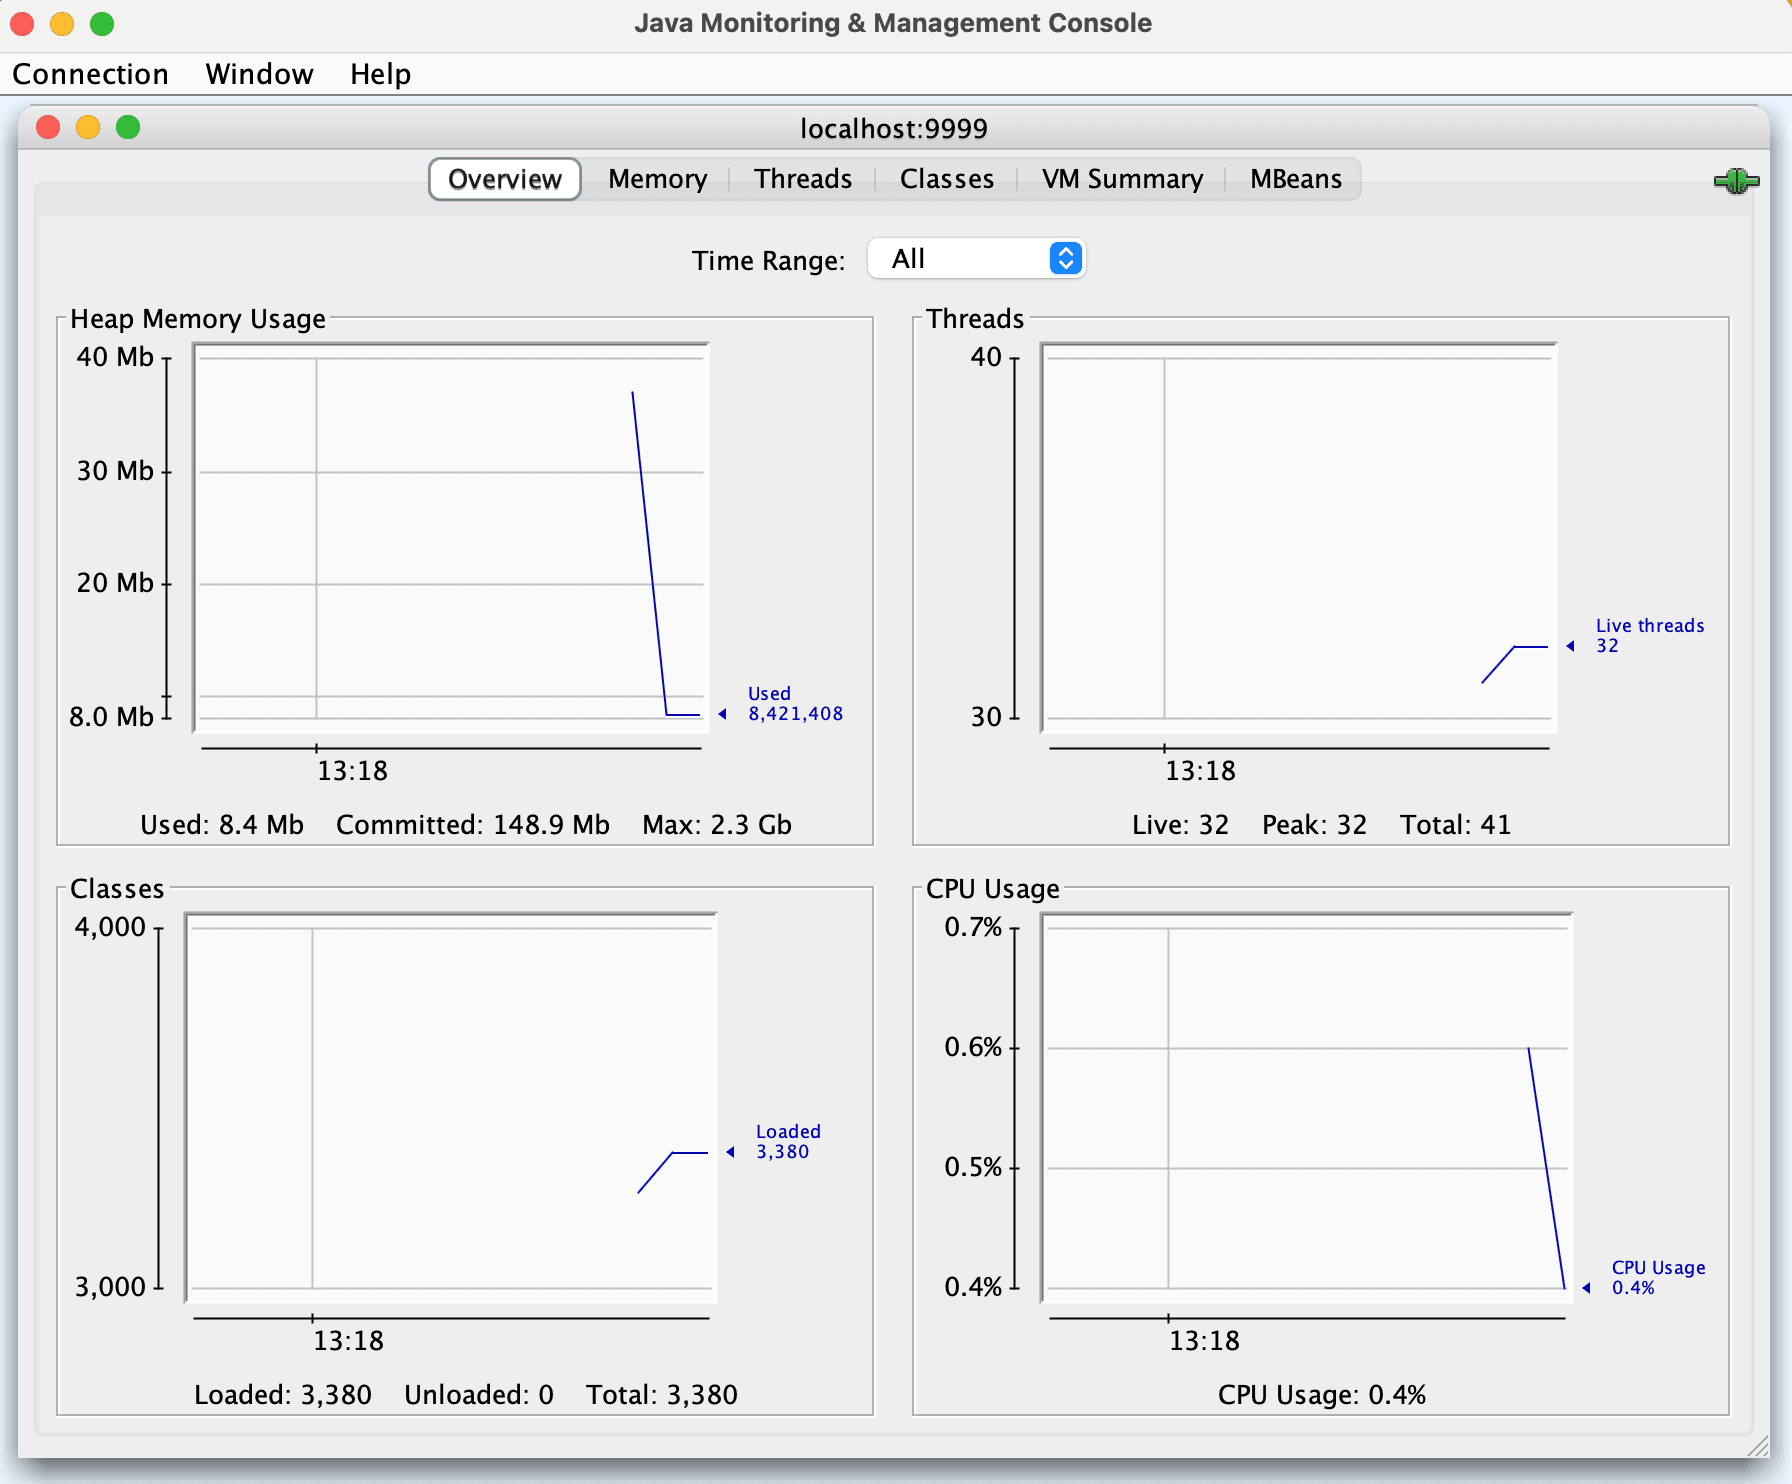
The data is accessible over the remote JMX port, and we're ready to integrate with OpenTelemetry.
Using the JMX scraper directly
As mentioned earlier, the JMX scraper is the easiest way to get started. The commands below will:
- Download the latest published version of the JMX scraper from Maven
- Run the JMX scraper, configure it to know that it is collecting telemetry from Tomcat, and collect metrics via JMX before emitting them to the local console
$ wget https://repo1.maven.org/maven2/io/opentelemetry/contrib/opentelemetry-jmx-scraper/1.49.0-alpha/opentelemetry-jmx-scraper-1.49.0-alpha.jar

$ OTEL_METRICS_EXPORTER=console java -jar opentelemetry-jmx-scraper-1.49.0-alpha.jar -config - <<EOF
otel.jmx.service.url=service:jmx:rmi:///jndi/rmi://localhost:9999/jmxrmi
otel.jmx.target.system=tomcat
EOF
The output from the command lets us know that the connection was established, and that some metric instruments have been created:
WARNING: A terminally deprecated method in sun.misc.Unsafe has been called
WARNING: sun.misc.Unsafe::objectFieldOffset has been called by io.opentelemetry.internal.shaded.jctools.util.UnsafeAccess (file:/Users/alex/Downloads/opentelemetry-jmx-scraper-1.49.0-alpha.jar)
WARNING: Please consider reporting this to the maintainers of class io.opentelemetry.internal.shaded.jctools.util.UnsafeAccess
WARNING: sun.misc.Unsafe::objectFieldOffset will be removed in a future release
2025-08-27 10:28:48 INFO metrics export interval (seconds) =  60
2025-08-27 10:28:48 WARNING SASL unsupported in current environment: class io.opentelemetry.contrib.jmxscraper.JmxConnectorBuilder cannot access class com.sun.security.sasl.Provider (in module java.security.sasl) because module java.security.sasl does not export com.sun.security.sasl to unnamed module @24313fcc
2025-08-27 10:28:48 INFO Connecting to service:jmx:rmi:///jndi/rmi://localhost:9999/jmxrmi
2025-08-27 10:28:48 INFO tomcat: found 3 metric rules
2025-08-27 10:28:48 INFO JMX scraping started
2025-08-27 10:28:49 INFO Created Counter for tomcat.error.count
2025-08-27 10:28:49 INFO Created Counter for tomcat.request.count
2025-08-27 10:28:49 INFO Created Gauge for tomcat.request.duration.max
2025-08-27 10:28:49 INFO Created Counter for tomcat.request.duration.sum
2025-08-27 10:28:49 INFO Created Counter for tomcat.network.io
2025-08-27 10:28:49 INFO Created Counter for tomcat.network.io
2025-08-27 10:28:49 INFO Created UpDownCounter for tomcat.thread.count
2025-08-27 10:28:49 INFO Created UpDownCounter for tomcat.thread.limit
2025-08-27 10:28:49 INFO Created UpDownCounter for tomcat.thread.busy.countUsing the JMX scraper is a good way to get started, but it does require an additional JAR, which we may not want if we’re already using the Java Agent.
Using the Java Agent
In addition to providing integration for JMX, the Java Agent provides functionality for automatically instrumenting applications. It is more commonly used than the JMX scraper for that reason. The following commands:
- Download the latest released version of the OpenTelemetry Java Agent archive
- Add the Agent archive into the Docker environment by mounting the local directory into the container
- Run the same Tomcat application as before with some additional environment variables to load the agent
$ wget https://github.com/open-telemetry/opentelemetry-java-instrumentation/releases/download/v2.19.0/opentelemetry-javaagent.jar

$ docker run -it -v `pwd`:/tmp --rm \
  -e OTEL_LOGS_EXPORTER=console \
  -e OTEL_TRACES_EXPORTER=console \
  -e OTEL_METRICS_EXPORTER=console \
  -e CATALINA_OPTS="$CATALINA_OPTS -javaagent:/tmp/opentelemetry-javaagent.jar" \
  -e JAVA_OPTS="-Dcom.sun.management.jmxremote         -Dcom.sun.management.jmxremote.local.only=false -Dcom.sun.management.jmxremote.authenticate=false -Dcom.sun.management.jmxremote.port=9999 -Dcom.sun.management.jmxremote.rmi.port=9999 -Djava.rmi.server.hostname=0.0.0.0 -Dcom.sun.management.jmxremote.ssl=false -Dotel.jmx.target.system=tomcat" \
tomcat:9.0The output from the command will look very similar to the output from running the JMX scraper:
04-Sep-2025 21:43:40.251 INFO [main] org.apache.catalina.startup.Catalina.start Server startup in [48] milliseconds
[otel.javaagent 2025-09-04 21:43:40:787 +0000] [jmx_bean_finder] INFO io.opentelemetry.javaagent.shaded.instrumentation.jmx.engine.MetricRegistrar - Created Counter for tomcat.error.count
[otel.javaagent 2025-09-04 21:43:40:787 +0000] [jmx_bean_finder] INFO io.opentelemetry.javaagent.shaded.instrumentation.jmx.engine.MetricRegistrar - Created Counter for tomcat.request.count
[otel.javaagent 2025-09-04 21:43:40:789 +0000] [jmx_bean_finder] INFO io.opentelemetry.javaagent.shaded.instrumentation.jmx.engine.MetricRegistrar - Created Gauge for tomcat.request.duration.max
[otel.javaagent 2025-09-04 21:43:40:789 +0000] [jmx_bean_finder] INFO io.opentelemetry.javaagent.shaded.instrumentation.jmx.engine.MetricRegistrar - Created Counter for tomcat.request.duration.sum
[otel.javaagent 2025-09-04 21:43:40:789 +0000] [jmx_bean_finder] INFO io.opentelemetry.javaagent.shaded.instrumentation.jmx.engine.MetricRegistrar - Created Counter for tomcat.network.io
[otel.javaagent 2025-09-04 21:43:40:789 +0000] [jmx_bean_finder] INFO io.opentelemetry.javaagent.shaded.instrumentation.jmx.engine.MetricRegistrar - Created Counter for tomcat.network.io
[otel.javaagent 2025-09-04 21:43:40:790 +0000] [jmx_bean_finder] INFO io.opentelemetry.javaagent.shaded.instrumentation.jmx.engine.MetricRegistrar - Created UpDownCounter for tomcat.thread.count
[otel.javaagent 2025-09-04 21:43:40:790 +0000] [jmx_bean_finder] INFO io.opentelemetry.javaagent.shaded.instrumentation.jmx.engine.MetricRegistrar - Created UpDownCounter for tomcat.thread.limit
[otel.javaagent 2025-09-04 21:43:40:791 +0000] [jmx_bean_finder] INFO io.opentelemetry.javaagent.shaded.instrumentation.jmx.engine.MetricRegistrar - Created UpDownCounter for tomcat.thread.busy.countIf our deployment already uses the OpenTelemetry Java Agent, we now have a way to collect JMX metrics without bringing in additional tooling. But what about the case where we would rather use an external tool instead? Don’t worry, OpenTelemetry’s swiss army knife is here!
Using the OpenTelemetry Collector and JMX receiver
The last method for converting JMX metrics into OpenTelemetry we’ll explore is using the OpenTelemetry Collector. The Collector provides many integrations and is usually deployed inside the infrastructure as part of the telemetry pipeline. The Collector is composed of many components, one of which is the JMX receiver, that uses the JMX scraper under the hood to interact with the Java application.
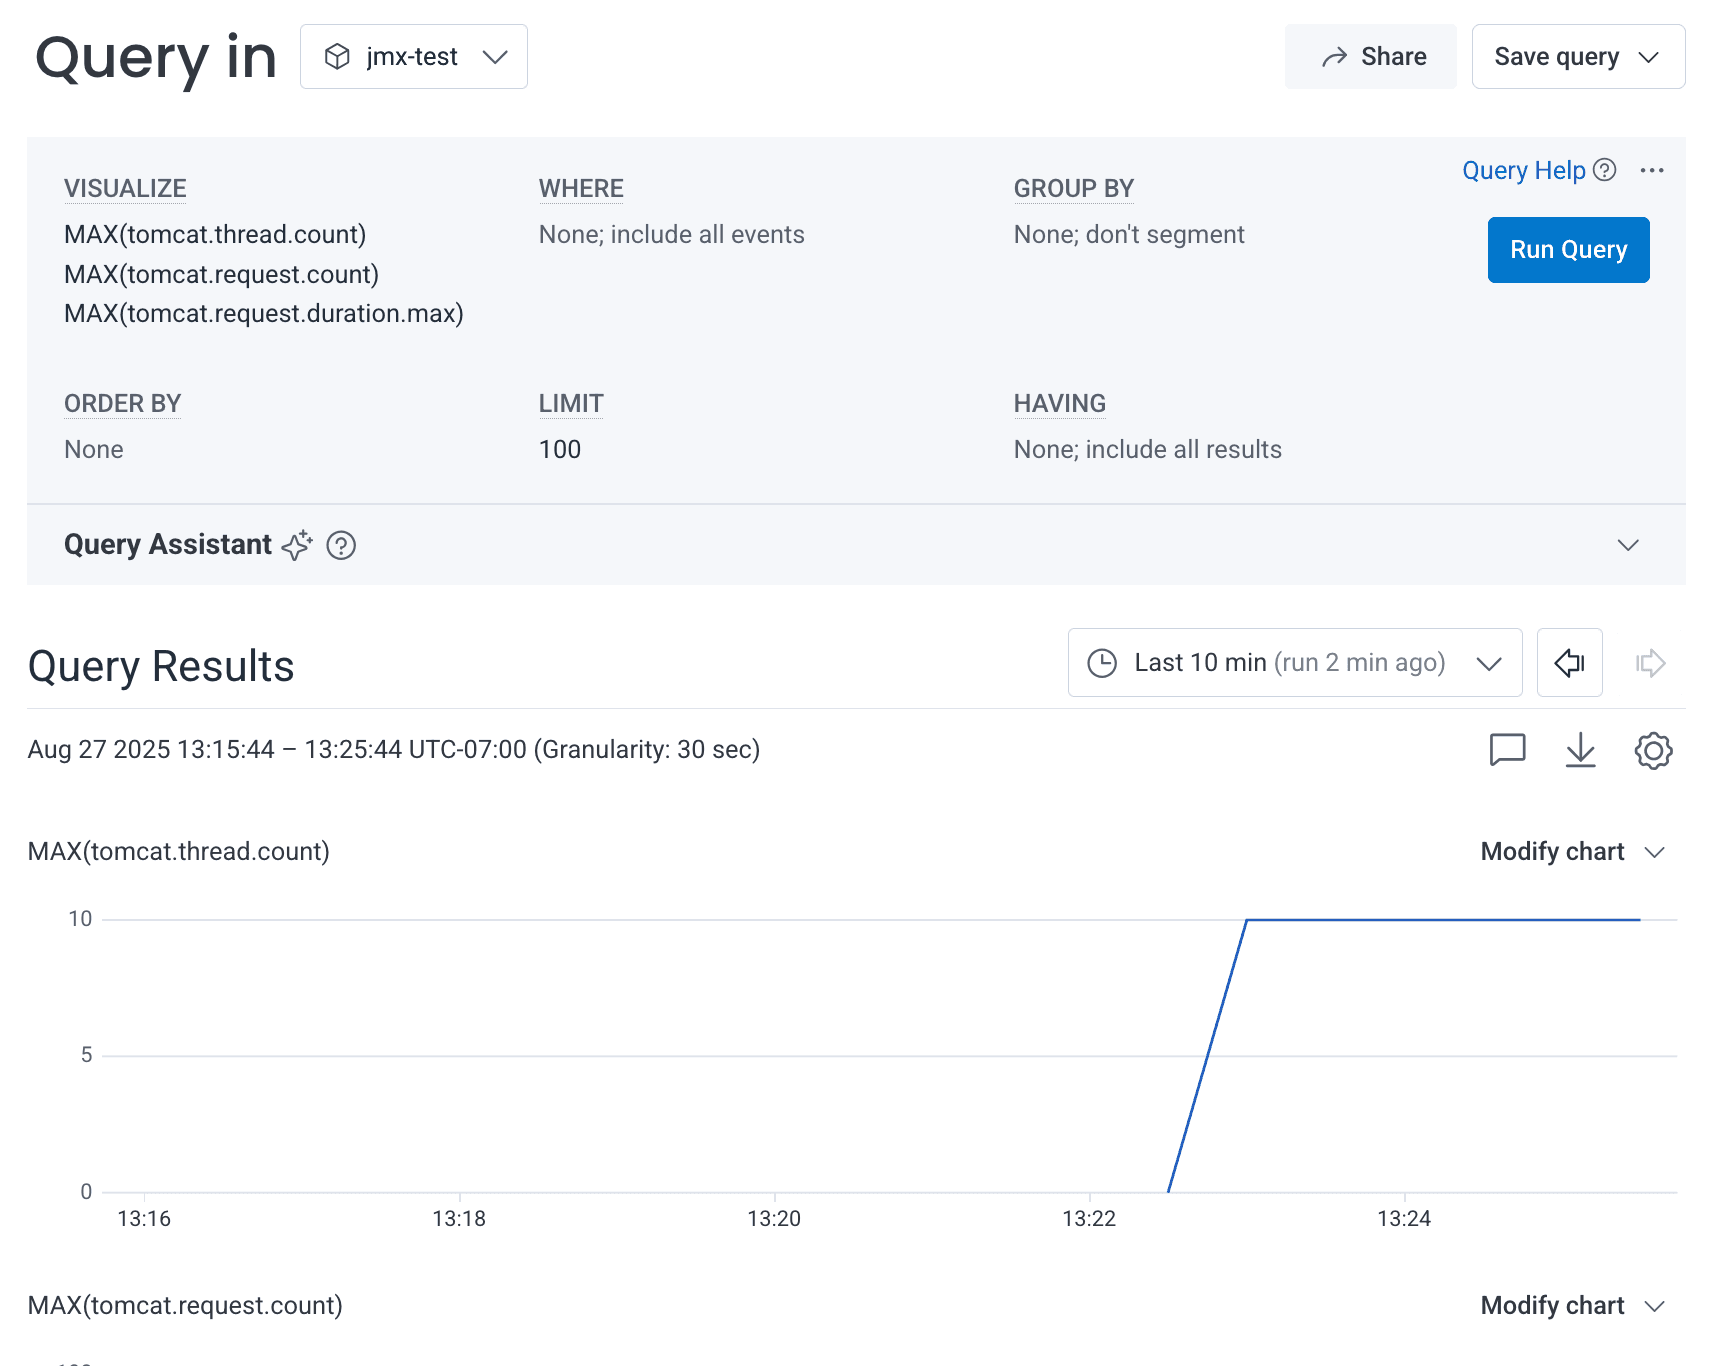
For the purposes of this example, we’ll continue with the tomcat application we have been using, and use the OpenTelemetry Collector Contrib distribution, published and maintained by the community. The following configuration file will be needed to run the Collector with the debug exporter which will emit metrics to the console. Since the Collector makes it easy to configure many exporters, we’ve added an OpenTelemetry Protocol (OTLP) exporter to send data to Honeycomb as well:
receivers:
 jmx/tomcat:
   jar_path: /tmp/opentelemetry-jmx-scraper-1.48.0-alpha.jar
   endpoint: localhost:9999
   target_system: tomcat
   collection_interval: 10s


exporters:
 otlphttp:
   endpoint: https://api.honeycomb.io:443
   headers:
     x-honeycomb-team: ${env:HONEYCOMB_API_KEY}
     x-honeycomb-dataset: jmx-test

 debug:
   verbosity: detailed


service:
 telemetry:
   logs:
     level: debug
 pipelines:
   metrics:
     receivers: [jmx/tomcat]
exporters: [debug, otlphttp]Note that for this configuration to work, we need to specify the location of the JMX scraper JAR, as the receiver itself does not include the JAR. With the configuration in hand, the following commands downloads the latest published version of the Collector Contrib distribution and runs it:
$ wget https://github.com/open-telemetry/opentelemetry-collector-releases/releases/download/v0.133.0/otelcol-contrib_0.133.0_darwin_arm64.tar.gz -O - | tar -xz
$ ./otelcol-contrib --config configuration.yamlThe output from the collector will include details from the JMX scraper as well as logs from the debug exporter to validate that the data is being exported as per the configuration. Additionally, if a valid Honeycomb ingest key has been set in the environment variable HONEYCOMB_API_KEY, the data will also appear in the jmx-test dataset in Honeycomb as per the screenshot below:
Using the Collector allows us to collect metrics without needing to modify the application or the environment the application runs in as long as it exposes the JMX port remotely. The Collector also adds some flexibility to transform or enrich the data as needed.
Custom applications
The list of applications supported by the OpenTelemetry community will not be enough to handle all the Java applications out there. Thankfully, it’s possible to define custom rules configuration files to support custom applications. The project’s official documentation describes in further detail the syntax of writing custom configuration. In the example below, we create rules that provide the mapping for a metric exposed by a Resin server. The configuration maps the JMX attribute ThreadActiveCount from the ThreadPool managed bean (MBean) in the resin namespace to a gauge with the name resin.threadpool.active.count in OpenTelemetry:
---
rules:
 - bean: resin:type=ThreadPool
   type: gauge
   unit: "{thread}"
   mapping:
     ThreadActiveCount:
       metric: resin.threadpool.active.count
desc: "Current number of active threads in the pool"Each method for integrating OpenTelemetry with JMX supports custom configuration files. The JMX scraper supports this via the otel.jmx.config property. The JMX receiver in the Collector can be configured using jmx_configs instead of target_system. A configuration to allow the Collector to use this custom file looks like this:
receivers:
 jmx/resin:
   jar_path: /Users/alex/Downloads/opentelemetry-jmx-scraper-1.48.0-alpha.jar
   endpoint: localhost:9999
   jmx_configs: /tmp/resin.rules.yaml
collection_interval: 10sAlthough support for jmx_configs has been documented in the JMX receiver for some time, a bug in the configuration parsing prevented its use until recently. We submitted the fix and it was published in v0.133.0 of the Collector, released in August 2025.
Conclusion
With this, we now have the tools in hand to integrate applications that produce JMX telemetry into any telemetry pipeline that supports OpenTelemetry. The flexibility of using either the JMX scraper, the Java Agent, or the Collector ensures that we can use the tool that makes sense for our environment with minimal impact to existing workflows.
New to Honeycomb? Get your free account today.
Get access to distributed tracing, BubbleUp, triggers, and more.
Up to 20 million events per month included.