Using Traces, Metrics, and Logs All in One Place, as Demonstrated by Pipeline Builder
We’ll walk through a real scenario my team experienced when our own telemetry pipeline experienced issues, which showcases the power of having all your telemetry available all at once in one place.

By: Tyler Helmuth

The Engineer’s Guide to Sampling
Read Now
When troubleshooting complex software, it’s important to be able to gain insight via its telemetry quickly and precisely. No one wants to waste time switching between tools or worrying about how to interact with different types of data.
At Honeycomb, all your data is available in one place, accessible via our fast query engine. But what does that look like in practice? Today, we’ll walk through a real scenario my team experienced when our own telemetry pipeline experienced issues, which showcases the power of having all your telemetry available all at once in one place.
New to Honeycomb? Get your free account today.
Get access to distributed tracing, BubbleUp, triggers, and more.
Up to 20 million events per month included.
Pipeline Builder
The scenario today comes from Pipeline Builder and its newly launched Pipeline Health feature. Pipeline Builder lets customers manage telemetry pipelines running on their infrastructure remotely, via Honeycomb. Using Pipeline Builder, you can configure and deploy telemetry pipelines to filter, transform, and sample all your data before it arrives in Honeycomb, all without leaving Honeycomb. For this story, the actual pipeline itself is what we’re interested in.
The pipeline installed by the customer is made up of three parts: OpenTelemetry Collectors, a Refinery cluster, and the managing service, Beekeeper. While customer data is flowing through this pipeline, each part of the pipeline produces traces, metrics, and logs about itself. This data is sent to a complementary environment in Honeycomb that the customer can query.
The outage
The team I’m on develops Pipeline Builder, and as part of that development, we have an installed pipeline in our Dogfood environment. One day during development, I deployed a new config. Instead of successfully rolling out, I was surprised when the deployment failed.
This can be a scary moment as anyone who has used remote config management before will tell you. A failed deployment brings a state of unknown. Is the whole pipeline down? Are some of the agents running the new config and some old? What went wrong? In times like these, it’s easy to resort to SSHing into a server or k9s-ing into a cluster to look at pods.
But with Pipeline Health, I didn’t need to panic or k9s into our kubernetes cluster. I clicked on the Health tab and started reviewing the curated queries.
Pipeline health
The great thing about Pipeline Builder is that its pipeline’s default mode is to send as much useful telemetry to Honeycomb about itself as it can. So when I had a failed deployment, I knew I’d have all the traces, metrics, and logs about my pipeline.
Like most software nowadays, telemetry pipelines are complex. There are a lot of interesting interactions between the different pieces and lots of potential unknown-unknowns. Producing loads of telemetry is not enough; you need a tool that helps you sift through it all for the important stuff.
That's where Pipeline Health and Honeycomb’s query engine come in. Pipeline Health is tailor-made for the telemetry produced by the OpenTelemetry Collectors, Refinery cluster, and Beekeeper from the pipeline installation.
The first thing it shows is, “Is data making it to and through my pipeline?” When I clicked on the health tab, that's the first thing I checked.

I quickly saw my Collectors were still receiving my application’s traces, metrics, and logs. In the second row, I could see no trace data was exiting my Collectors, but metrics and logs were exporting fine. So who is at fault? At this point, I knew an interaction was broken between the Collectors and Refinery instances, but didn’t know which to blame.
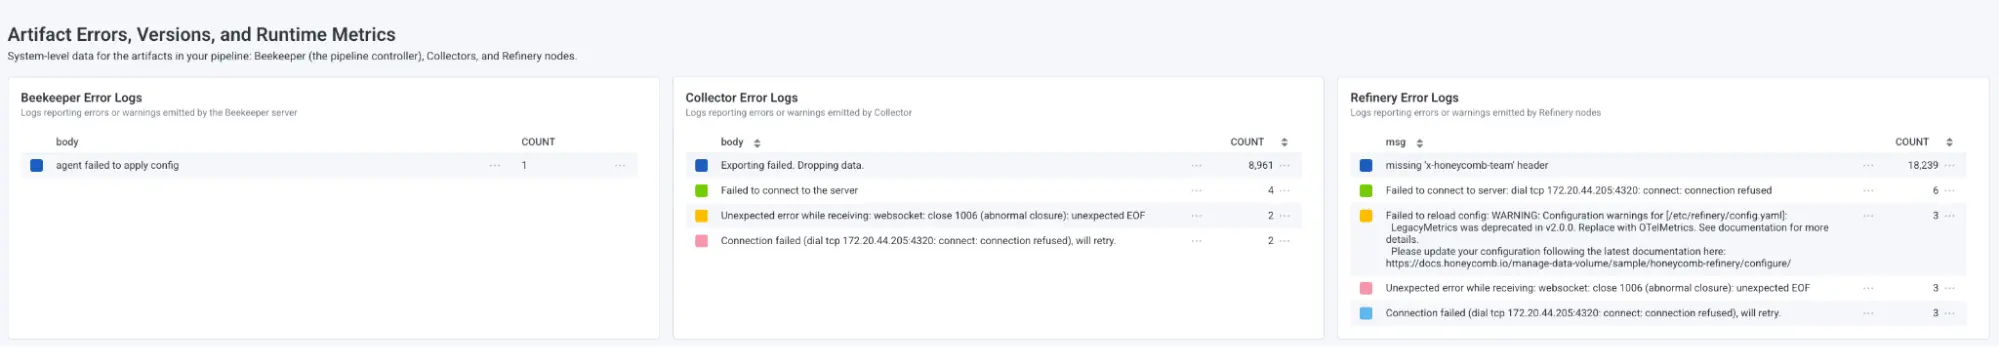
I kept scrolling and saw the Refinery logs reporting that Refinery couldn’t accept the configuration of the new deployment. That’s strange though, as Pipeline Builder has safeguards to prevent deploying invalid configuration. How could Refinery not accept the configuration? Was there a bug?
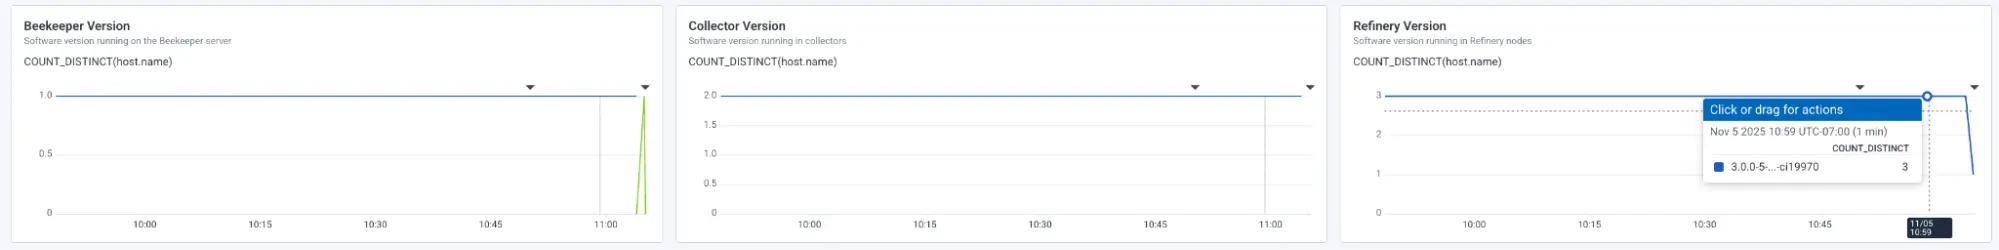
In a graph below my Refinery logs, I could see the issue: I wasn’t running the Refinery version I thought I was.
The culprit (it was me. I was the problem.)
During early development of Pipeline Builder, we found it really helpful to deploy our pipeline using latest-main image tags to be able to quickly run the latest unreleased version. Pipeline Builder went Beta in June, and since then, we haven’t had to make many changes to the artifacts—but we also never went back to change the tags. In the meantime, Refinery 3.0 was under heavy development. As part of testing all those amazing performance gains, the team was stress testing Refinery 3.0 dev builds using the same ECR registry that our dev pipeline installation was using. Since our pipeline was configured to pull the latest-main image, once the breaking changes in Refinery 3.0 were merged to main, our pipeline installation started using Refinery 3.0. But Pipeline Builder wasn’t ready to deploy Refinery 3.0 configurations, so when it tried to deploy a 2.x Refinery configuration to a bunch of Refinery 3.x instances, they broke. The fix was to update the cluster to use Refinery 2.9.7 again. Additionally, Pipeline Builder now has additional guardrails to ensure config version mismatch like that can’t happen.
The result
Thanks to Pipeline Health and Honeycomb, this investigation took about one minute. The coolest part was I didn’t need to worry about whether I was looking at traces, metrics, or logs, I just got to use my data. The Collector and Refinery incoming/outgoing graphs happen to be metrics and the Refinery errors and agent versions happen to be logs. But none of that mattered while I was investigating. Honeycomb’s query engine lets the Pipeline Health page display all these different types of data in one place as if they are the same.
I didn’t have to jump between tools or query languages. I didn’t have to k9s into my cluster and inspect the pods themselves. I got to take advantage of Honeycomb’s database and curated views to investigate and resolve the problem quickly.