Production Telemetry Analysis & Diagnosis
Analyze Problems Faster
Production issues happen. What doesn’t need to happen is inefficient searching and juggling multiple tools just to find the problem before you can begin to understand and resolve it. Honeycomb gives you precious time back. You don’t need to spend cycles looking for the issue and maybe never find it.
Honeycomb gives you the fastest path to analyze production system data that matters to your business. With a familiar UI design, to a flexible query builder, BubbleUp for finding outliers, and built-in distributed tracing, we give you powerful insights that makes life easier.
Less Time Finding Problems & Faster Time to Resolve

Query
Blazing fast query against your system event data gives real-time insights. Know what's happening right now. Teams collaborate and history is retained.
Query
Visualize
Honeycomb's home page UI/UX gives users a familiar workflow and a great jumping-off point to dive in and diagnose issues quickly. Debug and improve your prod in hi-res.
Visualize
Trace
Switch to distributed tracing views and spot errors and latency with amazing efficiency. Easily switch back to heatmaps or line-charts and get all the context you need.
Trace

"Answering the question, 'Is this affecting all our users or just the subset?' is absolutely the thing that Honeycomb does that no one gets near."
Read the case study (no login)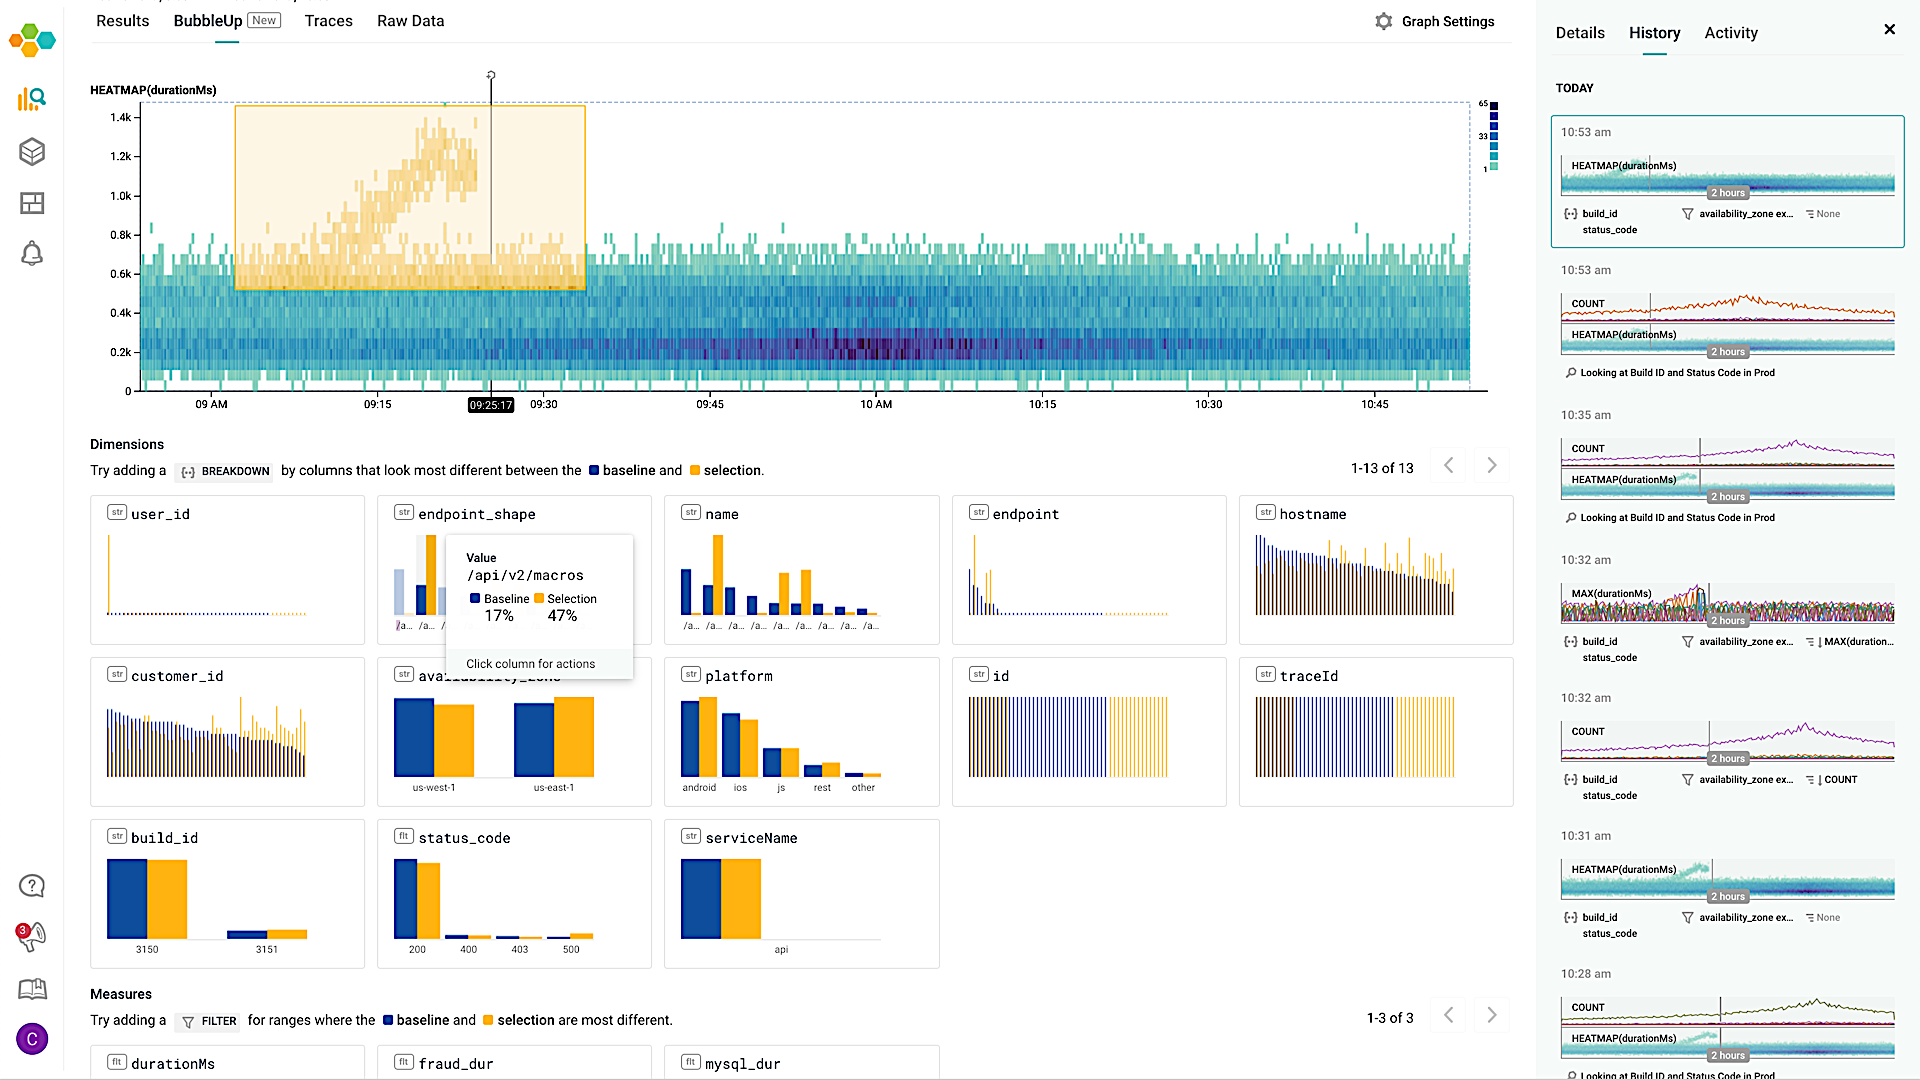
Break Down Your Data on Every Dimension
The special thing Honeycomb brings is that you break down on both the obvious fields, and the surprising ones.
Lots of systems let you slice and dice by, for example, the region that a user is logging in from — but Honeycomb lets you break down on every dimension in your data.
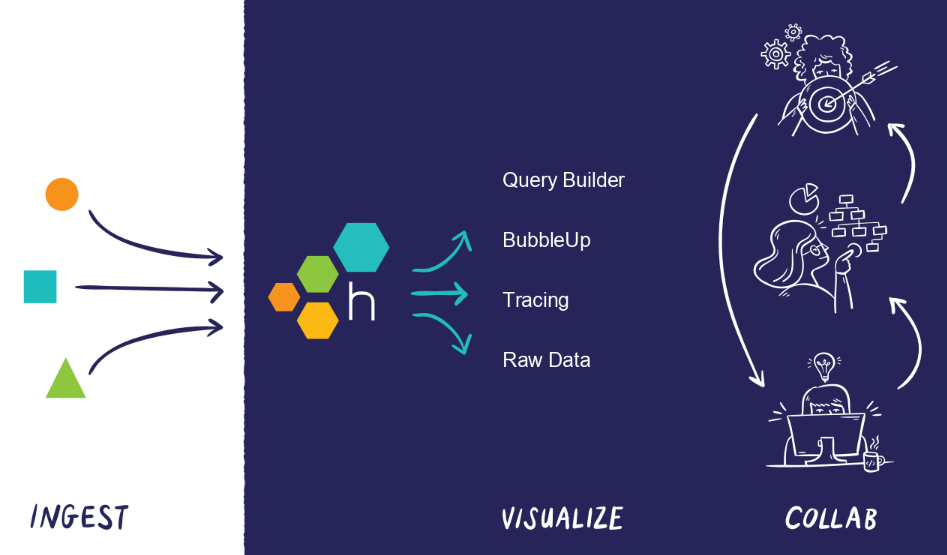
The Core Analysis LoopAnalytics-First Debugging Starts with a Query Engine
An “analytics-based” system ingests structured data and instantly provides the ability to query, perform mathematical comparisons, and interact with visual charts to easily spot trends, patterns, or outliers.
Honeycomb’s analytics and visualization allows you to begin to understand the breadth of an issue, the nature of the problem and with the ability to drill-down, find specific details. View this webcast that covers how analytics-first debugging starts with strong query.
Honeycomb Webinars