Announcing Honeycomb for Frontend Observability React Native Beta
The new Honeycomb-maintained React Native SDK built on OpenTelemetry gives you the best of both worlds: modern, open standards to avoid lock-in and a more streamlined setup. Spans from your React Native app also automatically propagate for seamless end-to-end tracing.

By: Elsie Phillips

It’s 2025, The Frontend Deserves Observability Too
Watch Now
React Native apps straddle two worlds: JavaScript powering your UI and native modules running underneath. Add in backend services, and when something goes wrong, there are many possible culprits. Was it JS logic, the native bridge, the native API call, or a downstream API call?
Most tools give you parts of the picture. A crash tool can tell you where the app failed but not what else happened in a session. Performance monitors surface slow navigations but don’t always connect them to the backend service that caused them. Even when tools do capture both sides, you often end up flipping between dashboards or working within rigid, predefined metrics.
What React Native teams need is a way to connect those dots: the user action in JavaScript, the native layer, the backend request, along with all the relevant business and system context. To make that a reality, today we are extending Honeycomb for Frontend Observability with beta support for React Native.
What’s included
React Native has always promised the speed of a shared codebase, but debugging often breaks that promise. When an issue surfaces, teams are forced to jump between JavaScript, native layers, and backend logs, stitching together context. The result is longer investigations, delayed releases, and a lot of guesswork.
React Native SDK
The new Honeycomb-maintained React Native SDK built on OpenTelemetry gives you the best of both worlds: modern, open standards to avoid lock-in and a more streamlined set up. Spans from your React Native app also automatically propagate for seamless end-to-end tracing.
It includes:
React Native exclusive auto-instrumentation
- App startup
- Error handler
- Fetch instrumentation
- Slow event loop detection instrumentation
- UI Interaction (automatic but requires some additional configuration).
iOS auto-instrumentation
Android auto-instrumentation
- Activity lifecycle, including traces before, during, and after each stage
- Application Not Responding (ANR) events
- Crash instrumentation for uncaught exceptions
- Slow or frozen renders
- UI interaction
In addition to auto-instrumentation, for no extra cost, you can consolidate all your business and systems context. Each event can have up to 2k custom attributes for free, and you can query on all of them ad-hoc in your investigations.
Launchpad for React Native

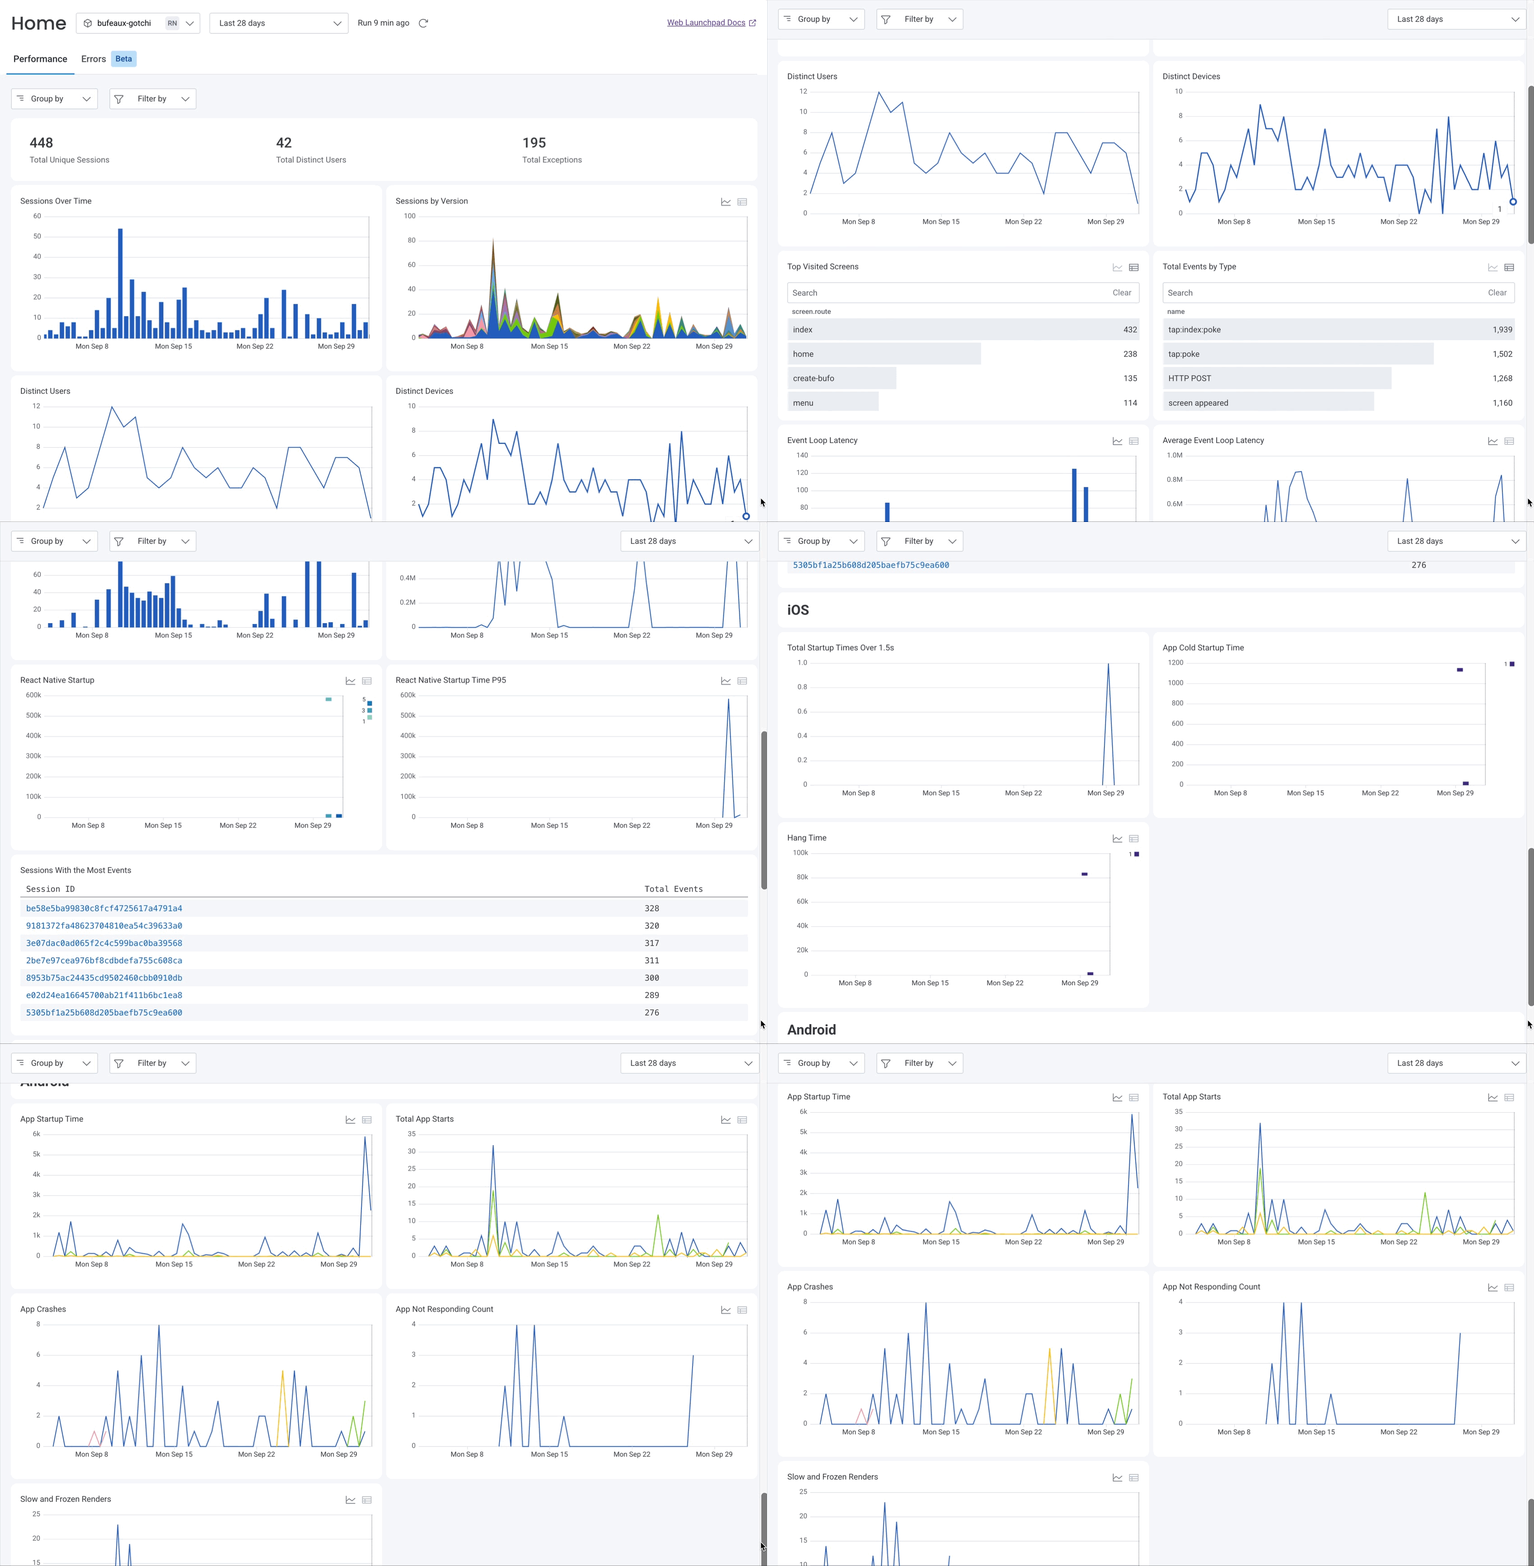
The React Native Launchpad brings the same debugging homebase experience you already know from Android and iOS Launchpads, but tailored for cross-platform mobile teams.
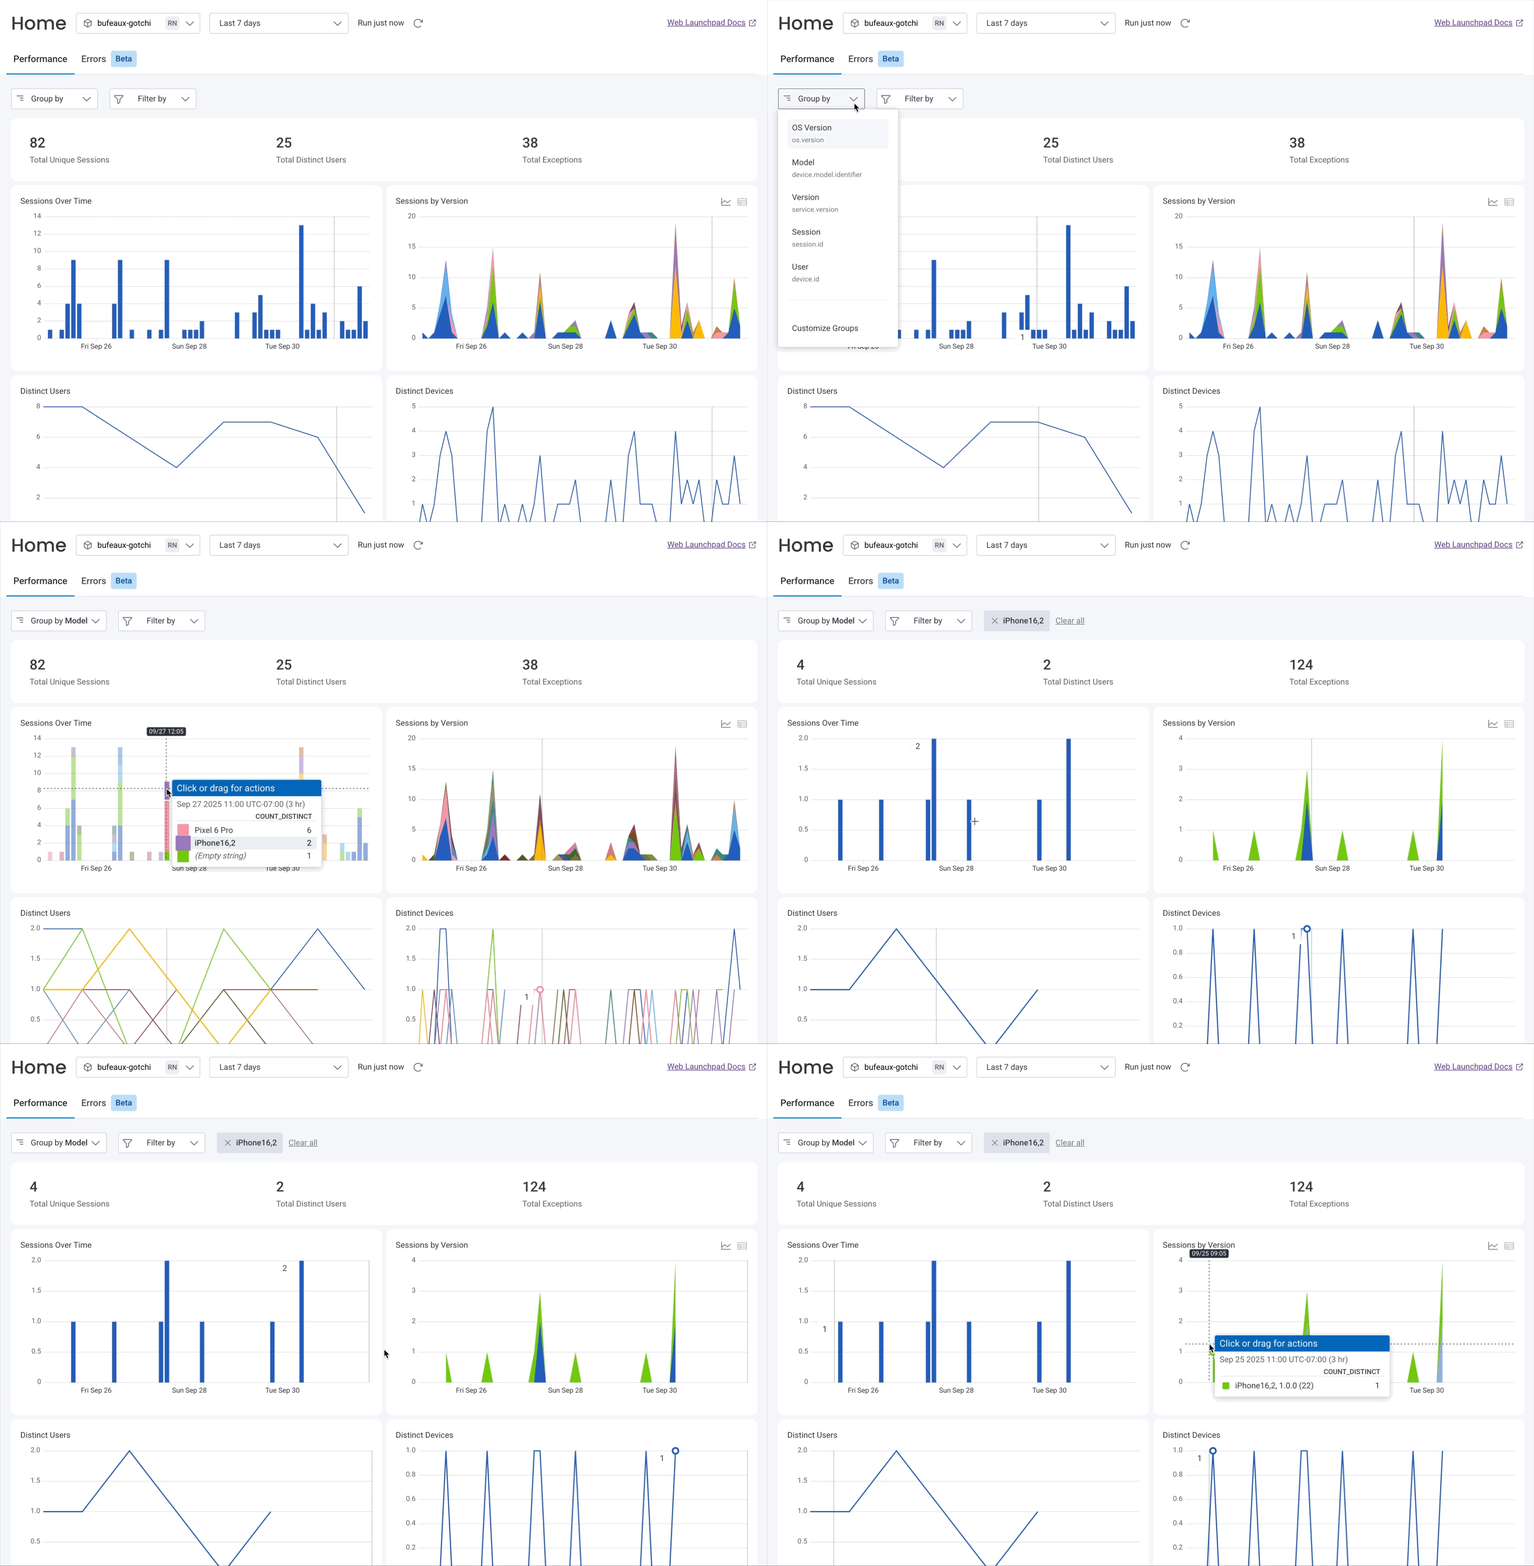
The Launchpad puts key mobile health signals, what we call Core Mobile Vitals, front and center and makes them filterable by device, OS, app version, network type, and more. That way you can move from a broad performance view to the exact conditions behind an issue in just a few clicks.
Views that unlock faster insight
The React Native Launchpad includes views built specifically for the questions mobile engineers ask most often:
- Sessions over time: Visualize user activity trends and quickly spot spikes or regressions.
- Sessions by version: Compare session patterns across app versions to catch regressions tied to new releases.
- Distinct users: See how many unique users are represented in your data for a clearer sense of reach and impact.
- Distinct devices: Track how your app behaves across the range of devices in use.
- Top visited screens: Identify where users spend the most time and which screens matter most for stability and performance.
- Total events by type: Break down interactions like taps, navigations, and screen loads to understand how features are being used.
- Event loop latency: Detect delays in the JavaScript event loop that cause sluggish or janky experiences.
- Average event loop latency: Monitor longer-term trends in event loop health to prevent hidden slowdowns.
- Sessions with the most events: Highlight the noisiest or most active sessions so you can drill in and investigate unusual behavior.
- Total startup times over 1.5s (iOS): Spot iOS startups that take too long and risk frustrating users.
- App cold startup time (iOS): Measure how long iOS apps take to launch from scratch.
- Hang time (iOS): Surface cases where the app appears frozen or stuck after launch.
- App startup time (Android): Track launch speed on Android devices to understand startup performance.
- Total app starts (Android): Monitor how often the app is being launched to measure engagement and usage.
- App crashes (Android): Keep tabs on crash counts to quickly identify stability problems.
- App not responding count (Android): Detect when apps freeze or lock up so you can resolve unresponsive states.
- Slow and frozen renders (Android): Pinpoint rendering issues that degrade smoothness and user experience.
Each view is fully interactive and editable: you can filter or drill down by any dimension to all the underlying data of the visualization to explore further, narrow your investigation, and find root causes.

From signal to root cause
When you need to see user journeys, the Launchpad connects you directly to end-to-end traces that begin in React Native and flow through your backend services. You can follow the entire request journey from the first tap on screen through every downstream dependency, to understand exactly where and why performance issues occur.
To make this process even faster, the Launchpad includes BubbleUp outlier detection. Instead of manually inspecting attributes one by one (device type, OS, release, region), BubbleUp automatically analyzes up to 2k attributes per span and highlights what’s most correlated with bad experiences. That could be a flaky API, a rollout gated by a feature flag, or an issue isolated to a single device family.
Get started
With Honeycomb’s React Native support engineers get end-to-end visibility across every layer that matters without any gaps, so a performance dip in production can be traced from the tap on screen through native code and into backend services. Instead of fragmenting context, the Launchpad provides a single, reliable view where mobile, frontend, and backend teams no longer debate what happened and where because the data tells a single story.
React Native support in Honeycomb for Frontend Observability is available today in beta for Honeycomb Enterprise customers. If you're already using Honeycomb for Frontend Observability, the first step is to download the React Native SDK.
Once you have instrumented your app, the data will automatically populate in a React Native Launchpad in a Honeycomb dataset named after your configured service name. In the dataset settings, mark it as a "Frontend Observability" dataset and select "React Native." This will enable the React Native Launchpad feature.
Check out the docs to get started with our iOS and Android SDKs, or reach out to our support team for hands-on help.
If you'd like to learn more or see a tailored demo of end-to-end observability, book time with our team.