How Honeycomb Helped Intercom Transform the Way They Observe and Operate Fin.ai
Kesha Mykhailov, Engineer at Intercom, recently shared the remarkable journey of how Honeycomb helped the Intercom team transform how they observe and operate Fin from a slow, frustrating customer experience into what Intercom now calls "the #1 AI agent for customer service." The secret? Finding a way to measure customers’ real experience with Fin, and connecting every change, experiment, and optimization back to that one measurement. Here’s Fin.ai’s story, in Kesha’s own words.
Reduction in median time to first token (below eight seconds as of March 2025)
SLOs defend performance gains and kickstart rapid response to degradations
Realtime cost optimization with immediate and granular visibility into LLM efficiency
Intercom's Fin is the first AI agent that delivers human-quality service and can handle your entire frontline support.
Software
Honeycomb Platform, LLM Observability

By: Kesha Mykhailov
The most important efficiency metric
When Intercom embarked on building Fin, our main goal was nothing less than to create a truly revolutionary customer service agent.
The main job of such an agent is to answer end user questions on our customers’ behalf. In the age of AI, Fin’s customers are true pioneers: they are transforming their support operations to offload repetitive and mundane conversations to Fin while freeing up their support teams to work on more involved and complicated requests.
When Fin is able to answer a question while chatting with the end user, we consider that conversation resolved. Hence, the percentage of conversations Fin is able to resolve when engaged is the most important efficiency metric. We call it the resolution rate.
Increasing resolution rate
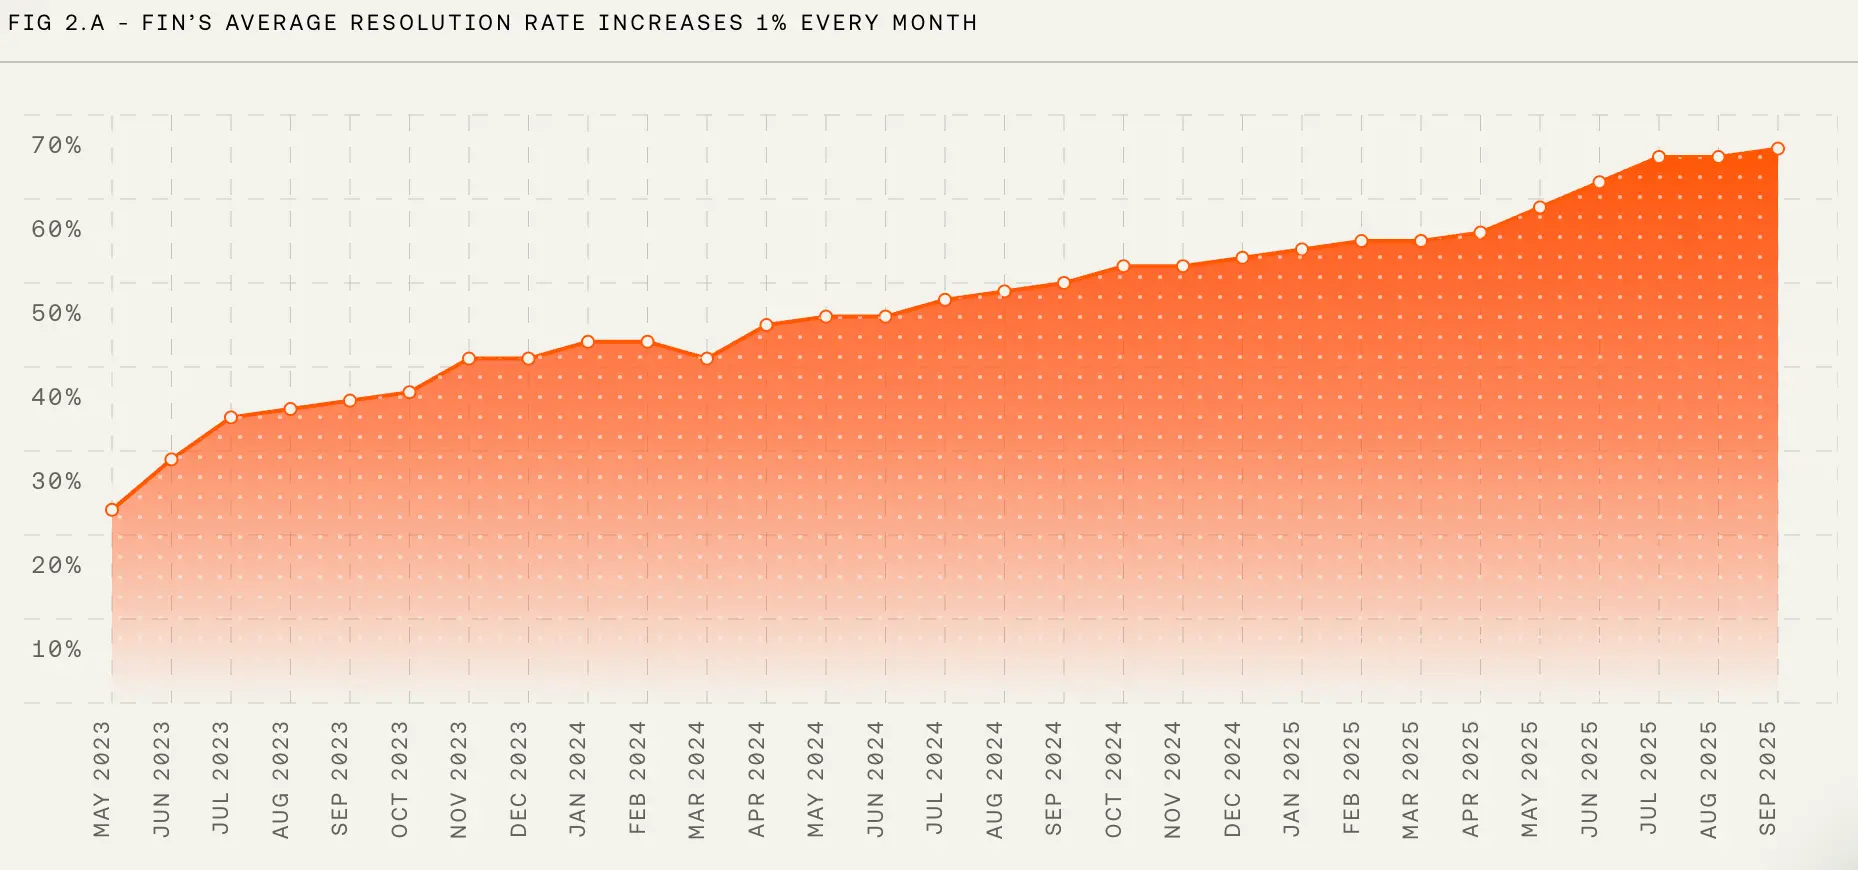
Naturally, our customers are incentivized to increase their Fin’s resolution rate through high-quality content that is crucial for Fin to provide an accurate answer. On the other hand, we at Intercom push ourselves to increase Fin’s efficiency because we only charge our customers for the conversations that are, in fact, resolved. These ‘aligned incentives’ are a secret sauce that makes Fin the #1 customer service agent. Since Fin launched in March 2023, its resolution rate has steadily increased by about one percentage point per month. And this is not some marketing data tweaked to make Fin appealing; this is an honest signal averaged across all of the customers using Fin.
Resolution rate is not an easy metric to improve. We had to evolve Fin from a single LLM call into a complicated agentic system that follows customer guidance, invokes actions, and completes tasks.
At any given time, we have dozens of A/B tests running in production adding or refining those powerful capabilities. Every individual test delivers only a fraction of a percentage point of improvement to resolution rate by itself. It is only stacking them up together over time that enables this steady growth. Such evolution comes at a cost: new functionality increases the time Fin takes to process a query. While we kept an eye on Fin’s latency, we deliberately prioritized capabilities and efficiency over speed.
Speeding up without losing efficiency
In early 2025, we started getting complaints from both existing customers and potential buyers that Fin was slow. Despite our strategy, we took customer complaints seriously and started an engineering effort to figure out how to speed Fin up without affecting its efficiency.
To understand what happened, we have to take a look at what Fin is from the engineering perspective: Fin is built on top of Intercom's existing customer platform and is deeply integrated with existing support workflows. As a result, Fin is a complex distributed system with multiple network transactions involved in processing a given interaction.
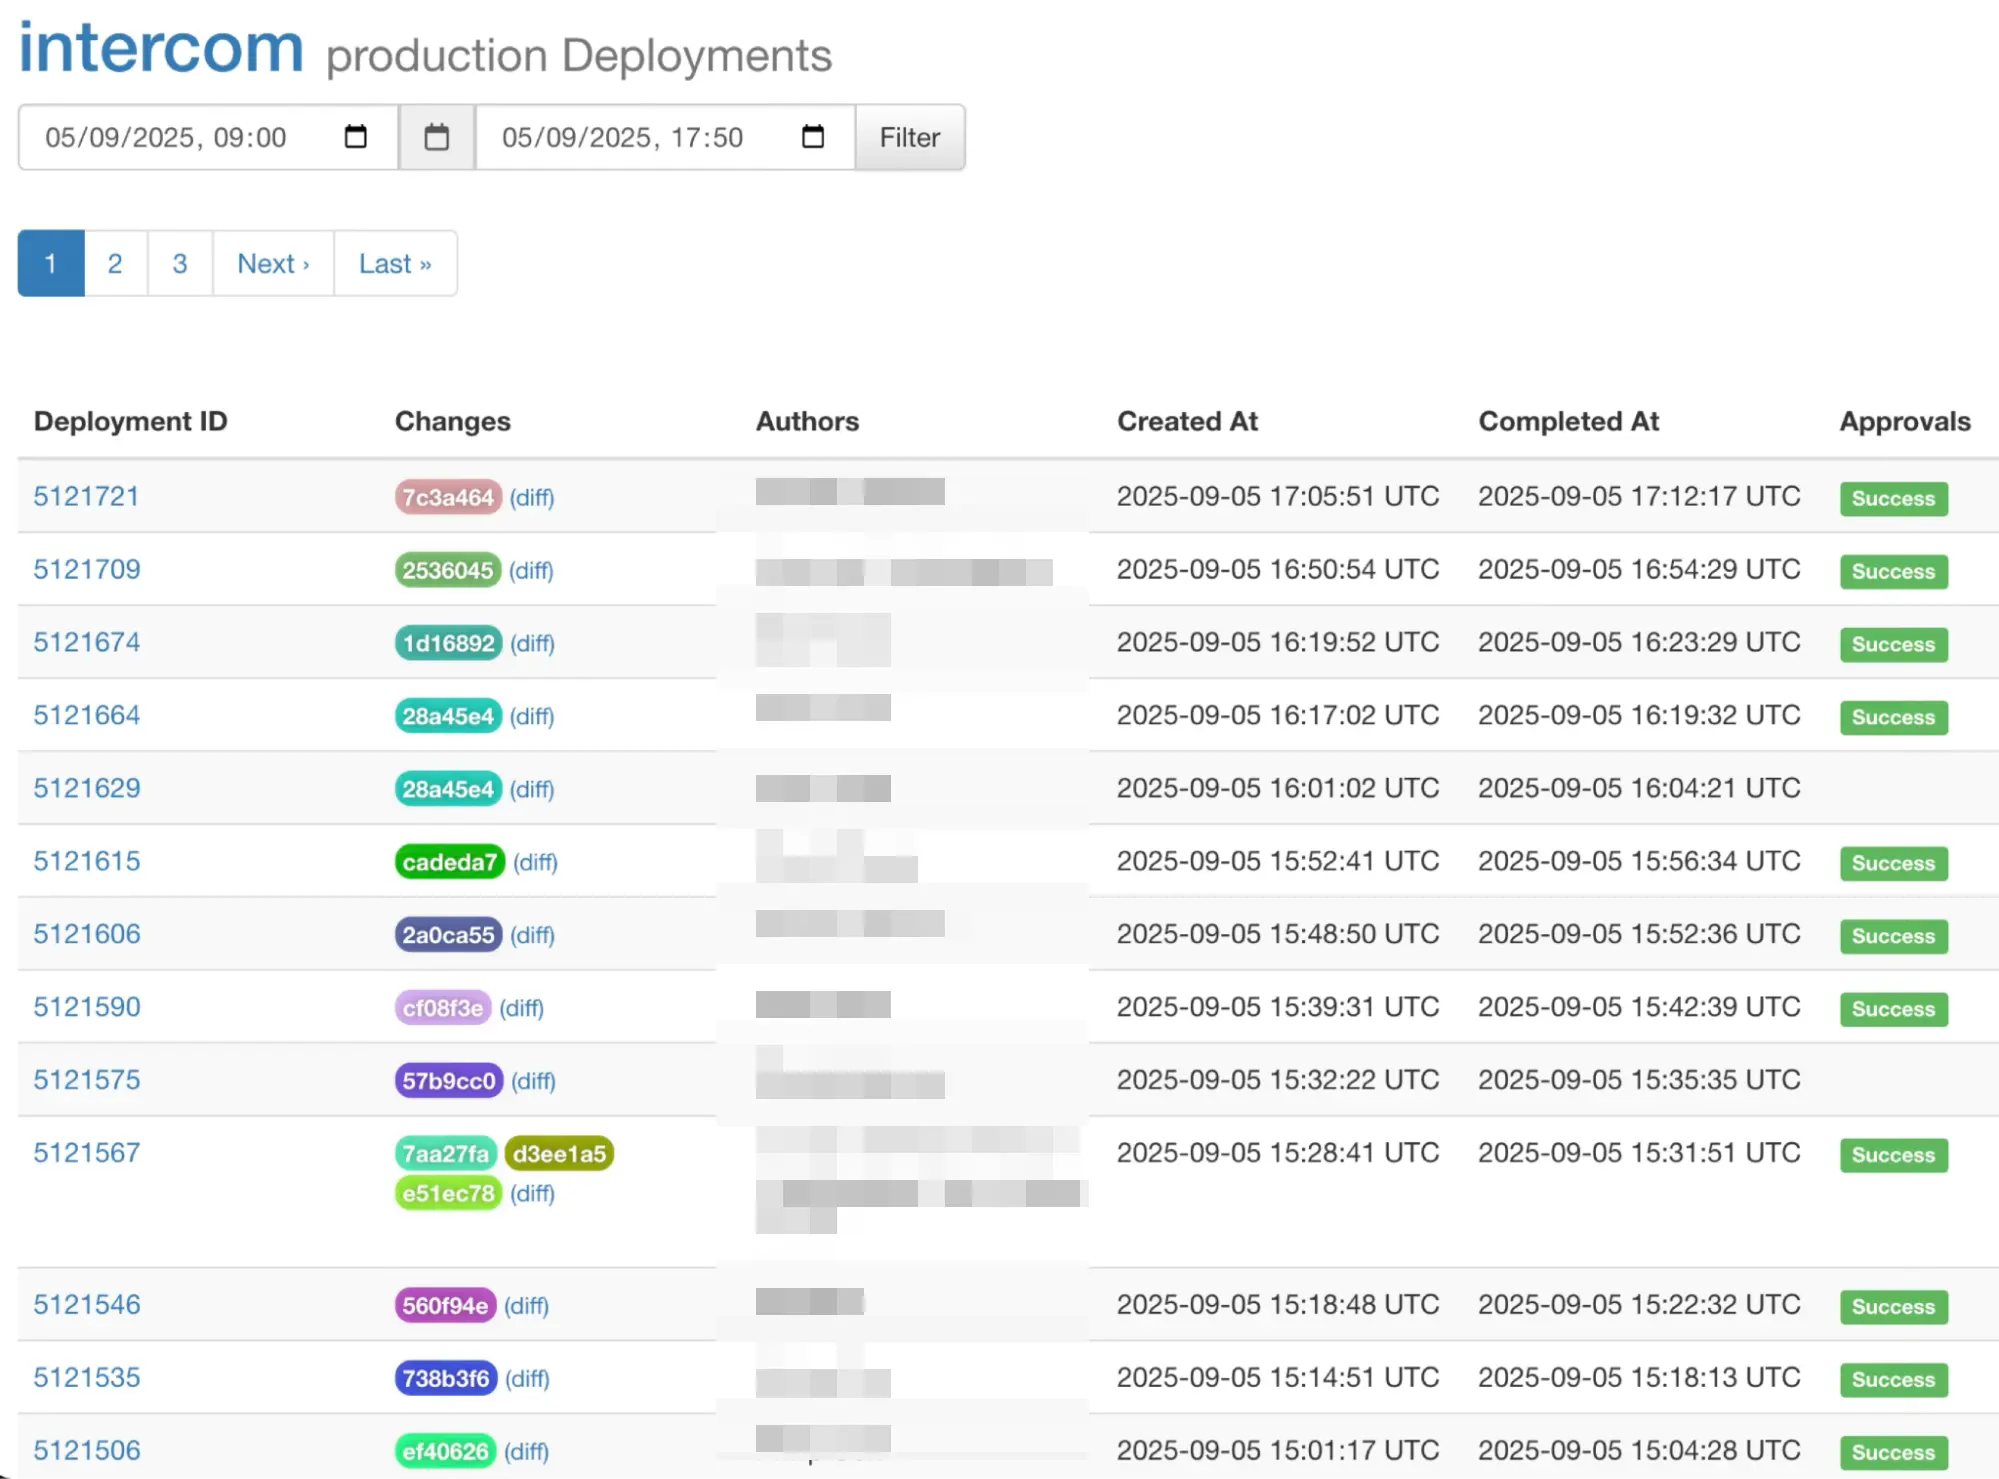
On top of this, Fin is constantly evolving. Hundreds of engineers from 20 different engineering teams ship changes to the code directly involved in processing Fin’s interactions. At Intercom, shipping is our heartbeat—and even on a typical Friday, our heartbeat is measured at ~100 individual changes shipped per day. This rate of change is where the real complexity comes from.
As customer complaints surfaced, engineers got to work. Optimization pull requests were flying left and right with many charts indicating significant improvements in Fin’s individual components. But our customers and prospects wanted more.
It became clear that while we were focusing on the performance of the individual components, we lacked a signal that represented the time end users were waiting for Fin to reply. To build deep empathy with our customers and experience that slowness in exactly the same way they did, we decided to surface an end-to-end signal: the time from when the user message is submitted to the time the first tokens of Fin’s reply are rendered in Intercom Messenger.
And thus, “time to first token” was born
Measured on the frontend, this “time to first token” accurately represented the customer’s experience. From then on, every change we made to the system had to positively affect “time to first token.”
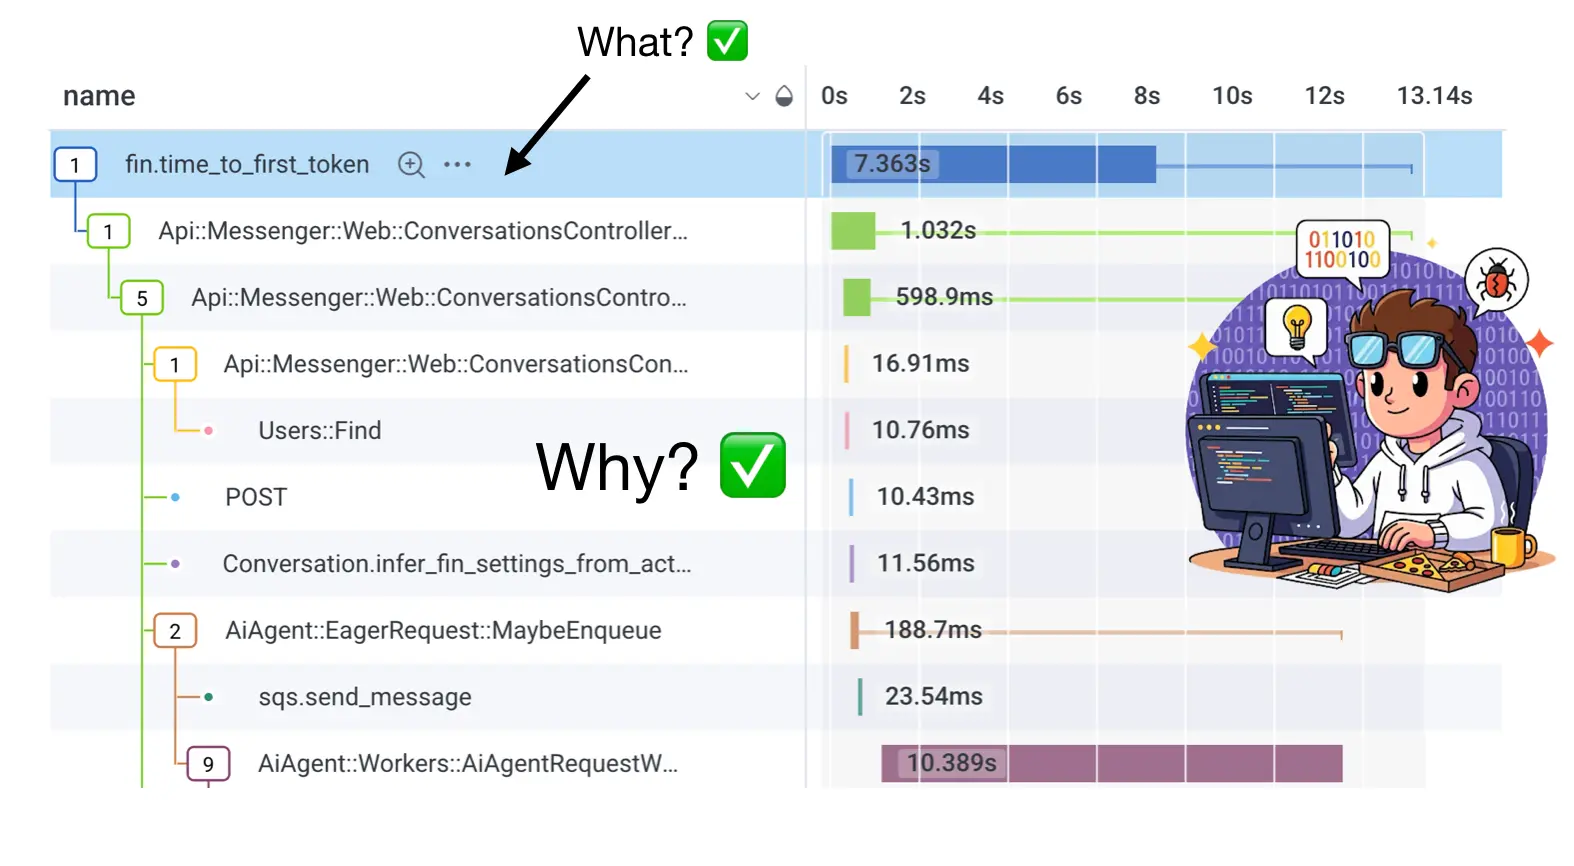
Our first attempt didn’t go well. We surfaced our new customer-centric signal in a new tracing dataset where the root span duration represented “time to first token” while child spans represented duration of the network transactions involved in the processing:
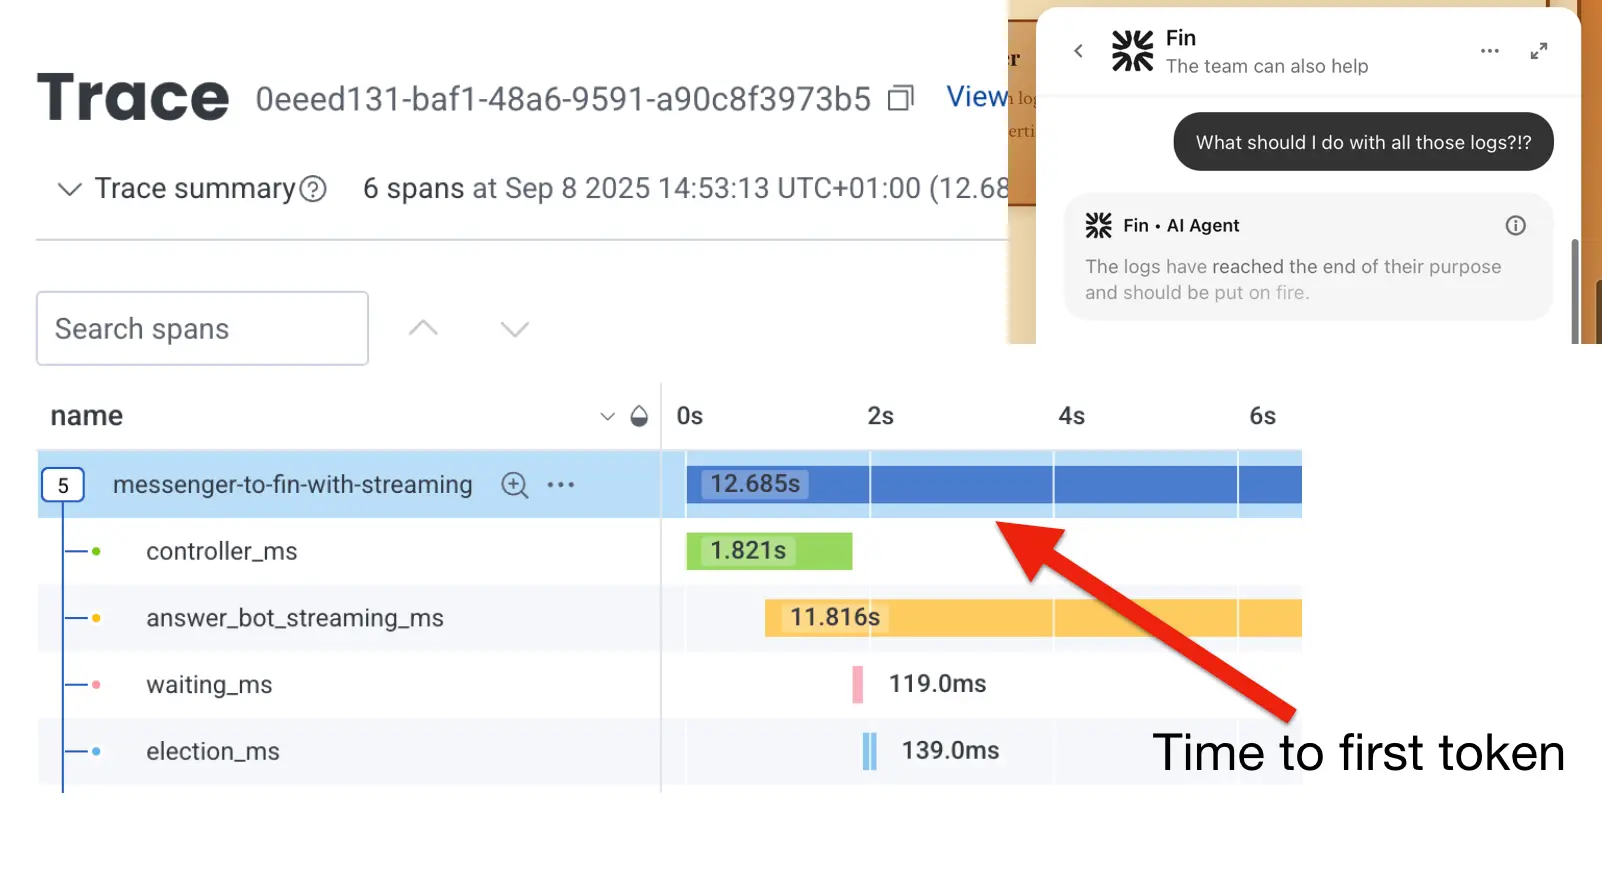
Our engineers could answer the question of what (e.g., “what is the median time to the first token?”), but they couldn’t understand the why behind it, as they couldn’t map that high-level signal to the code they were working on. Our new tracing data lacked required details for the engineers to dig for the root cause.
While we were trying to empathize with our customers, we lost touch with our own engineers. But failing is part of the process, and we did learn something from this experience: we understood exactly why our initial attempts to optimize Fin’s speed were not successful.
If you think about a distributed trace of a complex system like Fin, you might naively think transactions over time would look something like this:
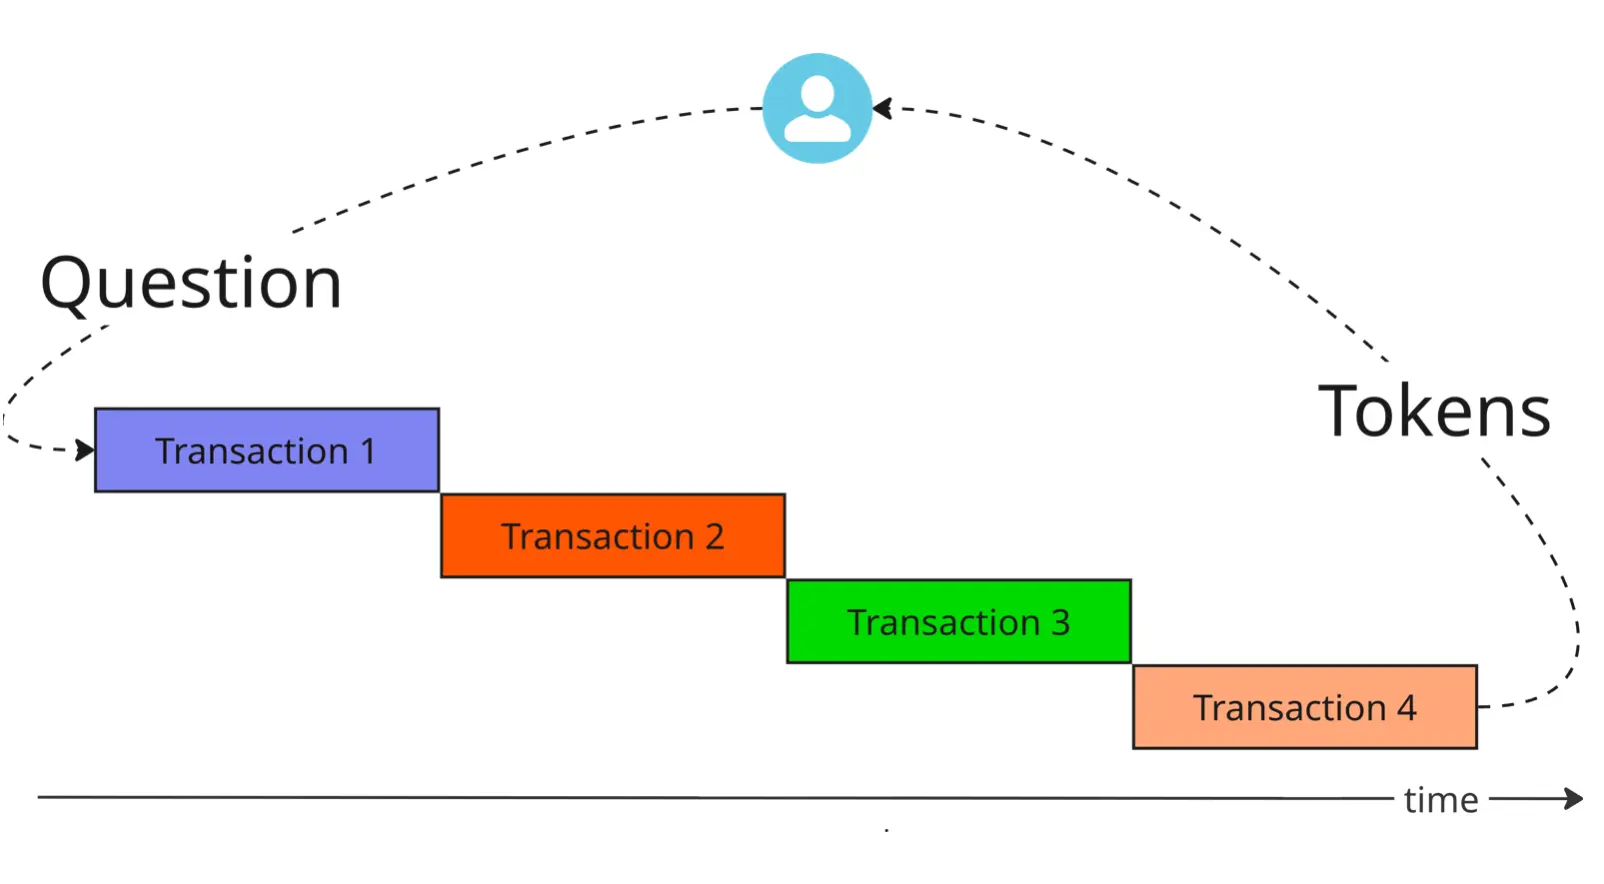
Here, every transaction’s “start” is aligned with the “end” of the previous transaction with the answer tokens streamed back to the user at the end.
In reality, it is a lot more complicated and looks like this:
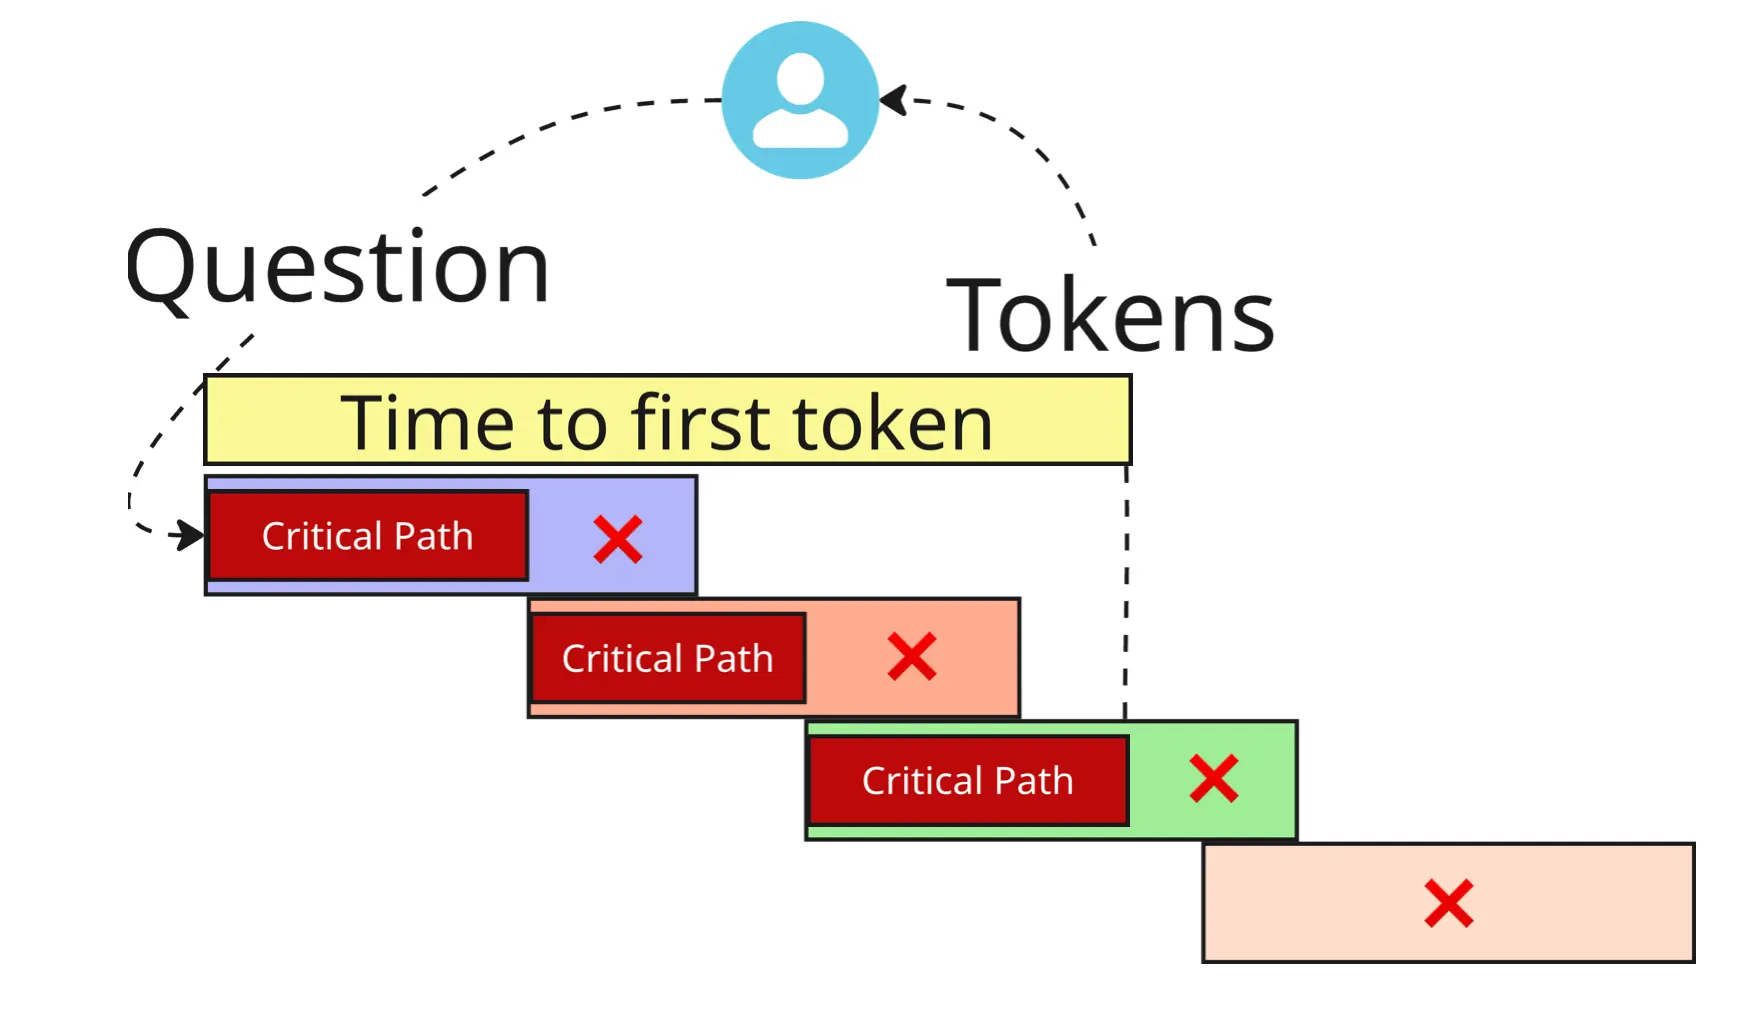
Transactions are not aligned with the control flow passed to the next transaction in the middle of the previous one. And some transactions are not even on the critical path at all!
As we improved the speed of individual components, we didn’t know which were on the critical code path. Were they directly blocking the progress of Fin’s interaction, or were they part of the processing done after Fin’s interaction moved to the next transaction?
To understand a system like this, a distributed trace has to include low-level telemetry to identify where exactly control flow is passed over to a different transaction and be able to identify things that lie on the critical path. We had to start from scratch and build new distributed traces with low-level spans attached to the transaction spans. With the new traces, not only were we able to empathize with the customers by answering the question of what; we also gave our engineers a way to answer why.
Armed with this new telemetry we were able to quickly move forward and meaningfully improve Fin’s latency.
Speeding Fin up
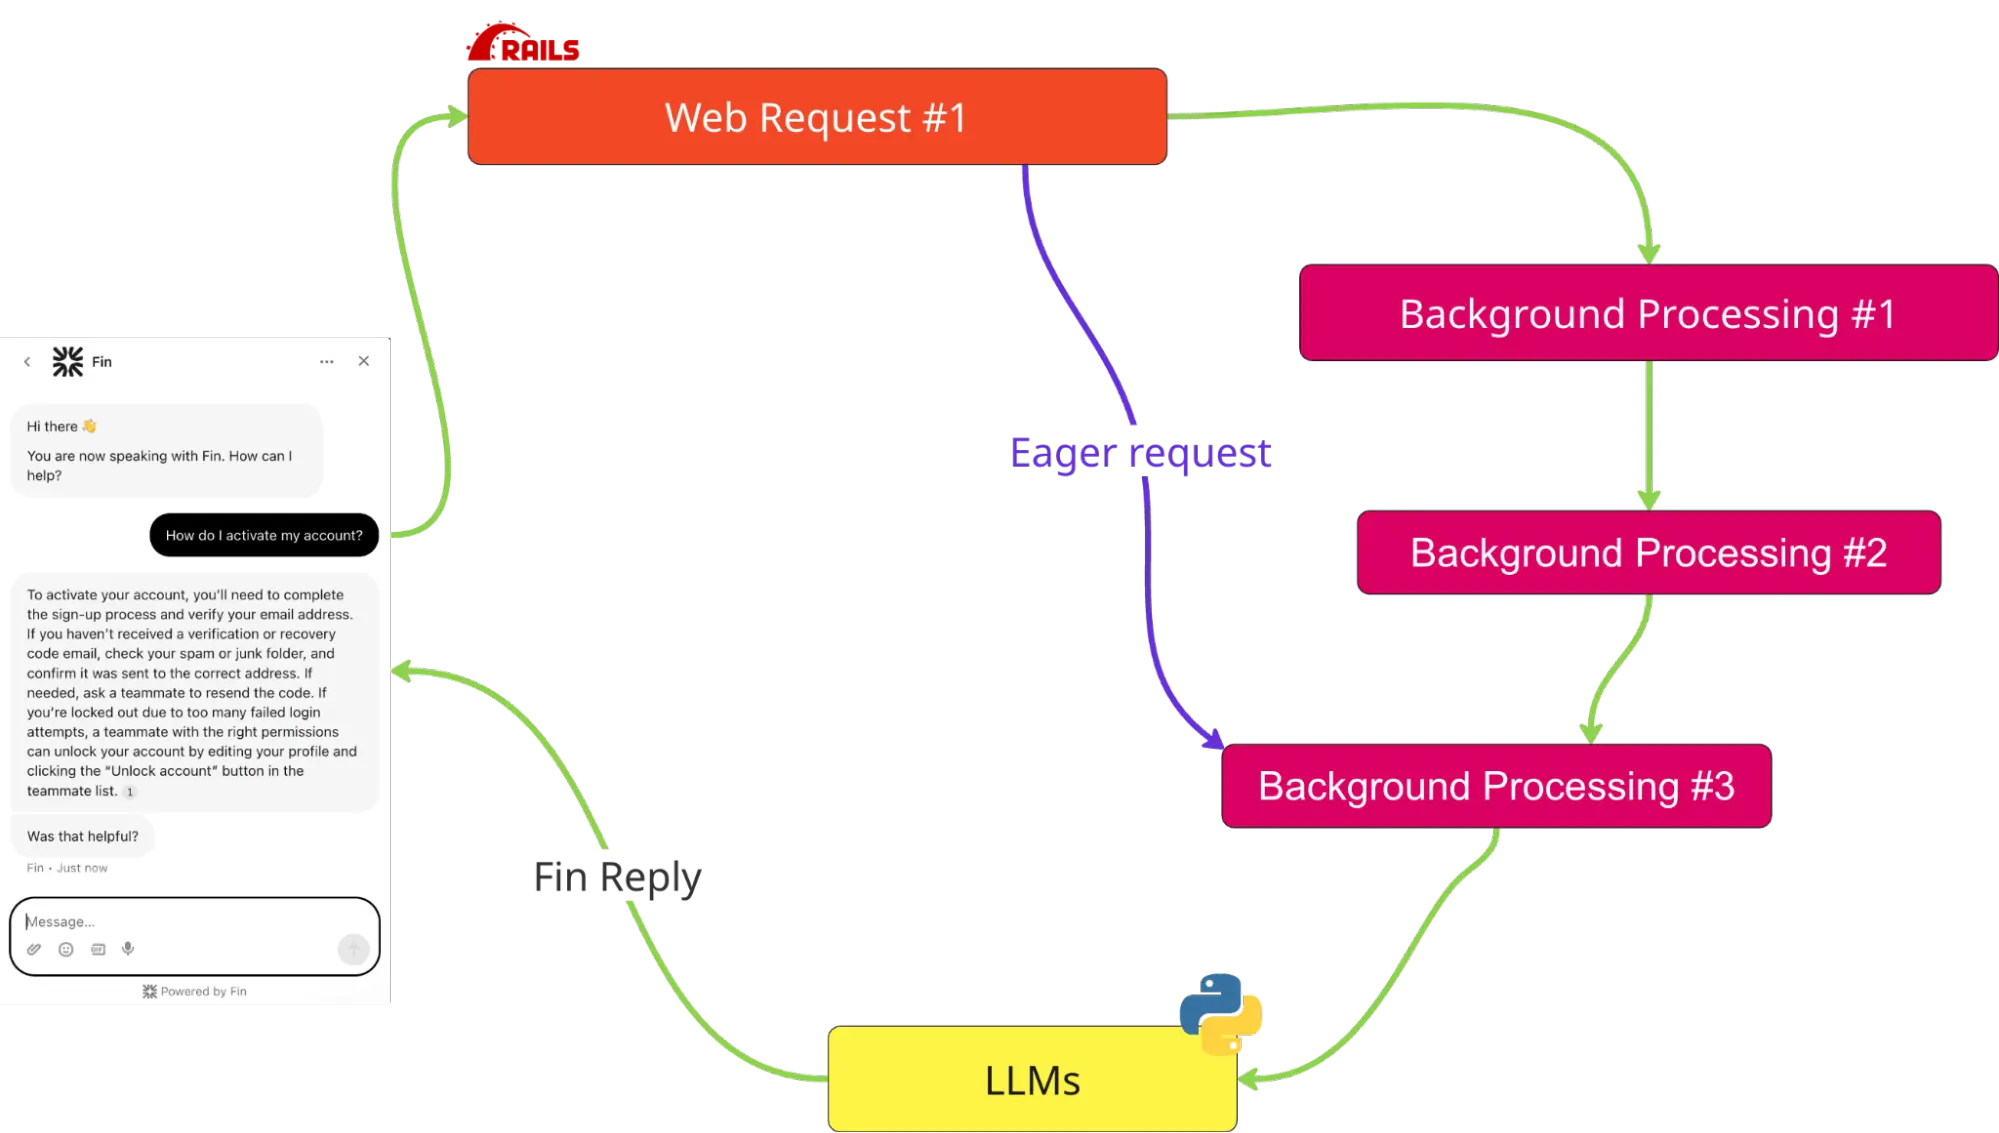
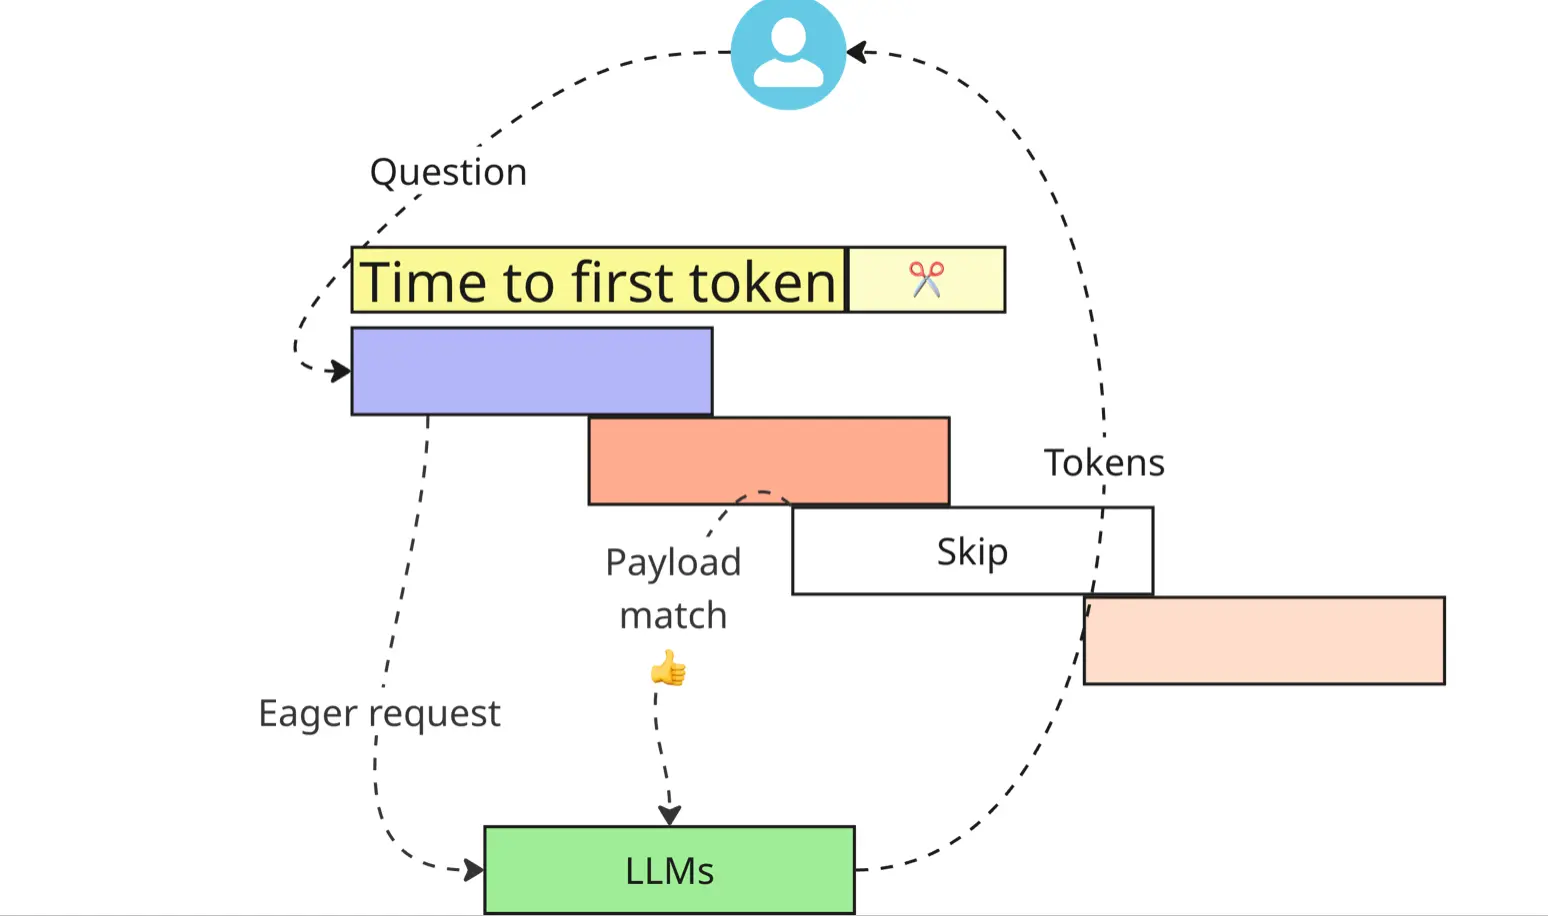
Let’s take a look at one of the most impactful optimizations we’ve implemented: eager requests.
Unsurprisingly, the most time-consuming part of Fin’s interactions is the LLM-based agentic workflow making calls to multiple models. But even before interactions reach that stage, there’s a bunch of work that has to be done, like storing end user messages in the database, progressing through customer-configured workflows, figuring out if Fin has to be engaged in this given conversation, etc.
What if we skipped that part and eagerly invoked LLM-based processing? There’s a good chance “normal” request flows will alter the payload affecting the prompts. But if it doesn’t, by the time we get to the AI-based part of the interaction, we might already have an LLM-generated answer at hand! Turns out, in the majority of cases, the payload stays intact and we are able to stream the response back to the end user quicker. This optimization alone helped us to shave two seconds off the median time to first token.
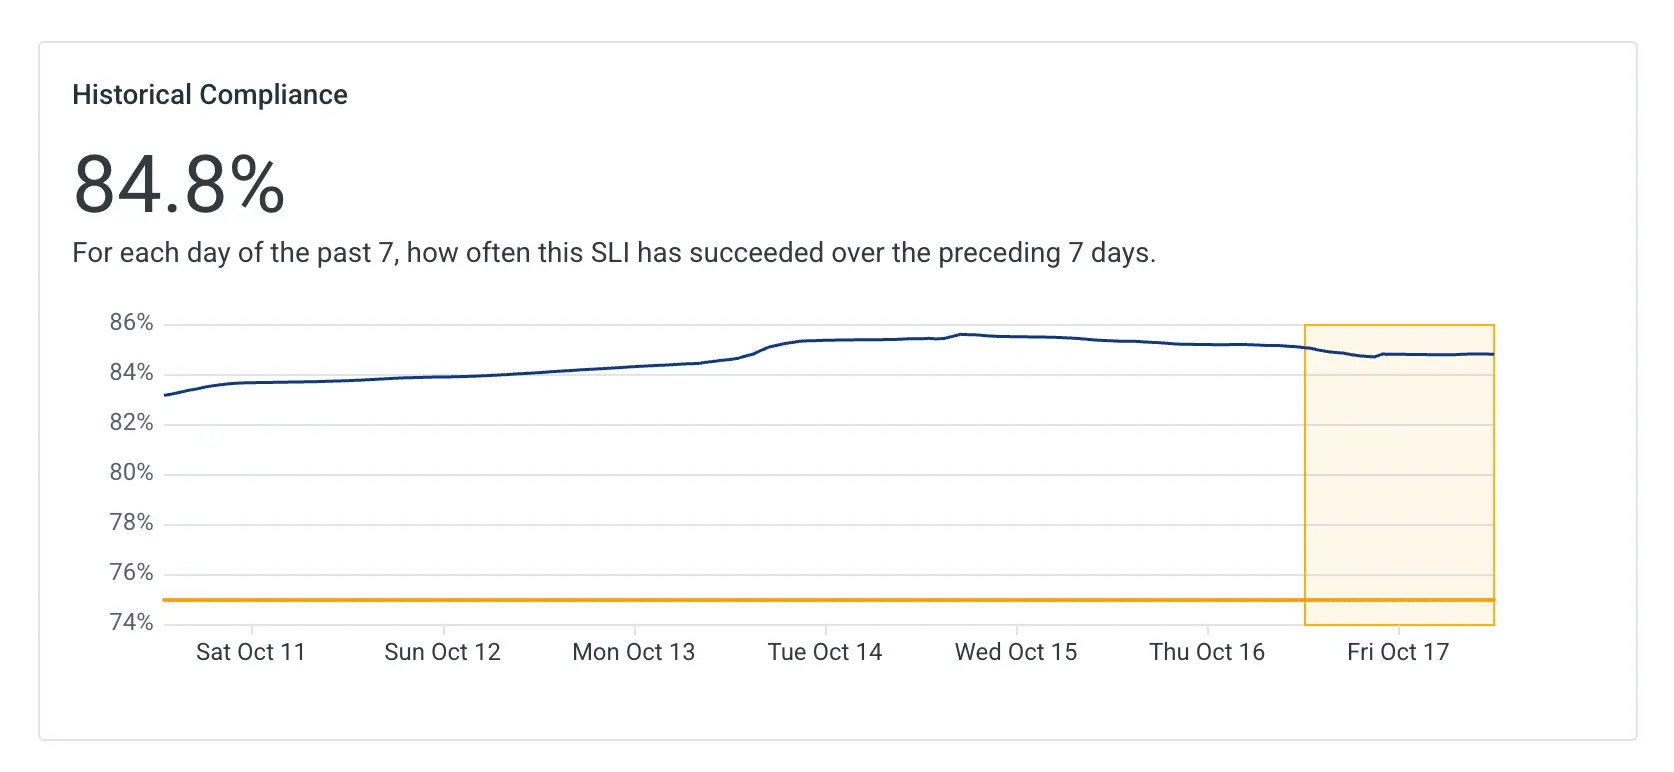
But making Fin faster is only part of the job. The real challenge is to protect the speed gains over time, especially given the rate of changes shipped on a daily basis. We knew that things would degrade again and we needed a way to proactively manage slowdowns. Given the unpredictable availability of the models (provider outages, daily seasonality, lack of capacity, etc.), a simple threshold-based alarm would be too noisy. We decided to adopt an event-based SLO that tracks the percentage of interactions faster than a newly-established baseline. Focusing on our long-term trends of SLO compliance helped us stay focused on meaningful degradations and not be distracted by intermittent short-lived spikes.
Finance enters the chat
At this point, the story could have come to a happy end. We made our customers happy by improving Fin’s latency and our engineers had a signal they could trust to surface real impact. That customer-centric signal was connected to the low-level data they could use to immediately investigate any degradation detected by the breach of the SLO.
However, there was still one problem to be solved with our eager request optimization. When a “normal” request confirms a payload match, we stream the reply prepared in advance by the “eager request” flow. But what happens if Fin was never engaged in the processing of a given end user message in the first place? We allow our customers to configure sophisticated multi-step workflows where Fin is one of many steps. But sometimes, customers want to route a given conversation straight to a human based on certain conditions (e.g., sensitive topic around payments). In this case, the normal flow halts and all the LLM requests emitted as part of eager request flow are wasted:

Since there was no Fin interaction in processing that end user message, no latency metrics were emitted. As a result, this eager request malfunction was flying under the radar. Engineering learned of this only after Finance did a quarterly review detecting a decrease in Fin’s gross margins. We were so focused on Fin’s latency that we lost touch with our own business by incurring this extra operational cost.
Luckily, thanks to the great tracing we already had, we were able to identify and fix the issue, quickly surfacing all cases where there was no need to trigger eager requests. To validate our fixes, we used the same query that Finance was using to quantify the extra LLM cost:
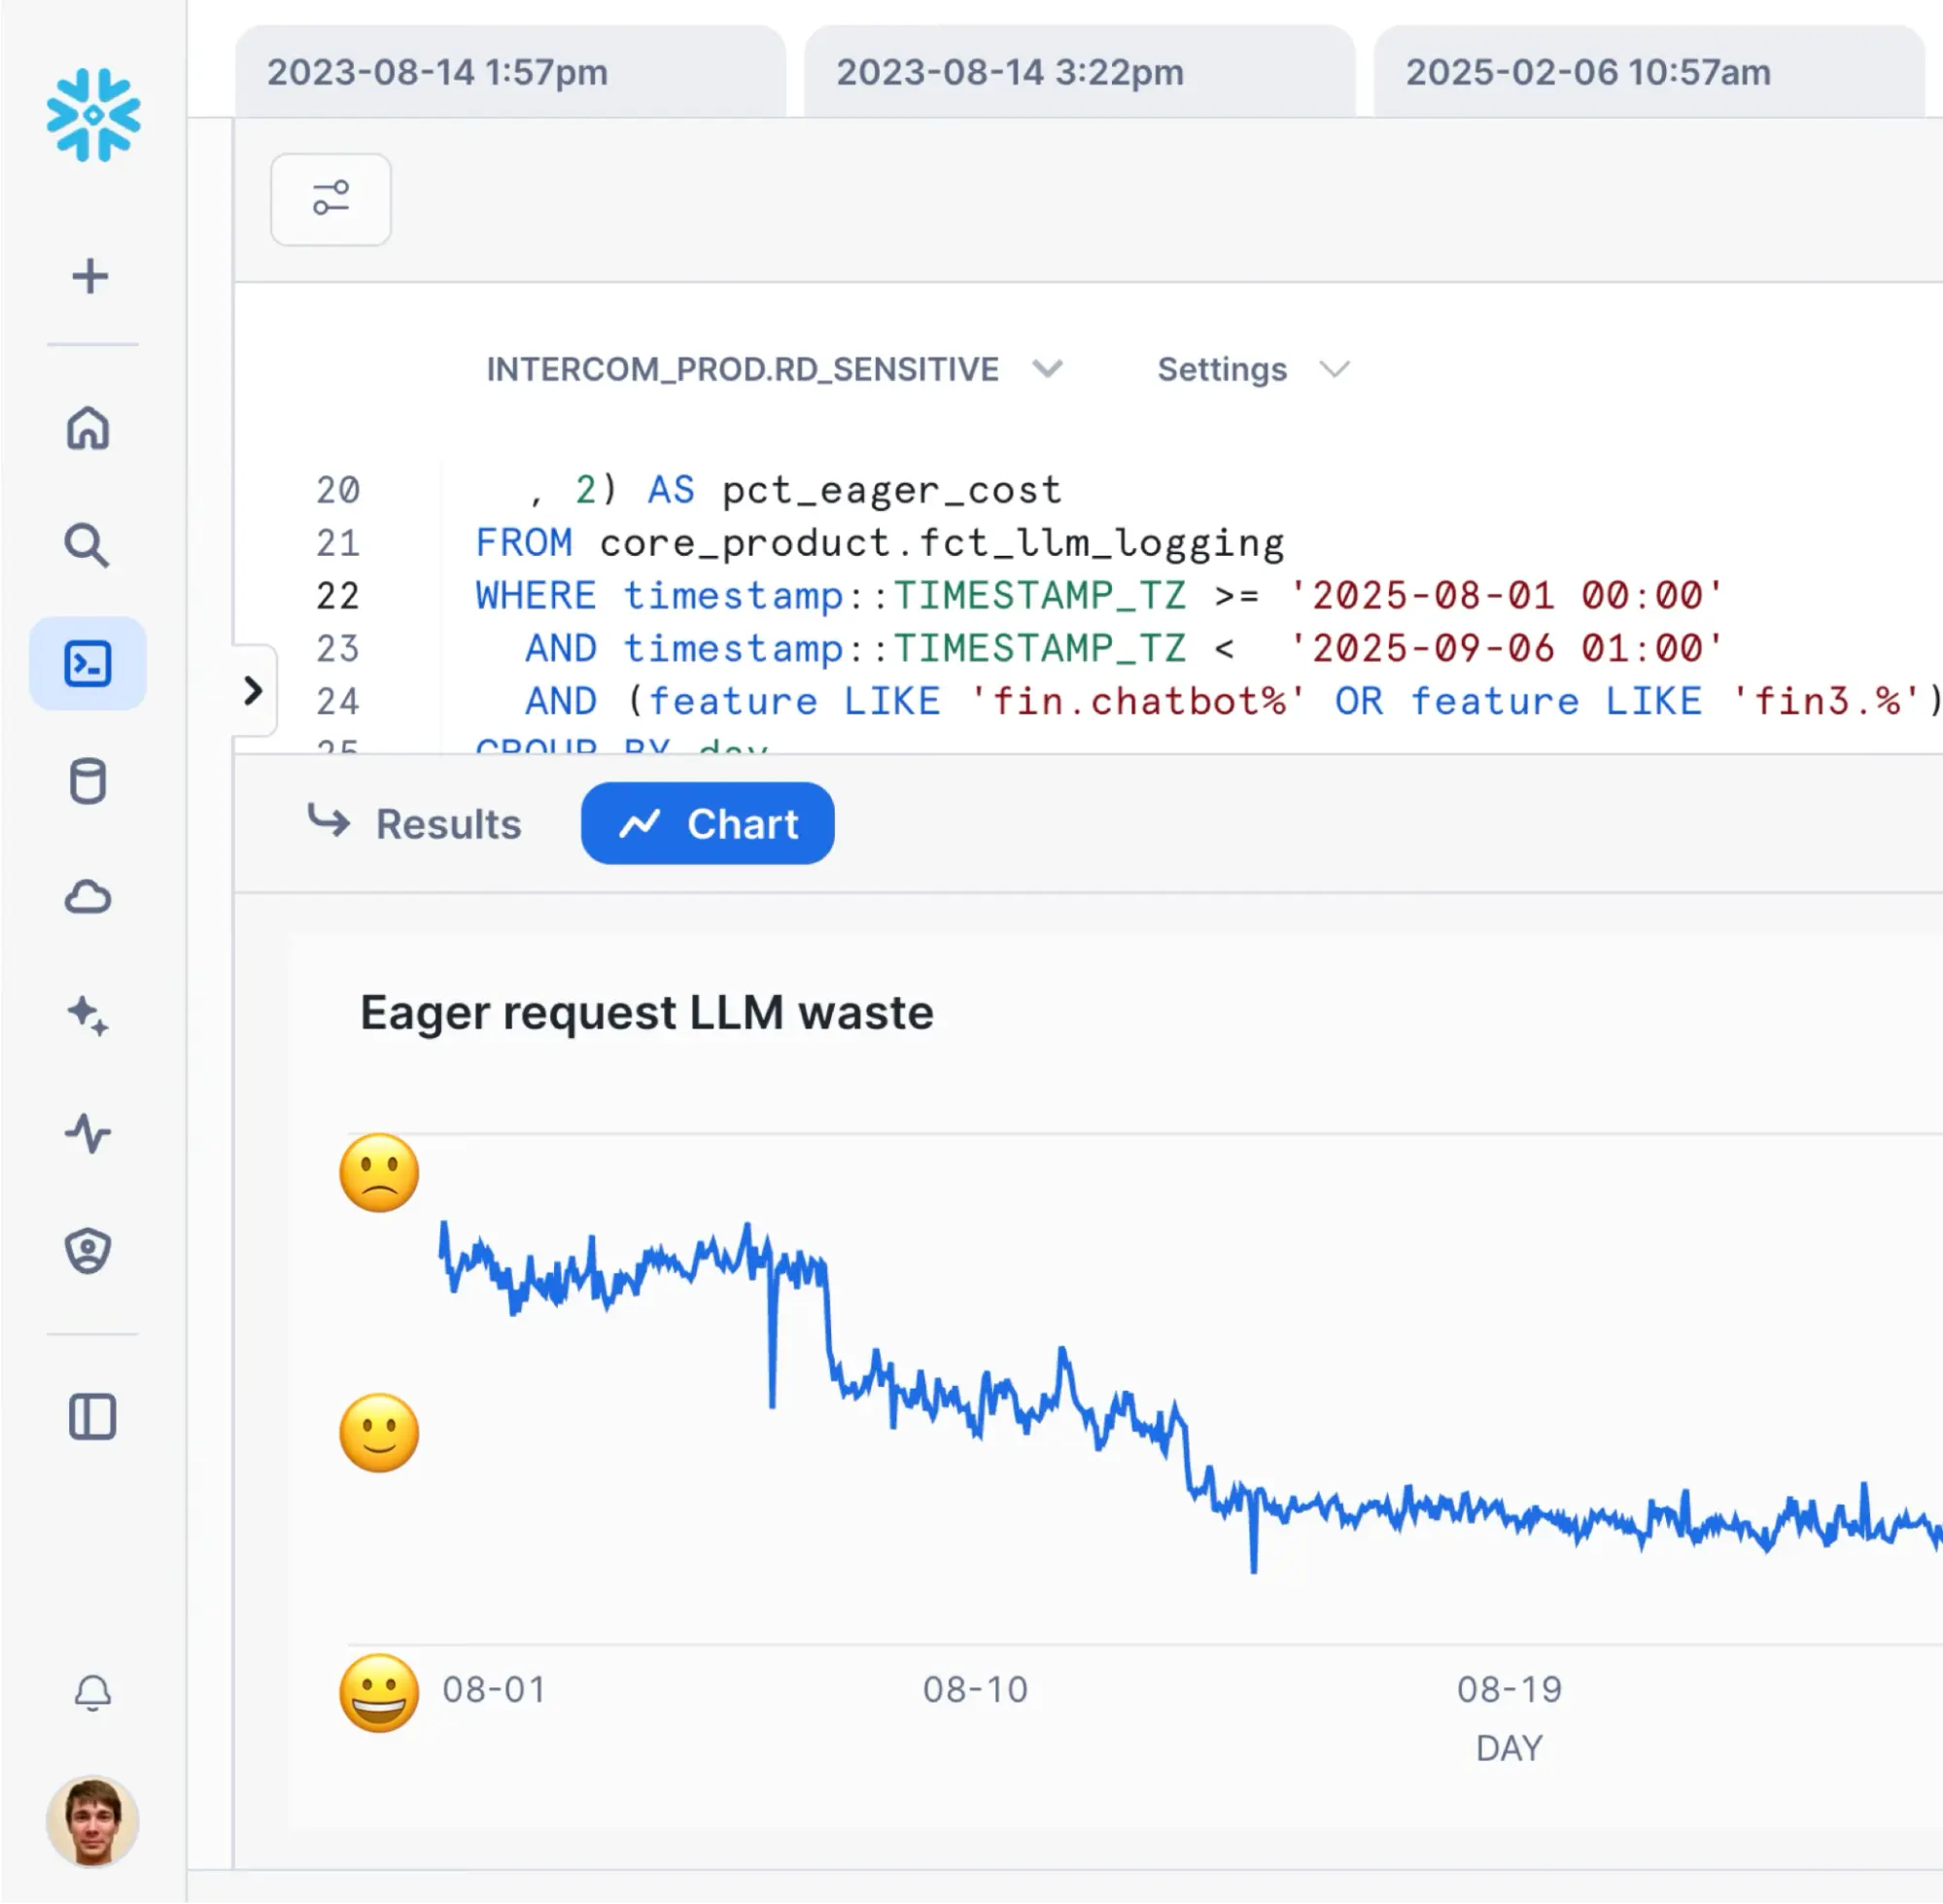
We were happy to observe the LLM waste % going down, confirming our fix. But we also wanted to stay on top of this signal.
The problem with the query above is that it takes minutes to run. More importantly, the data in the warehouse is updated on a daily basis and takes hours to refresh. And while this is okay from Finance’s perspective (who operates on a quarterly basis), it isn’t good enough for the engineers.
Engineers need real-time feedback on their actions. That’s an important precondition to being able to safely ship hundreds of changes per day. So, we added Fin’s cost per interaction to the same distributed traces we already had.
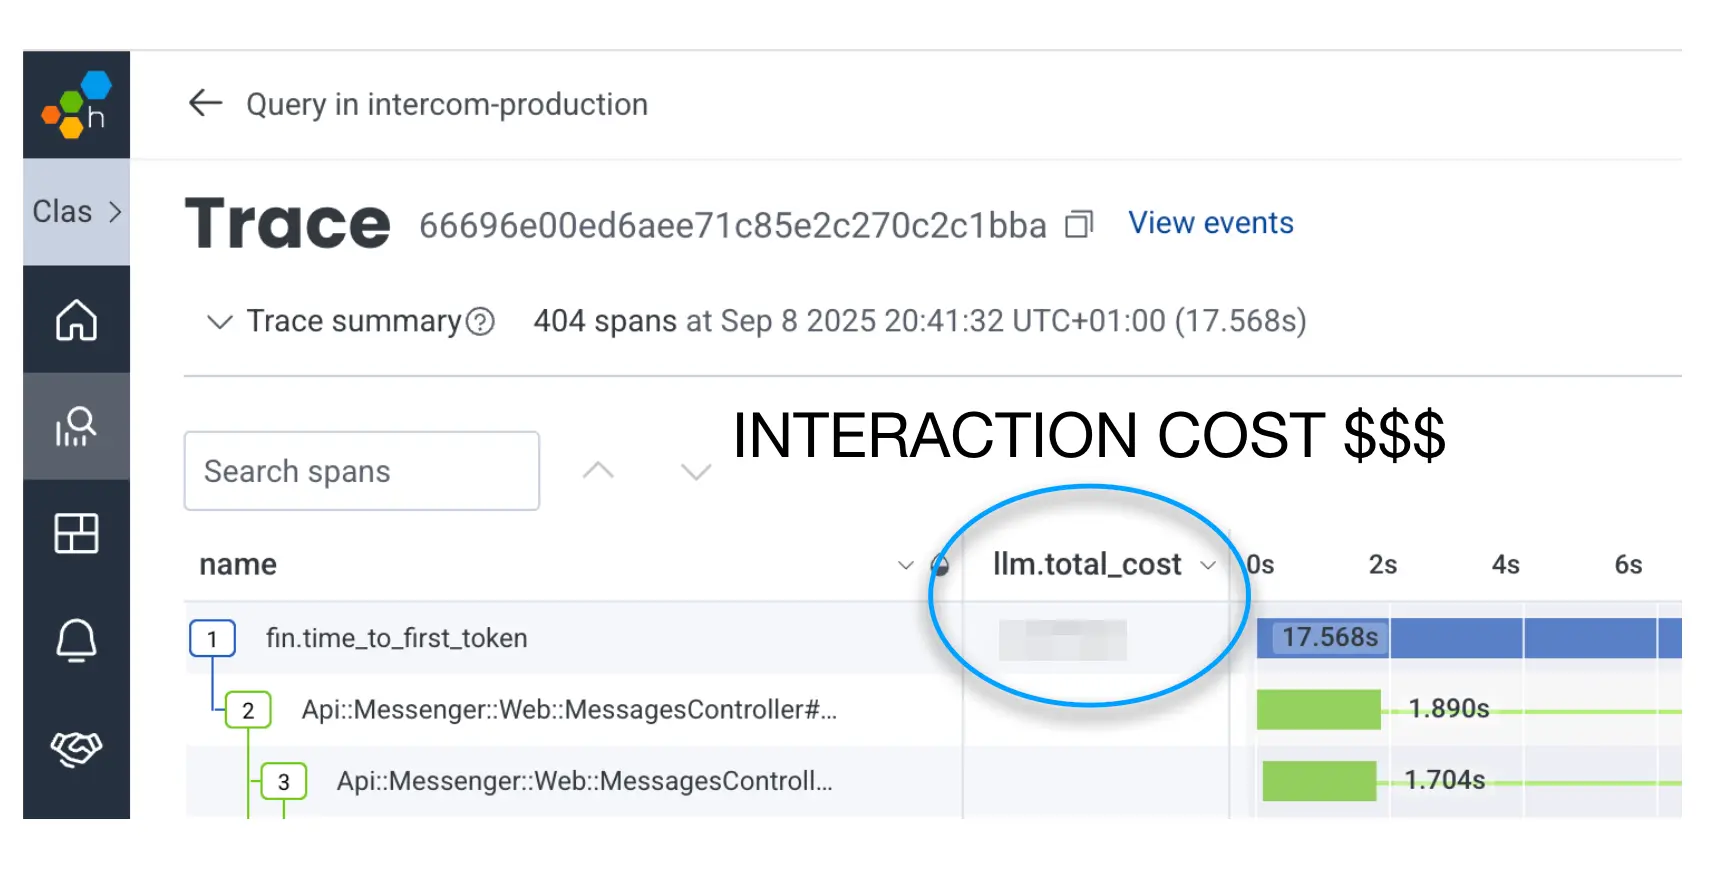
Of course, we put an SLO on it to make sure we were notified of degradations to Fin’s cost.
Empathy
Our customers were happy, as we were able to empathize with them and experience Fin’s speed in exactly the same way they did. We also built empathy with the business by surfacing a business-centric signal. Fin’s cost per interaction that strongly correlates with cost per resolution, which we ultimately charge our customers for. Crucially, both customer and business-centric signals are attached to highly-detailed telemetry that enables engineers to investigate and fix issues, making them happy too.
One might think our experience and learnings are specific to us, but in fact, it’s easy to generalize this approach.
You might be familiar with the Rasmussen safety model, which explains how sociotechnical systems can drift towards failure. The model argues that every system operates within three boundaries, forming the Rasmussen Triangle:
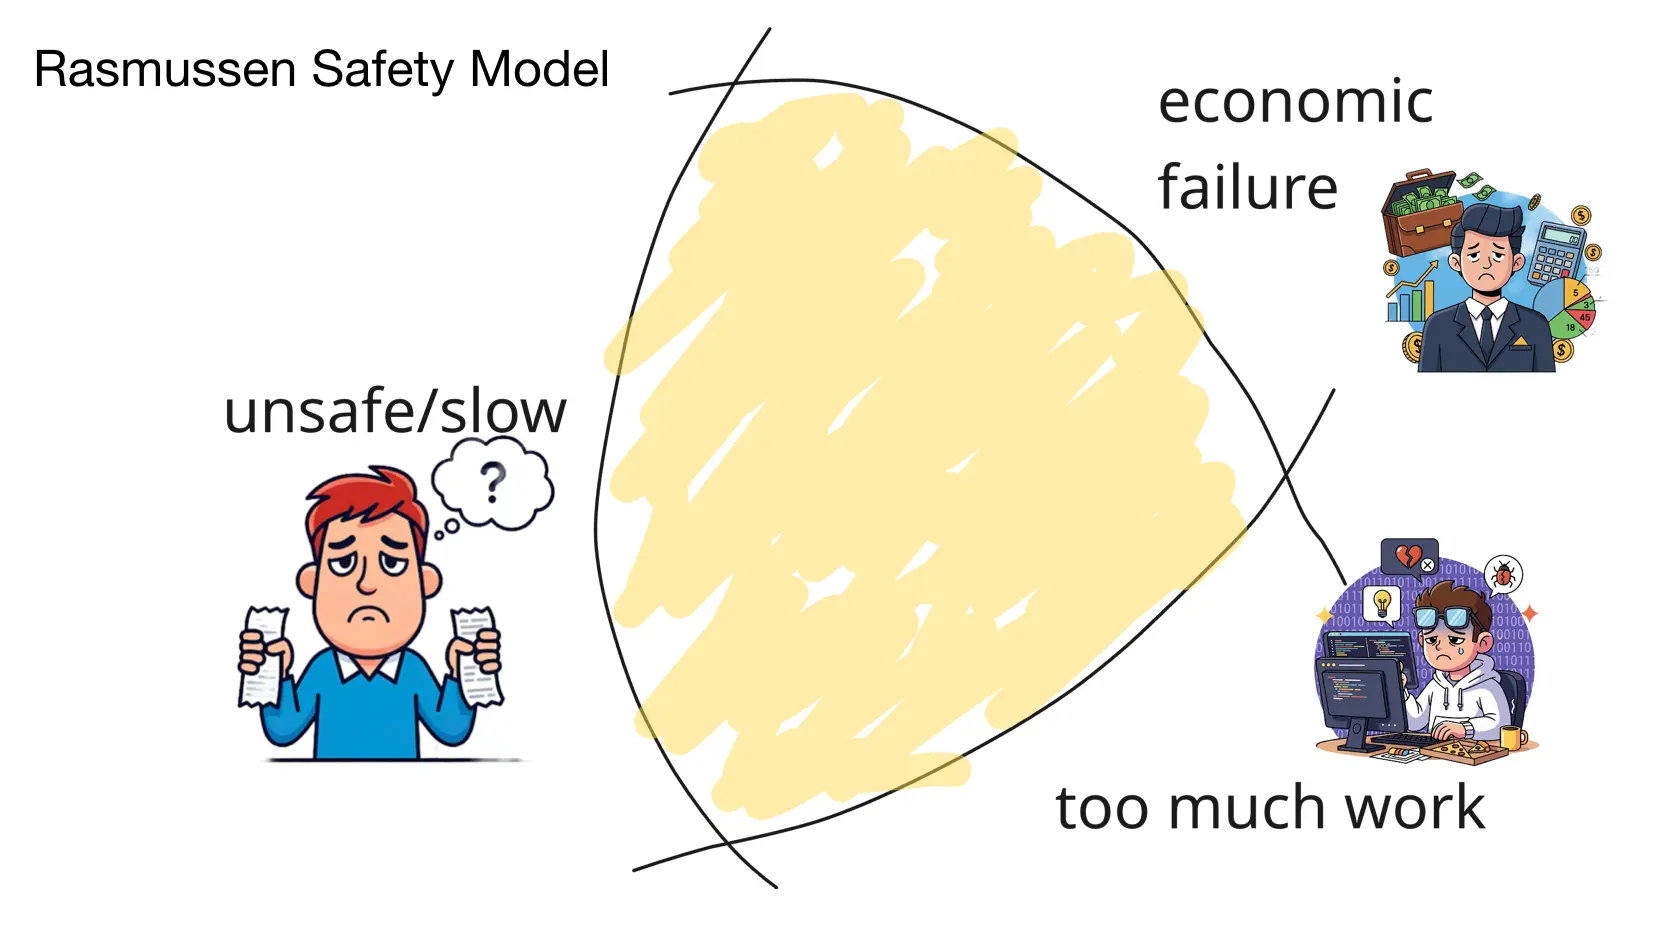
- On one side, there’s a boundary of acceptable performance. Cross that boundary and the performance/availability of your system is affected, making your customers sad.
- On the other side, there’s a boundary of economic failure. Cross that boundary and your business profitability is at risk.
- And finally, there’s a boundary of unacceptable workload. Cross that boundary and you risk putting too much pressure on your engineers.
For a regular operator, those boundaries are elusive and rarely understood. But they do exist! Your customers will complain when things get too slow. Your finance team knows exactly where the economical failure boundary is; they already promised that gross margin to your investors. And finally, unless you equip your engineering team well, they might crumble under pressure by not being able to increase performance and reduce cost.
That’s where observability takes a central role. The art of observability is to surface those safety boundaries to the operators and create a real-time feedback loop that empowers them to take risks and know exactly where they are in the Rasmussen triangle. Practically speaking, the art of observability is to create a dataset that combines a customer-centric signal with a business-centric one. Those signals must be updated real-time and connected to highly-detailed, low-level tracing telemetry that enables operators and engineers to proactively monitor and fix issues as they arise.
This is the last mile of observability, and arguably, the hardest one. Many teams focus too much on instrumentation, telemetry pipelines, and vendor management, thus overlooking the last mile. It’s easy to get bogged down with implementation details and miss the forest for the trees. That’s where observability becomes just another cost center where the only conversation you can have with your finance team is about the cost of your logging cluster.
Instead, if you walk the last mile, observability could be strongly associated with your customers’ happiness and business success. The good news is that to walk the last mile of observability, the only thing required is empathy. You have to deeply empathize with your customers, business, and engineers. Understand their needs. Feel their pain the same way they do.
As ironic as it sounds, in the age of AI, empathy is all you really need.
Want to learn more?
Talk to our team about how we're helping organizations build the operational foundation for AI development success.