Bringing the Most Advanced Sampling to the OpenTelemetry Collector
Honeycomb is donating its adaptive tail sampling processor, built on years of Refinery experience, to the OpenTelemetry Collector. See how adaptive sampling, trace fingerprinting, and sample rate attribution work, and how to try it today with the Honeycomb Collector Distribution.

By: Mike Goldsmith

Honeycomb Users Are Living in the Future, Part 1: Sampling
Read More
Sampling is a core skill that everyone who runs an observability pipeline at scale will learn. There are lots of tradeoffs within the various decisions you'll make from reducing bandwidth, CPU, and memory, to reducing costs and making the observability backend's performance better for users.
Historically, there have only been three mechanisms, each with their own tradeoffs:
- Head sampling (configured in your applications)
- Probabilistic (random) sampling (configured in your pipeline)
- Tail sampling (configured in a trace-aware routed Collector)
However, there is a secret fourth option: adaptive tail sampling—which changes those tradeoffs.
We built Refinery (our open source tail sampling proxy) long before OpenTelemetry became the standard for telemetry. It's the most advanced sampling proxy that exists and helps our customers keep the important context without blowing their budgets, even during spikes. Refinery does this by applying sampling rules that change dynamically instead of the more rigid rules you see in the current Collector's tail sampler. It also does a ton of other things like clustering, scaling, routing, etc.
The downside for us has always been that these ideas aren't mainstream. Users are stuck with rigid static rules from the Collector's tail sampler, or its probabilistic sampler. That means that there's a general sense that tail sampling is bad, rigid, and therefore risky.
All of this led us to think about how we could help the industry realize the potential of adaptive tail sampling, which brought us to the new adaptive tail sampling component we're donating to the OpenTelemetry Collector.
TL;DR: We're donating our adaptive tail sampler as a processor to OpenTelemetry! If you want to try it out before it reaches the official Collector distributions, you can use our Honeycomb Collector Distribution (see here).
Want to go deeper on sampling?
Read The Engineer's Guide to Sampling in the Age of AI
to learn how to manage data volumes
without losing the context that matters.
Tail sampling vs adaptive tail sampling
There are many similarities between the existing tail sampling component and the adaptive sampling approach.
Buffering
Both samplers "buffer" spans for a period of time to ensure that it gets as much of the trace context as possible, which allows the samplers to act on the full trace's context instead of the individual span. The adaptive tail sampler has an additional mechanism where the decision fires shortly after the root span has been received (decision_delay, two seconds by default), with a trace_timeout (30 seconds by default) as the safety net for traces that never get one. This can help with CPU and memory pressure, especially for short running requests.
Static rules
Both samplers offer static rule evaluation, like "Keep every trace with an error," "Keep traces whose root span took over 1 second," "Drop all healthcheck endpoint requests."
This also extends to running probabilistic sampling with static rules, like "Keep only 1 in 10 random requests for the homepage."
Trace fingerprinting
This allows the sampler to be aware of what makes two traces similar, therefore allowing it to ensure that you have coverage of different journeys through your system. Additionally, trace fingerprinting allows you to ensure that requests that would normally be rarely sampled (like a tenant with small volume) are represented in your output. This is a key feature of adaptive sampling.
As an example, you could identify a trace by all of:
- The set of service names that appear across the trace, and the set of response status codes that appear across the trace
- Tenant id from the root span
- The http route of the root span
If a user's request for Checkout took a different path through your system because they applied a discount code, it would be treated differently than one that didn't. In addition, every single tenant in your system would be represented in the sampled data too.
Adaptive sample rates
This is the real magic of adaptive sampling, and is tied to trace fingerprinting.
Each fingerprint's actual sample rate will vary, because you're applying a "target" you want to hit across all fingerprints—either a percentage of traffic or a throughput budget. This is where logarithmic analysis is done over the volumes of each to give us relative sample rates.
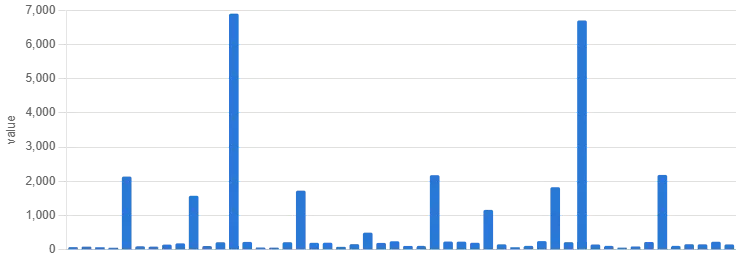
This graph shows that a few fingerprints have a lot more traffic than the others. This could be because they're for the homepage, or just that two big customers are generating more traffic than the others. If we applied a one in 10 sampling rate without fingerprinting, we'd likely miss a lot of the small traffic calls. Conversely, if we did a one in 10 sample rate for each fingerprint, we would potentially miss a lot of the nuance in the large customers.
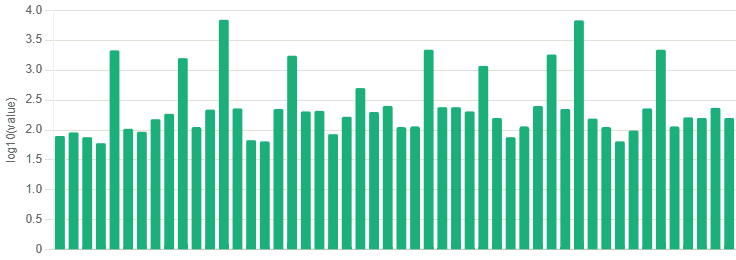
The log() function helps by normalizing the volume of each fingerprint, allowing us to have a relative value. We can use it to distribute our one in 10 sample rate over the whole distribution and make sure that we get some data from each.
Further, there are two ways to express the goal you're adapting toward:
- A percentage (
adaptive_percentage): For example, keep 10% of overall traffic. The sampler spreads that budget across fingerprints, sampling the busy ones harder and keeping more of the quiet ones. - A throughput (
adaptive_throughput): For example, keep around 1000 spans per second. The sampler works out the per-fingerprint rates that hold you to that budget, however traffic spikes.
Either way, the rates recalculate on a regular interval (15s by default, and configurable) so they adapt as your traffic increases or decreases.
The real power here is cost control. With a throughput goal, even if you get a large spike in traffic, you're not going to be outputting a raw multiple of your platform's volume. And with either goal, if your homepage receives a DDoS attack, the telemetry of your checkout endpoint won't suffer.
Sample rate attribution
Sampling is now a first class concept in OpenTelemetry, using a tracestate value (ot=th) that carries the sampling threshold, so outputting this from the processor is incredibly useful to tell your backend what a trace represents.
When we couple that with the adaptive sample rate, we empower the backend system to show extrapolated data from trace analytics with accuracy.
Try it today with the Honeycomb Collector Distribution
We're donating the adaptive tail sampling processor to the OpenTelemetry Collector, and it's working its way toward alpha upstream. In the meantime, you can run it today with the Honeycomb Collector Distribution, a drop-in replacement for the Collector contrib image that already bundles the component.
Here's a complete trace pipeline. It receives OTLP, applies two sampling rules, and exports to Honeycomb. The rules are:
- The first keeps every trace where any span has an error status code.
- The second aims to keep 10% of all combinations of service name and HTTP route, so low-traffic routes stay visible while hot routes get downsampled.
receivers:
  otlp:
    protocols:
      grpc:
      http:

processors:
  adaptive_tail_sampling:
    rules:
      # Errors are always kept, evaluated first
      - name: keep-errors
        conditions:
          - span.status.code == STATUS_CODE_ERROR
        sampler:
          type: always_sample

      # Everything else settles at ~10% per (service, route) class
      - name: default
        sampler:
          type: adaptive_percentage
          goal_percentage: 10
          fingerprint_attributes:
            - resource.attributes["service.name"]
            - span.attributes["http.route"]

  # Buffering, timeouts and cache all use sensible defaults, a minimal config is just your rules

exporters:
  otlp_http:
    endpoint: https://api.honeycomb.io
    headers:
      x-honeycomb-team: ${env:HONEYCOMB_API_KEY}

service:
  pipelines:
    traces:
      receivers: [otlp]
      processors: [adaptive_tail_sampling]
exporters: [otlp_http]To run it on Kubernetes, use the OpenTelemetry Collector Helm chart and point the image at the Honeycomb distribution:
# values.yaml
image:
  repository: honeycombio/honeycomb-opentelemetry-collector
  tag: latest # pin to a release from https://github.com/honeycombio/honeycomb-collector-distro/releases
mode: deployment
config:
# the collector config from aboveSave that as values.yaml with the collector config from above under config. Then, add the chart repo and install:
helm repo add open-telemetry https://open-telemetry.github.io/opentelemetry-helm-charts
helm repo update

helm install adaptive-sampler \
  open-telemetry/opentelemetry-collector \
  -f values.yaml \
  --set-string extraEnvs[0].name=HONEYCOMB_API_KEY \
--set-string extraEnvs[0].value=$HONEYCOMB_API_KEYPrefer to try it locally first? Pull the image straight from the distro and pass the same config:
docker run -p 4317-4318:4317-4318 \
  -e HONEYCOMB_API_KEY=$HONEYCOMB_API_KEY \
  -v $(pwd)/config.yaml:/config.yaml \
honeycombio/honeycomb-opentelemetry-collector:latestDrop in your config and start playing with the sample rates.
Happy sampling!