New Honeycomb Integrations Let You Bubble Up Lurking AWS Issues
Today, we’re announcing the expansion of Honeycomb integrations with various AWS services. This update now covers a much wider swath of AWS services, makes it easier than ever to integrate your AWS stack with Honeycomb, and with our new BubbleUp enhancements, you’ll be identifying and debugging hidden issues in your AWS stack faster than ever.

By: George Miranda

Today, we’re announcing the expansion of Honeycomb integrations with various AWS services. This update now covers a much wider swath of AWS services, makes it easier to integrate your AWS stack with Honeycomb, and with our new BubbleUp enhancements, you’ll be identifying and debugging hidden issues in your AWS stack faster than ever.
AWS services now integrated with Honeycomb
Previously, Honeycomb provided custom integrations to retrieve data from a limited number of AWS services that reflected our customers’ most common needs. But with the fast pace of innovation at AWS, the list of services you might use in your production stack has ballooned far beyond that initial handful—as have the ways in which AWS data can be streamed to other destinations.
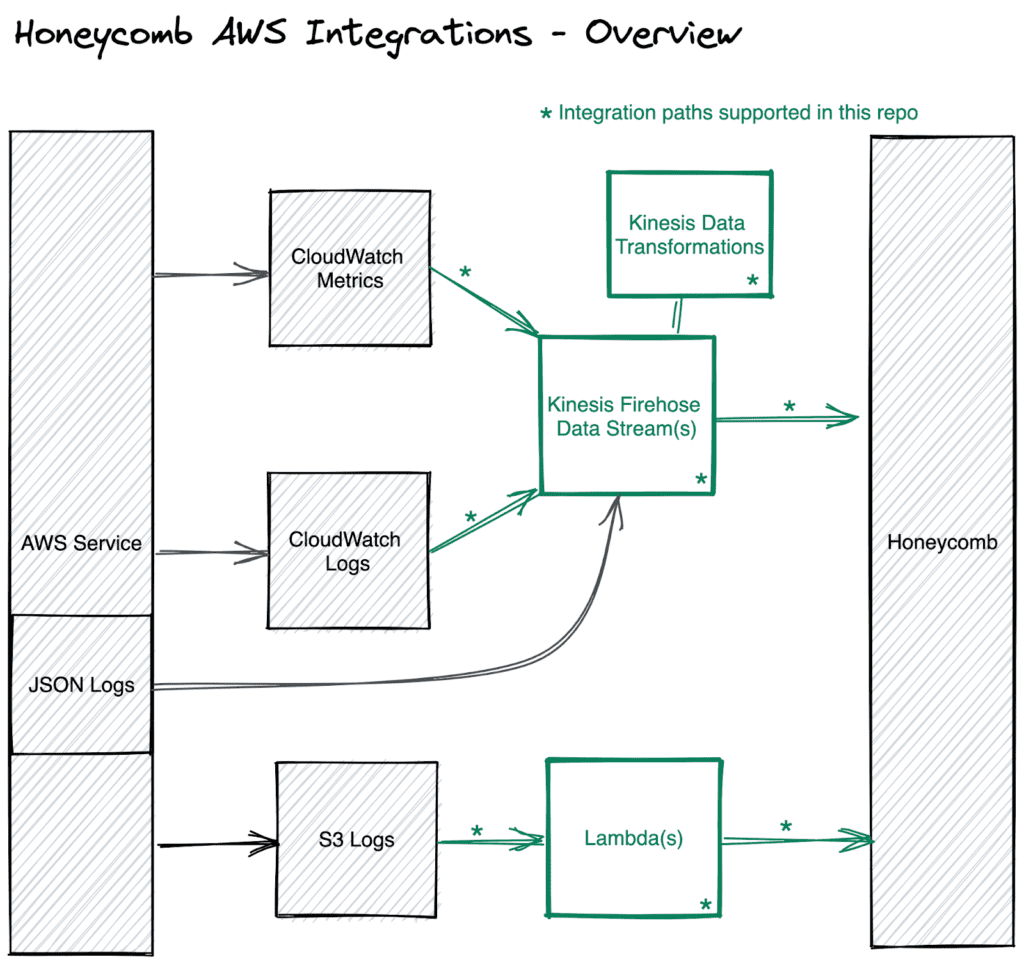
Starting today, you can now send logs to Honeycomb from any AWS service that publishes logs to CloudWatch Logs, as well as from select services that publish logs to Amazon S3. As a Honeycomb Pro or Enterprise user, you can also send metrics to Honeycomb from any AWS service that publishes metrics to CloudWatch Metrics. These integrations use a combination of serverless technologies, including AWS Kinesis Data Firehose and AWS Lambda, so that you don’t have to run extra infrastructure or agents.
These changes introduce support for substantially more AWS services, while introducing more efficient and less expensive mechanisms for reliably streaming that data to Honeycomb.
You can find detailed information in Honeycomb docs on how our AWS integrations work.
Using these new integrations to debug issues in your AWS stack
We’ve vastly expanded Honeycomb’s ability to ingest data from Kinesis Data Firehose. Honeycomb already accepted metrics from this source. Now, Honeycomb customers can also readily send logs to Honeycomb from a wide variety of AWS services.
Sending structured logs to Honeycomb allows you to quickly visualize and analyze events in your applications and infrastructure. That means that many of Honeycomb’s analysis tools, including BubbleUp, are available to help you quickly identify and troubleshoot anomalies in application performance. When investigating anomalies, BubbleUp is useful in automatically surfacing the causal attributes behind them. In other words, it’s never been easier to debug what’s happening within your AWS services.
As an example, check out the demo video below. In the video, Matt Morris shows you how to use Honeycomb to view trends in your ALB logs. First, Matt uses a simple query to retrieve all ALB log events and group them by their `elb_status_code`. From there, he selects all events with a 404 (“not found”) status code and asks BubbleUp to automatically identify what’s different about events returning a 404 status code vs. the ones that aren’t.
In that example, BubbleUp shows that the 404 errors are from requests to one particular S3 object with blank targets set. Almost instantly, Honeycomb is able to analyze billions of rows of log entries across all of their dimensions to surface causal attributes, giving you fast answers when you’re debugging even the most elusive issues.
That’s just one example of the AWS service issues you can now quickly debug with Honeycomb. But you can use that same approach to just as easily group by any log field you’re interested in from any of the AWS service integrations that send structured logs to Honeycomb, allowing you to quickly discover the source of any anomalous behavior.
Why are your ELB requests all failing? Which API request is being made most often by an account ID you’re investigating? Why are your RDS queries underperforming? How many cache misses are happening in CloudFront? Are there specific IPs trying to access one of your S3 buckets? There’s no limit to the types of issues you’ll be able to quickly debug when analyzing structured logs sent from AWS services to Honeycomb.
One-click integration setup
Additionally, we’ve simplified the setup necessary to integrate your AWS services with Honeycomb. Starting today, we’re providing modular “one-click” integration setups that utilize either AWS CloudFormation or Hashicorp’s Terraform to send your data to Honeycomb.
As an end user, you’re responsible for enabling your AWS services to emit metrics and logs to either AWS CloudWatch or Amazon S3. From there, the new Terraform and CloudFormation modules will set up the necessary mechanisms to send your data to Honeycomb based on the service names and CloudWatch groups you specify.
We’ve made multiple Infrastructure as Code options available to best suit your team’s needs. CloudFormation provides a one-click install experience that many AWS users will find convenient in order to get started quickly. Terraform requires a bit more setup, but may better fit your team’s needs for ongoing infrastructure management. Regardless of which methods your team has adopted, you’ll find that either approach has functionally equivalent features.
You can find detailed information on how to set up AWS integrations in our docs.
With so many AWS services supported, which ones should send data to Honeycomb?
This question is worth considering before simply enabling all AWS data to send across the board, since it impacts both your AWS costs and Honeycomb event volume.
The primary use case for Honeycomb is debugging application performance issues in the code you write yourself.Honeycomb is built to help you ensure your code delivers world-class customer experiences. As such, we highly recommend instrumenting your code to emit distributed traces (we’re big fans of using OpenTelemetry).
When it comes to AWS services that emit logs and metrics, the most common use case for our customers is understanding how the underlying AWS infrastructure that supports their code is performing. As a result, many of our customers find the most value in sending logs and metrics from AWS services that are in the critical path for supporting their own services. We recommend starting with those AWS services.
While Honeycomb can now ingest logs and metrics from any service that sends that data to CloudWatch, some of the supported services may operate well beyond the bounds of business-critical application performance. That said, you might still find analyzing some of that data useful with Honeycomb—but your mileage may vary.
We should also note that many AWS services natively generate unstructured logs that are then forwarded to CloudWatch. Although CloudWatch adds some structure to that data, the original raw unstructured log is passed in its entirety via one single `message` field when it’s sent to Honeycomb. Unstructured log data can be retrieved in Honeycomb, but the contents of the message won’t be parsed. That matters since features like BubbleUp won’t work with unstructured logs.
Check out our new AWS docs & Tips for working with AWS for more detailed information.
Which additional AWS services will send structured logs to Honeycomb in the future?
Today, our AWS integrations transform unstructured logs from only some AWS services into structured data before sending it to Honeycomb. Transforming logs into structured data is important because structured events are the fundamental building block necessary for observability. These AWS integrations lay the groundwork for transforming any unstructured AWS logs into structured events.
A great example of how unstructured data is structured can be found in our AWS RDS transforms. We haven’t covered all possible AWS services yet, but we’ll be adding more in the future. We’ve also made this work open-source, in case you’d like to follow along or help by contributing more transformation patterns to this effort.
Stop by the AWS integration repo to see how integration and transform logic works. You’ll find the setup logic in our CloudFormation integration and Terraform AWS repos.
Try it today
You can get started now via the CloudFormation or Terraform setup modules. Existing Honeycomb Pro and Enterprise users can send both AWS service logs and metrics to Honeycomb, while Honeycomb Free users are currently limited to only sending AWS service logs.
We’re interested to see how you use these new integrations and where you think they’re most valuable. If you have any questions about how best to use these integrations, or if you have any thoughts to share, let us know by dropping into our Pollinators Slack group. You can find us in #discuss-aws.
Want to know more?
Talk to our team to arrange a custom demo or for help finding the right plan.