Rapid debugging with distributed tracing
Connect all your context within one tracing view for faster, clearer insights.
Why you’ll love Honeycomb
See the whole picture
Display the full story of request processing, across all services in your stack.
Find issues faster
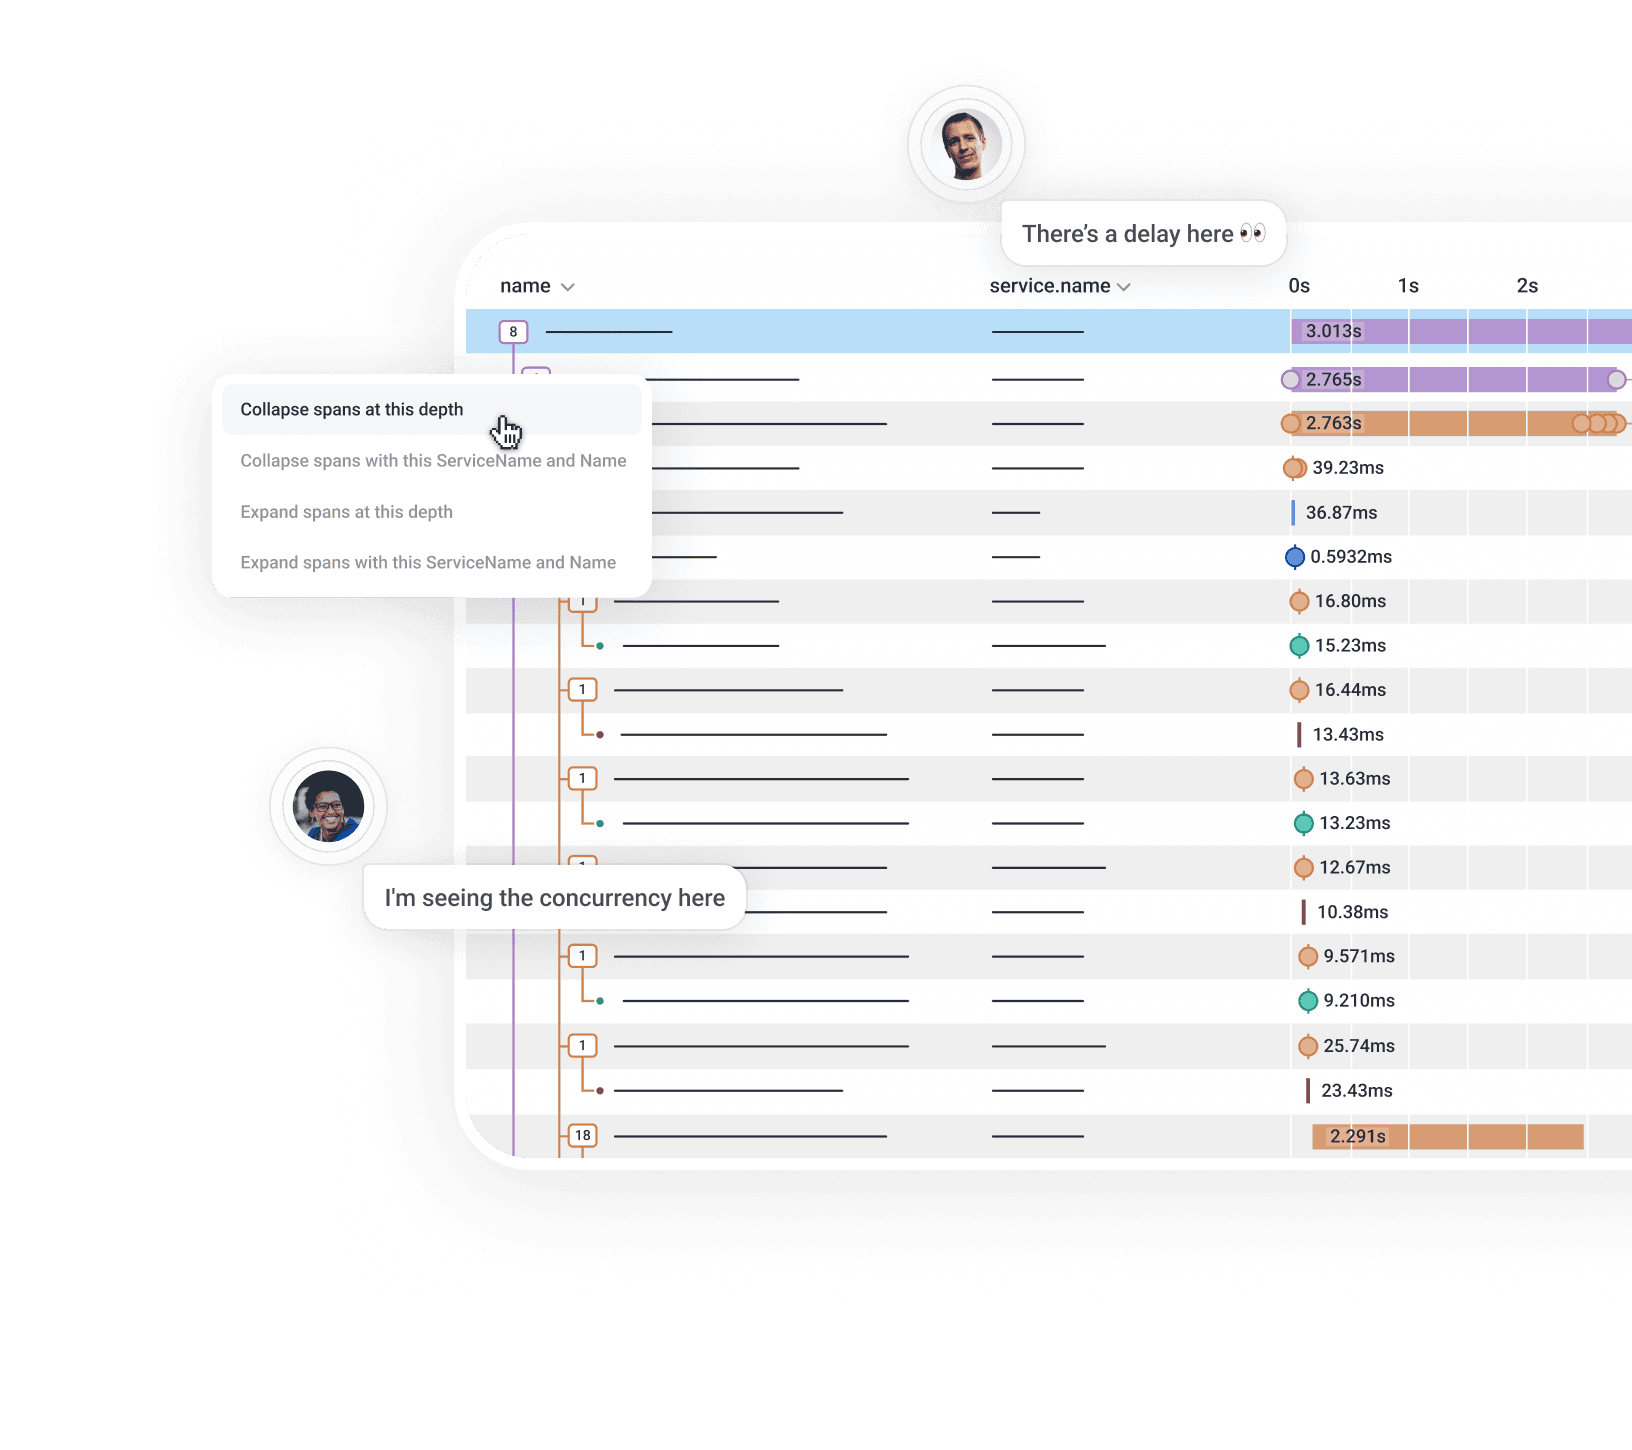
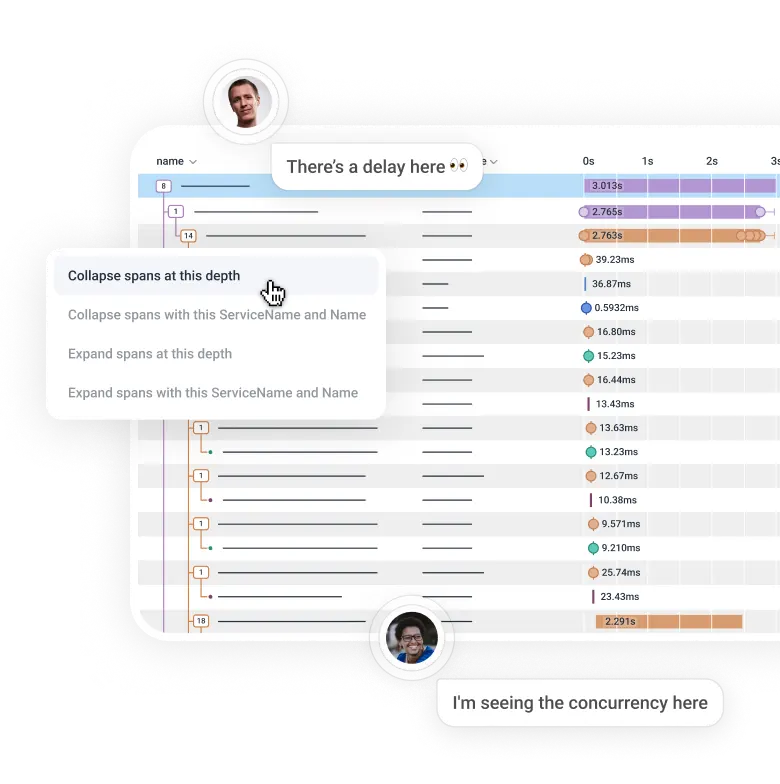
Immediately go to the source of each error. Glance at the waterfall view and know which service is causing slow response times.
Trace as a team
Every team is looking at the same trace view. See what your service did, who called it, and how each dependency responded. No more 'your logs vs. my logs.'
Trusted by innovators and enterprises worldwide


Why choose Honeycomb distributed tracing?
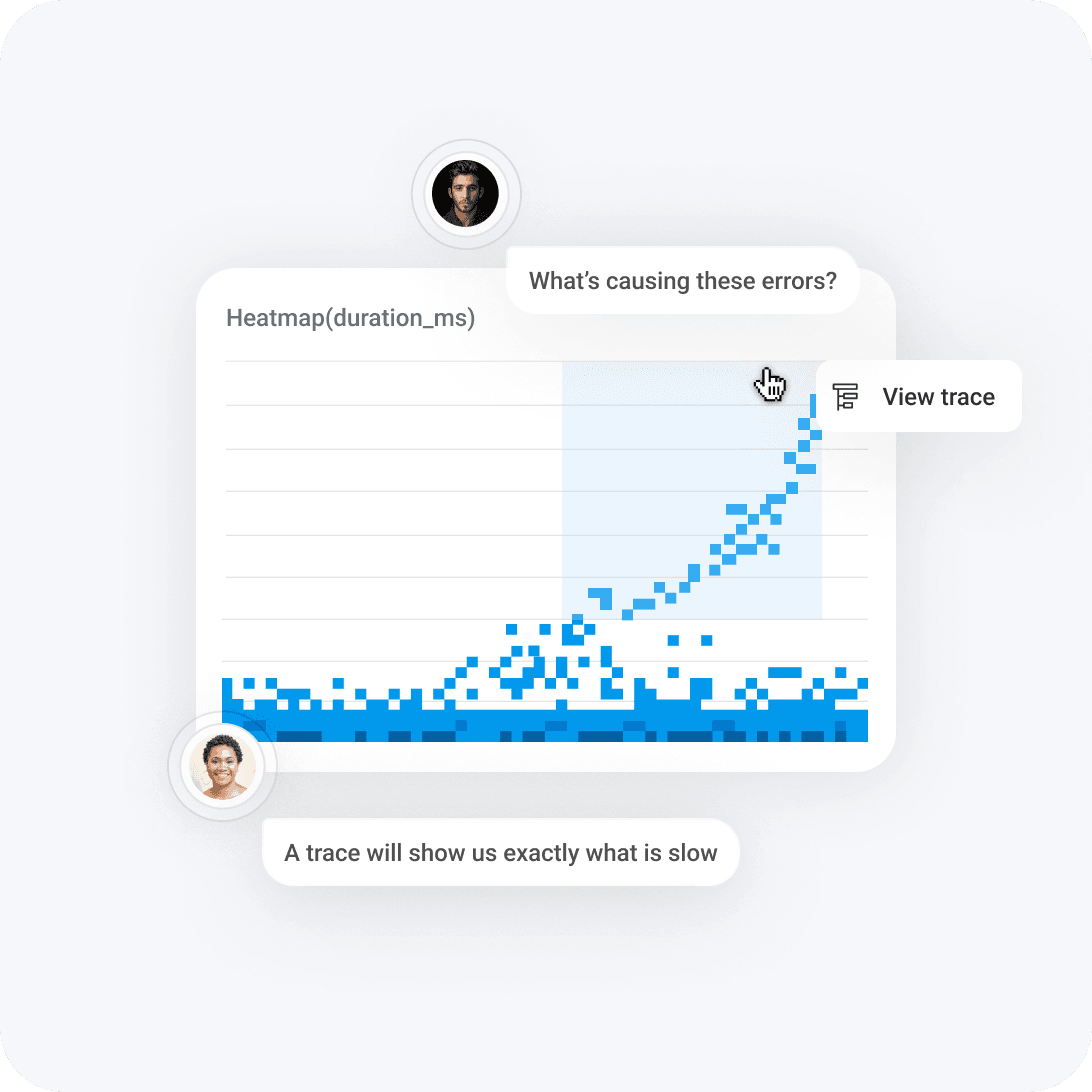
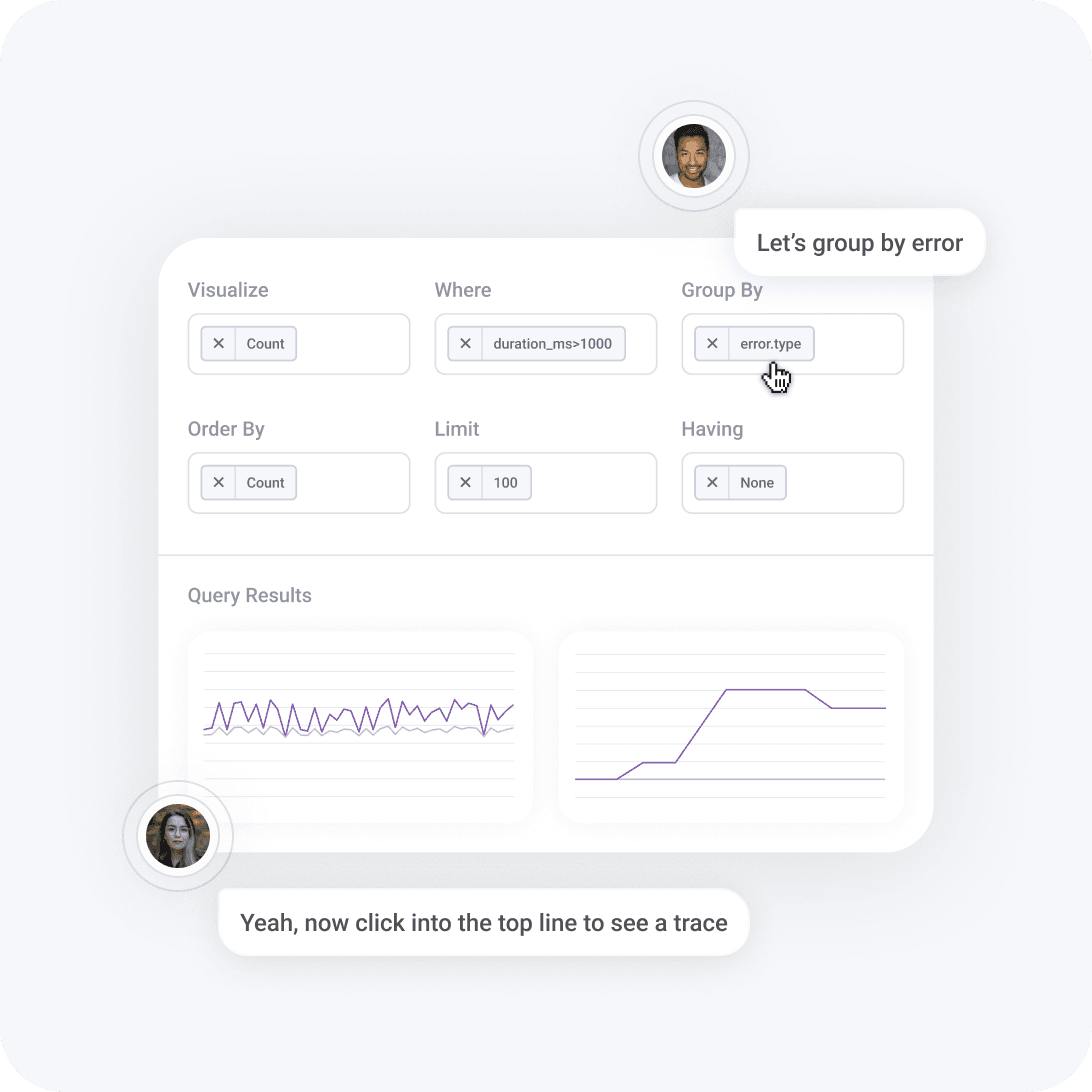
Find the trace you need
Filter by any field, or click on any spot in any graph, to get to the associated trace. Get directly to the trace that actually matters, quickly.
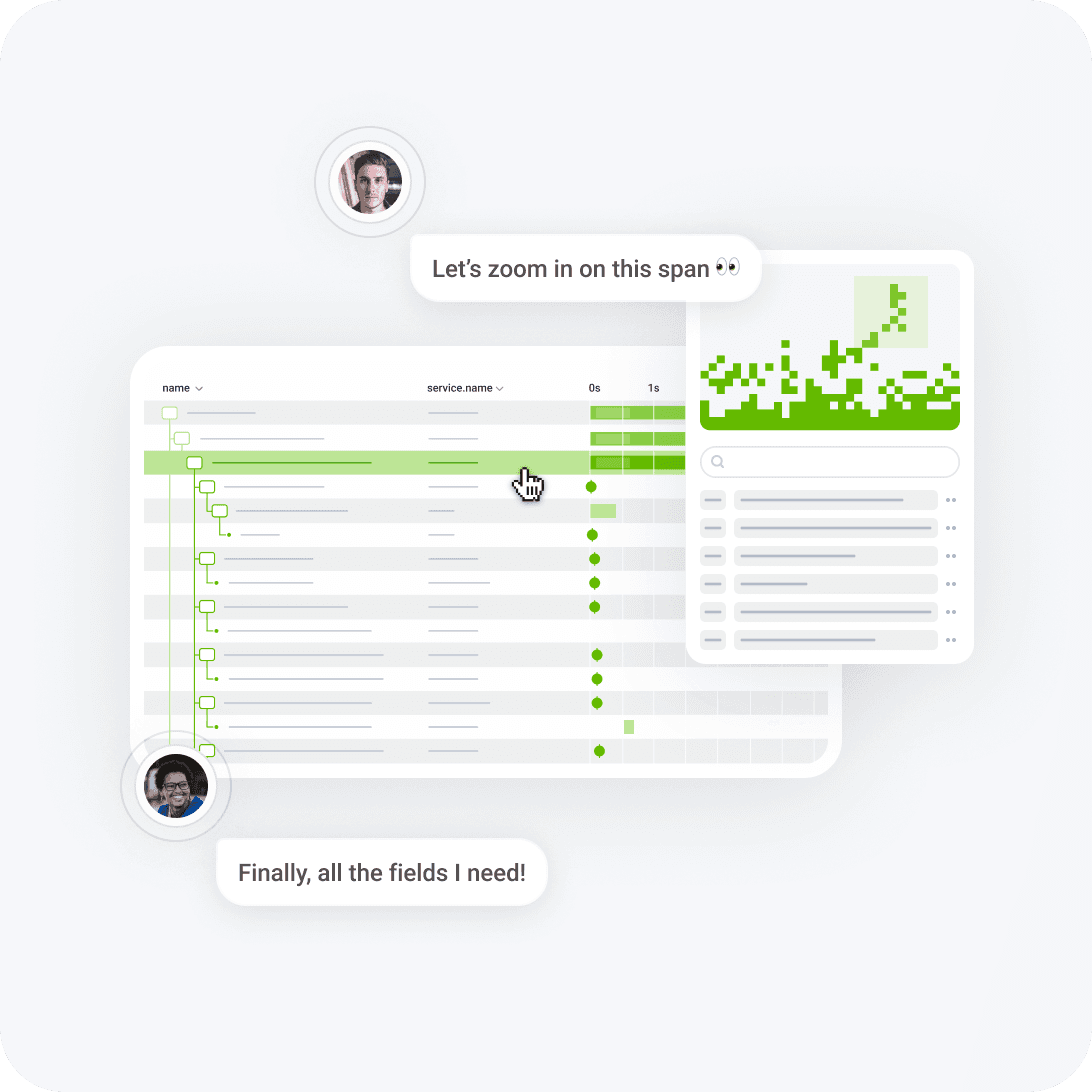
Delve into the details
Look under the hood of any trace span. See every field and every log statement, and better understand the interconnections between services. Zoom in for details, zoom out for the big picture.

Minimize single points of failure
Let your software teach you how it works. From experts to new team members, everyone can learn from what really happens in production.
Every field is a custom metric
Query and graph over anything in your trace spans. How many calls are made to this database, and which request URL triggered them? Filter on error message and region, then find the customer IDs seeing the highest latency.
OpenTelemetry expertise, built in
Honeycomb plays a vital role in the OpenTelemetry community as Maintainers, Approvers, and Ambassadors. Our contributions give us unparalleled knowledge, making us the trusted partner to guide your observability journey with confidence and precision.
5+
years of partnership with the OpenTelemetry project, since its launch
20%
of engineers at Honeycomb contribute to OpenTelemetry
5
of our engineers were top contributors to OpenTelemetry in 2024