An Ode to Events
At this point, it’s almost passé to write a blog post comparing events to the three pillars. Nobody really wants to give up their position. Regardless, I’m going to talk about how great events are and use some analogies to try to get that across. Maybe these will help folks learn to really appreciate them and to depreciate a certain understanding of the three pillars. Or maybe not.

By: Nick Travaglini

The Cost Crisis in Metrics Tooling
Learn MoreAt this point, it’s almost passé to write a blog post comparing events to the three pillars. Nobody really wants to give up their position. Regardless, I’m going to talk about how great events are and use some analogies to try to get that across.
Maybe these will help folks learn to really appreciate them and to depreciate a certain understanding of the three pillars. Or maybe not. If you’re not interested in thinking of events differently (or increasing your appreciation of them), then kindly stop reading—in the words of the great Elrond, there is nothing for you here.
Events are an all-in-one approach
I appreciate how comprehensive events are. Events are the foundational concept for the Honeycomb platform. They consist of a file (currently a JSON file) which has X number of dimensions. Those dimensions are key-value pairs.
…what?
For those who aren’t familiar with that bit of jargon, think of the key as the header of a column in a table, like a spreadsheet. The number of dimensions corresponds to the number of table columns, and then the values make up the stuff in a row. As Honeycomb receives and processes events, it fills in the rows, one after another.
They’re structured logs
What this means, practically, is that an event records the context or state of affairs of a software system at the time that it occurred. An event is the sense created from all that context. That’s why they’re sometimes referred to as “canonical logs.” So, literally, they’re a type of log. The fact that they can be described as having distinct dimensions and parts, like a key and a value, means that they’re structured. They have some sort of recurrent pattern that is distinctive enough to serve as an informative signal.
But they’re also metrics
Since events record the state of affairs about the system, that can include what are known as metrics. Metrics are numeric representations derived from and recording some physical property in a given unit of measurement. Those units are produced and revised by metrologists.
Again, to make this practical, this means that something like the amount of memory which some infrastructural component, like a Kubernetes pod, is using can be recorded in an event as its own dimension. That can exist alongside other dimensions like the ID of that pod, and is inherently correlated with the other pieces of context recorded by the event. So things like the name, or database statement, or http method, or whatever other context someone can come up with that matters to their instrumented code is auto-correlated with that metric (this is what tagging metrics in other tools does).
Throw spans in the mix
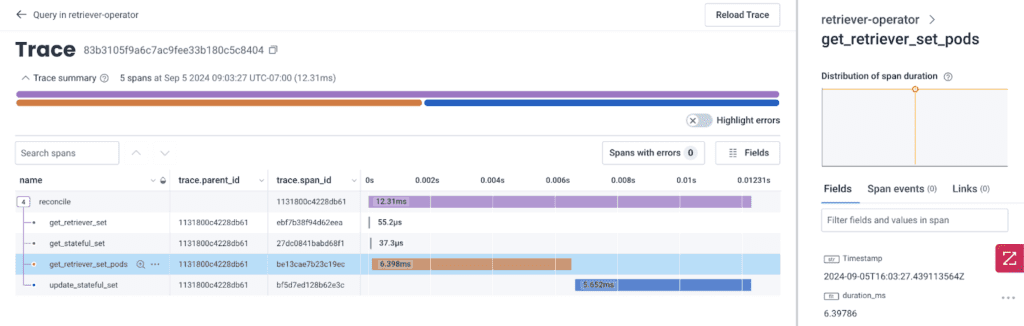
Finally, with certain dimensions, events can also act as spans, a concept from OpenTelemetry, that serves as the parts of a whole trace. The way OTel works today is that if an event has a dimension recording a timestamp, a span ID, a trace ID, and optionally a parent ID, then a trace can be constructed from events. Honeycomb collects each individual span, which is differentiated by its distinct IDs, as elements in an unordered set. Once collected, they can then be ordered according to the parent ID, which tells the tool which other span was the efficient cause of the span in question, and its timestamp.
But wait, there’s more: traces!
Practically, this means that the events can produce a model or representation of a flow of functions performed by the software. This model, in industry jargon, is a trace. A trace lets someone understand how the system affects itself over time like a waterfall or a family tree.
Taken together, this all means that events synthesize the three pillars. However, they’re genuinely novel because they’re not reducible to the three when they’re understood as fundamentally different. The truth of the matter is that they’re not so irreconcilable. Events can do the work of all three and more.
The operative analogy to understand how events do this is depth perception in vision. Human eyes each have their own field of vision which conflicts with the other. However, when they overlap and the human brain gets involved, it can synthesize them and produce that third dimension. That extra dimension enables new and advantageous actions and understandings of the world.
Relaxing assumptions
At this point, you might still not be convinced of the value of events. In a certain sense, they’re even weirder than traces, which only made their way into the industry’s mainstream discourse in the last 10 years or so. So why should someone “drop” the tools and models they’re used to for something that’s still getting validated as a useful tool?
I’ll pick on metrics, because the people who seem to resist an event-based methodology seem to be folks who valorize them. People who base their understanding of their systems on metrics seem to forget that’s just one way to model the system.
There are certain component metrics that are at the center of attention. Additional information can be appended to those metrics as tags. Those metrics can be tracked in time series that represent how they change over time, and the tags allow for correlating changes with the denoted contextual factors.
Trying to create custom metrics, which are combinations of metrics, is computationally expensive because you need to produce a lowest common denominator in the form of a float. Alerts are based on whether the metric crosses a predetermined threshold during a predetermined time period, even if it returns to the acceptable performance zone during the next time period.
The unspoken assumption is that the canonical metrics, memory, CPU, I/O, etc., of a given machine (or set of machines) are what are most important to make a software system operate effectively. An event-based model of a system doesn’t hold that assumption. Folks who work this way know that historically, metrics were essential to ensuring that the system worked. But in a world with so many layers of abstraction between a system’s users and the machines, not to mention the flexibility to move compute processes that cloud computing provides, this assumption may now be invalid.
Letting go of assumptions led to gamechanging improvements
Honeycomb took a chance on another model. One where events recording the execution of different code functions (or other “units of work”) and the context which makes up those executions were front and center. By swapping something that seemed peripheral in the extant model, a new way of doing things more effectively was born.
In this sense, the move is analogous to the famed Copernican revolution. This was when Copernicus produced a new model of the solar system, moving from geocentric to heliocentric. He did this to solve a problem, namely that all the calculations of the heavenly spheres’ positions were always slightly off, and adding extra facets like deferents and epicycles only brought medieval scientists asymptotically closer to the correct value. With this shift and Kepler’s contribution of elliptical orbits, scientists realized that by changing the model, they’d get much better results.
This is precisely what advocates of events have been saying. With a metrics approach, or a three pillars one more generally, people need so much more overhead to get even a workable result. And in fact, deep down they know that it’s just barely workable because there’s always remainders that get ignored, pile up, and create future problems that will require even more overhead. Events produce a much simpler, more effective, and more elegant way to work.
Conclusion
For the last year or so I’ve been trying out these analogies, and they seem to help people get the change that Honeycomb is after. We model for many different reasons, and the capacity to think with many models has demonstrable benefits. A multitude of experiences allow for considering a problem from different perspectives, which can be synthesized to create a genuinely novel solution. Furthermore, that solution may have additional benefits beyond the narrow situation which prompted its inception, just like depth perception has allowed organisms to do many more things than reconcile different fields of vision.
But first, it takes understanding that there is a problem. Mounting frustrations, heightening tensions, and a broadly hostile environment are telltale signs, and require critical, reflective thought to pinpoint the source. Only once a problem is made known and examined can one find a solution, which may mean letting go of cherished beliefs and ways of being. But the hope is that one will see that what is cherished is in fact harmful, not helpful, and so should be appropriately devalued. That creates the opportunity to learn to cherish something new—and perhaps, give one the chance to flourish.
Want to know more?
Talk to our team to arrange a custom demo or for help finding the right plan.