How Honeycomb Is Embracing the Challenges of End-to-End Observability with Embrace
Why hop between tools when you can have a single, unified view? By speaking the common language of OpenTelemetry, Honeycomb and Embrace are finally closing the gap between the frontend and the backend.

By: Howard Yoo
Honeycomb Innovation Week: Announcing Our Partnership With Embrace
Every user, every screen, every system: Honeycomb's strategic partnership with Embrace extends deep observability across your full stack so nothing hides in a blind spot.
Watch Now
From Honeycomb’s perspective
Customers regularly come to us looking to solve their observability problem by connecting the dots from frontend to backend. It sounds straightforward in theory, but in practice it's one of the hardest problems in modern application monitoring. The frontend monitoring tools they already have in place tend to be proprietary or narrowly scoped to frontend needs, leaving them without the context-rich backend data that makes real triage possible. When something breaks, the symptoms might surface in the user's browser or mobile app, but the root cause is buried somewhere in a backend service three hops deep.
The result is predictable: teams run two solutions side by side, hopping back and forth between dashboards, manually correlating timestamps and user IDs, and trying to piece together a coherent story from two halves that were never designed to talk to each other.
What makes Embrace the right partner for Honeycomb is a shared foundation. Embrace, like Honeycomb, was built on OpenTelemetry from day one and approaches mobile and web performance the way we do, which is to treat it as a first-class observability problem rather than a separate discipline that lives off to the side. That alignment matters more than it might sound. When two platforms are built on the same open standard, the data they produce is inherently compatible. There's no lossy translation layer, no proprietary schema mismatch, and no need to reshape telemetry just to make one tool understand what the other is saying.
Once Embrace captures frontend telemetry from a web or mobile application, the critical signals flow seamlessly into Honeycomb through a simple integration. You get metrics and network spans that tie backend service traces to frontend sessions and deployments, all without the major engineering lift that usually accompanies cross-stack observability projects. For Honeycomb users, it means the traces they're already querying suddenly extend further than ever before, all the way out to the user's device.
Join our live webinar with Embrace
How to close the gap between
frontend experience and backend truth
on June 24 at 10 a.m. PT / 1 p.m. ET
From Embrace’s perspective
At Embrace, we've always believed that frontend observability shouldn't be a black box. Too often, engineering teams are left with fragmented data, crash reports here, ANR traces there, network logs somewhere else with no clear thread connecting a user's frustrating experience to what actually went wrong in the system. That's why Embrace was built from the ground up on OpenTelemetry. We don't just collect data; we emit rich, structured telemetry that any OpenTelemetry-native backend can reason about. Honeycomb, which shares that same foundational commitment to high-cardinality, event-driven observability, is a natural home for that data.
The partnership with Honeycomb solves a problem we hear from customers constantly: their backend teams live in one tool while their mobile and web teams operate in another, and nobody has the full picture when something goes wrong. By forwarding Embrace's network spans, complete with W3C trace context, directly into Honeycomb, we're giving backend engineers the frontend signals they've always been missing, and giving mobile and web developers a way to connect a slow session to a struggling microservice. Embrace also forwards metrics and logs into Honeycomb, giving teams the ability to track trends like session counts, crash rates, and request volumes alongside their backend data, so they’re not just debugging incidents reactively, they’re spotting patterns before they become issues.
Our solution
So, how exactly does it work?
Start by setting up Embrace's SDKs in your web and mobile projects. Embrace's documentation covers the major integration paths for Android, iOS, Web, React Native, Unity, and Flutter, so whatever stack your team is on, there's a supported route. A major advantage is that every Embrace SDK is built on OpenTelemetry as its foundational observability standard, which means the data leaving your application is already in a format the rest of your observability ecosystem understands.
Once instrumentation is in place, the Embrace dashboard begins collecting telemetry from the frontend. You now have a fully functional view of your application's health inside Embrace, but the real value comes from extending that visibility into Honeycomb so backend and frontend teams are working from the same source of truth.
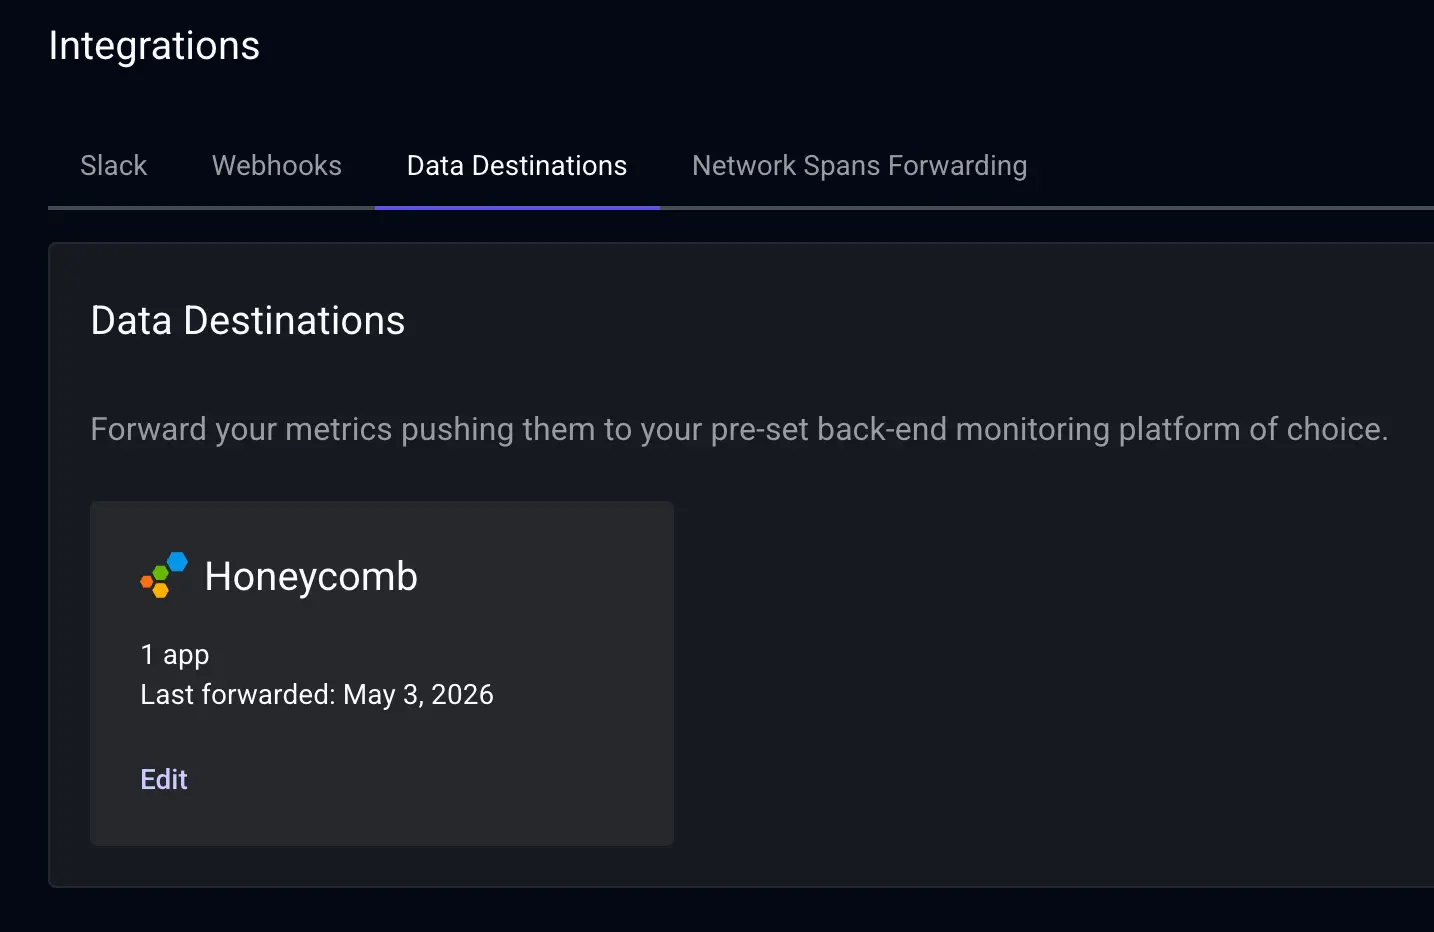
From there, you configure Honeycomb as a Data Destination inside Embrace, which takes nothing more than your Honeycomb API key. The setup is intentionally lightweight because the heavy lifting (instrumentation and data formatting) has already been done by the SDKs. With that connection live, Embrace starts streaming metrics into Honeycomb, including session counts, span counts, network requests, exceptions, durations, and more.
Together, these metrics give you the key signals you need to understand how your frontend applications are performing over time, and they slot naturally into the dashboards and queries Honeycomb users are already comfortable with.
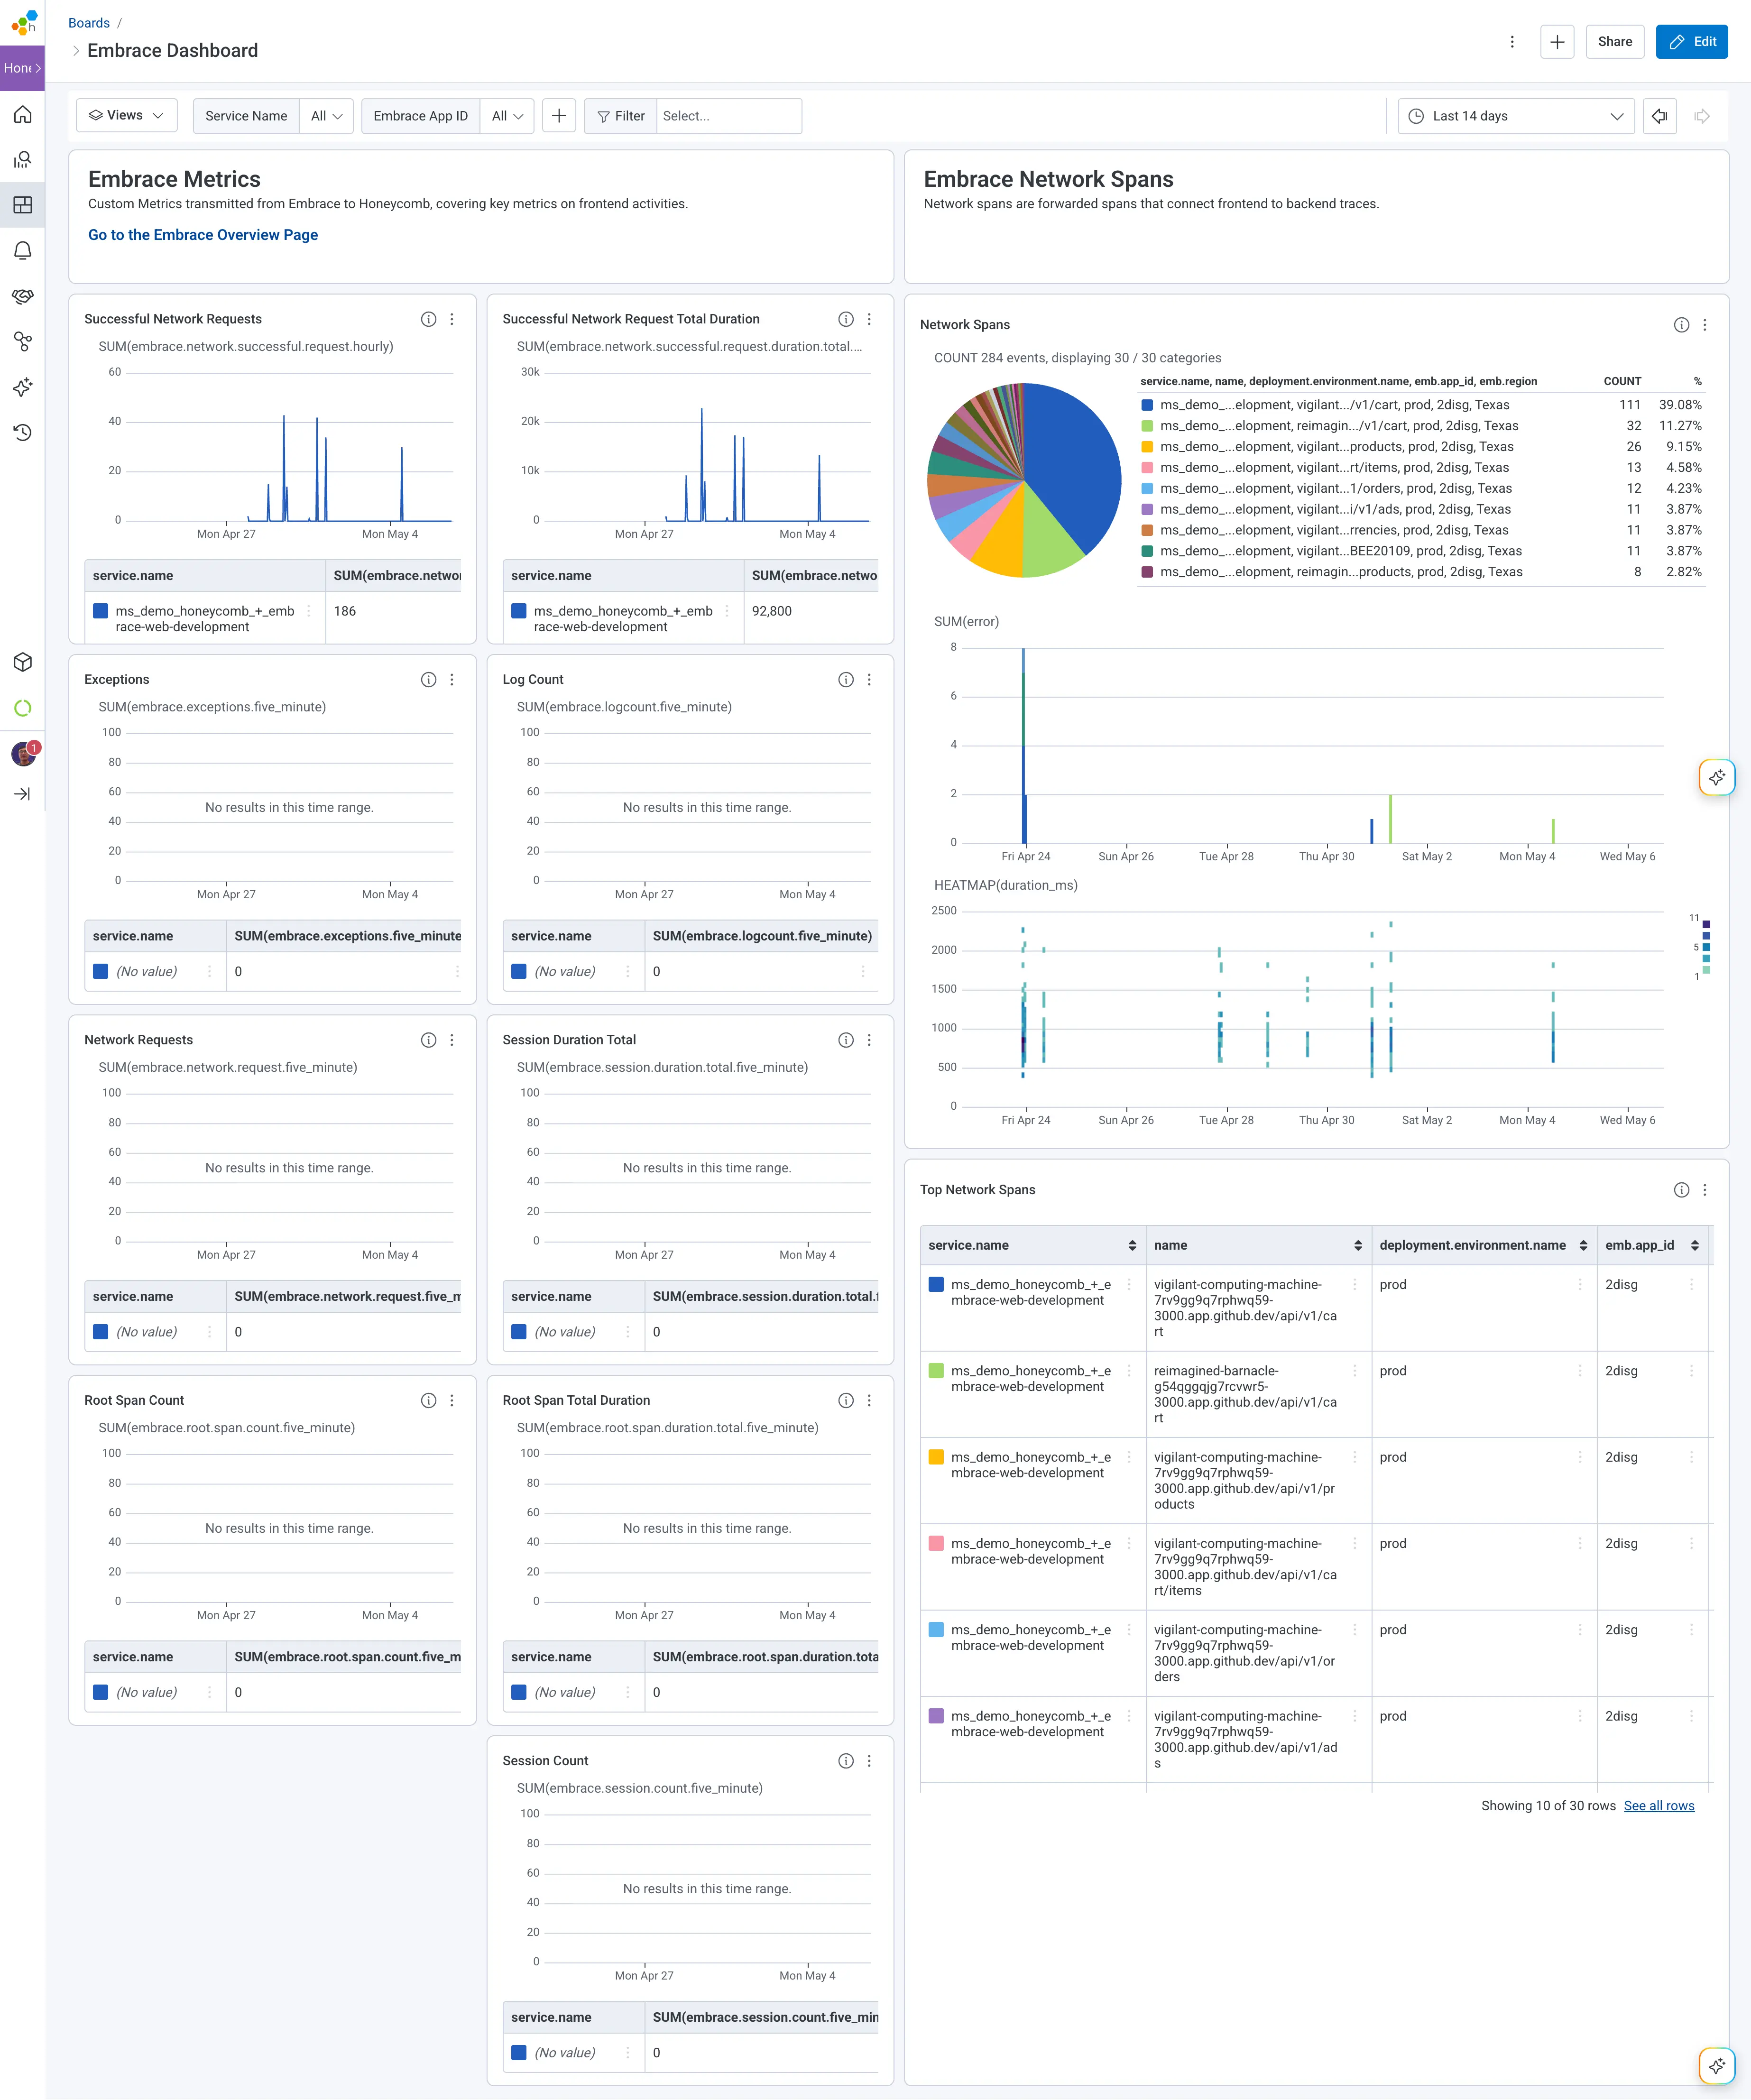
Metrics are great for trends and aggregates, but when you need to understand a specific user's experience or chase down a specific failure, you need traces. That's why Embrace also forwards critical network spans to Honeycomb.
Any request traveling from frontend to backend over the network (hence the name) carries W3C trace context with it, which is the open standard that lets distributed systems agree on how to identify a single request as it moves between services. When the corresponding backend spans are generated, they are stitched together into a single trace. You get network-side performance data alongside context like device type, operating system, and application version, all on one timeline. Suddenly, the question "why was this request slow for this user?" has a real answer, not a guess.
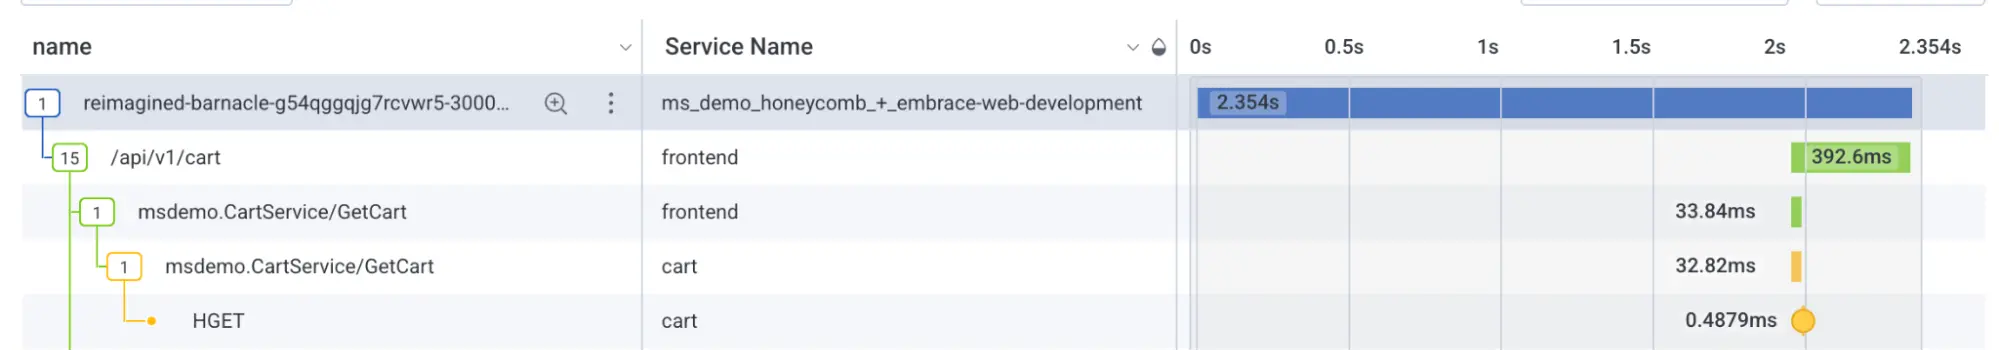
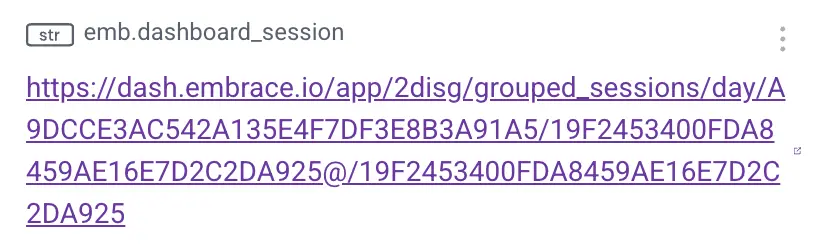
These network spans also include a link back to the Embrace dashboard, which Honeycomb users can click to jump straight into the session activity and user timeline. From there, you can see every user action, network request, and Core Web Vitals captured on the Embrace side, giving you the human context behind the trace data. You can see what the user was doing in the seconds before the failure, not just what the system was doing.
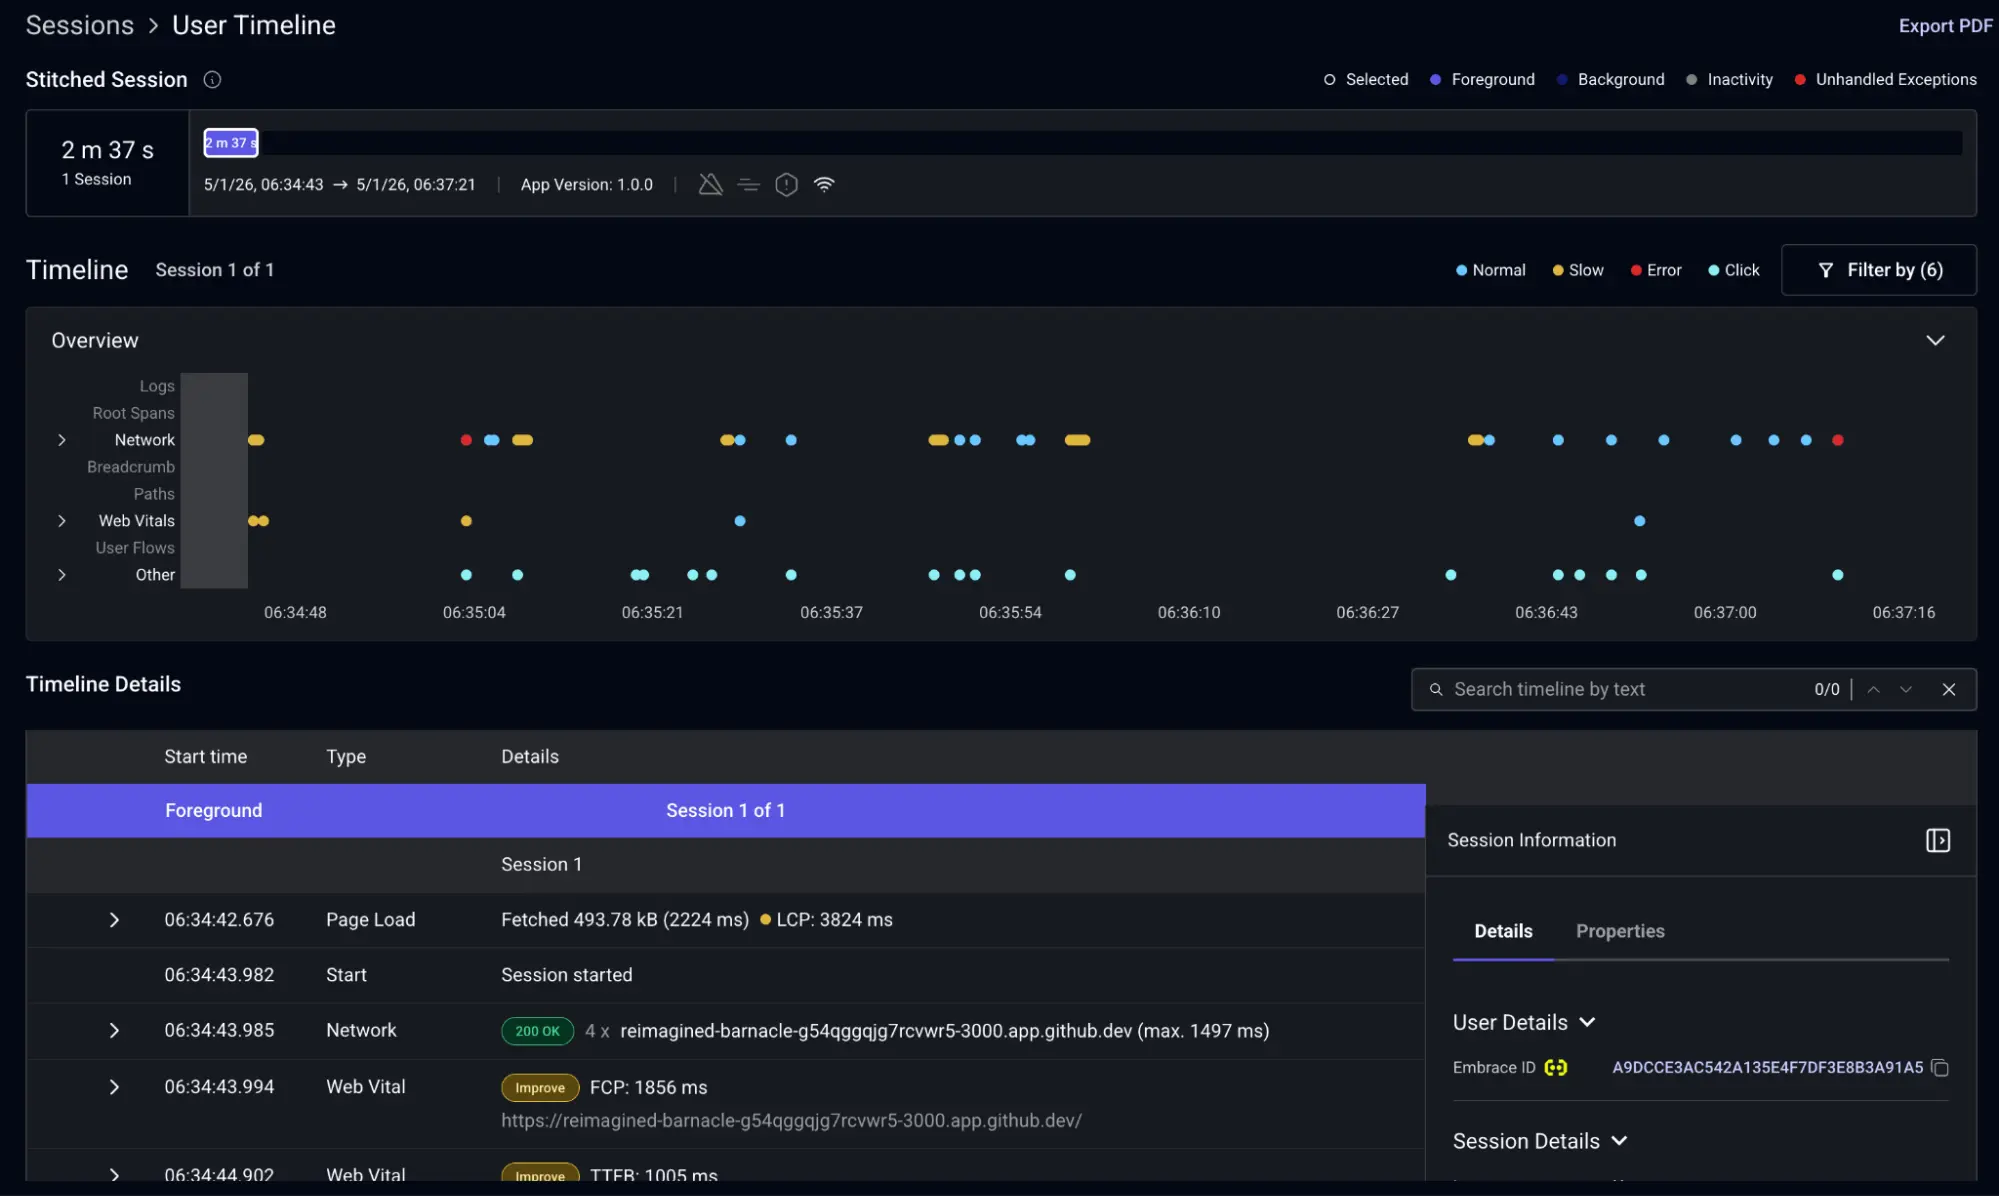
On the Embrace side, you can check whether any additional network requests were made during the same session. This kind of cross-checking is often where root causes hide, because a single failure rarely tells the whole story.
Say you spot an erroneous response sent to the backend.
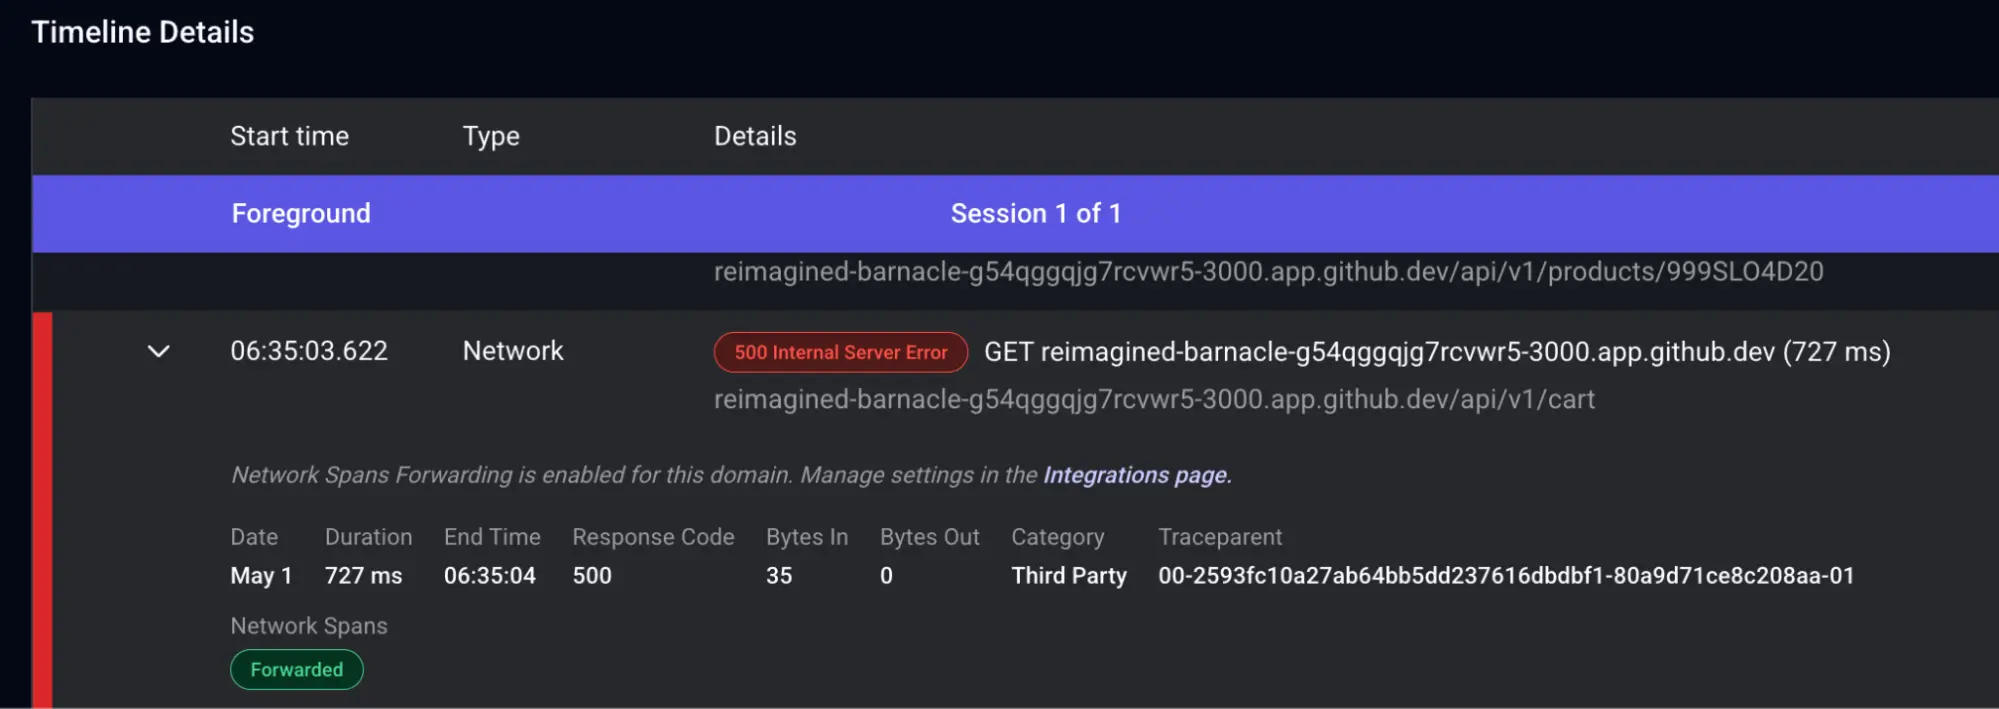
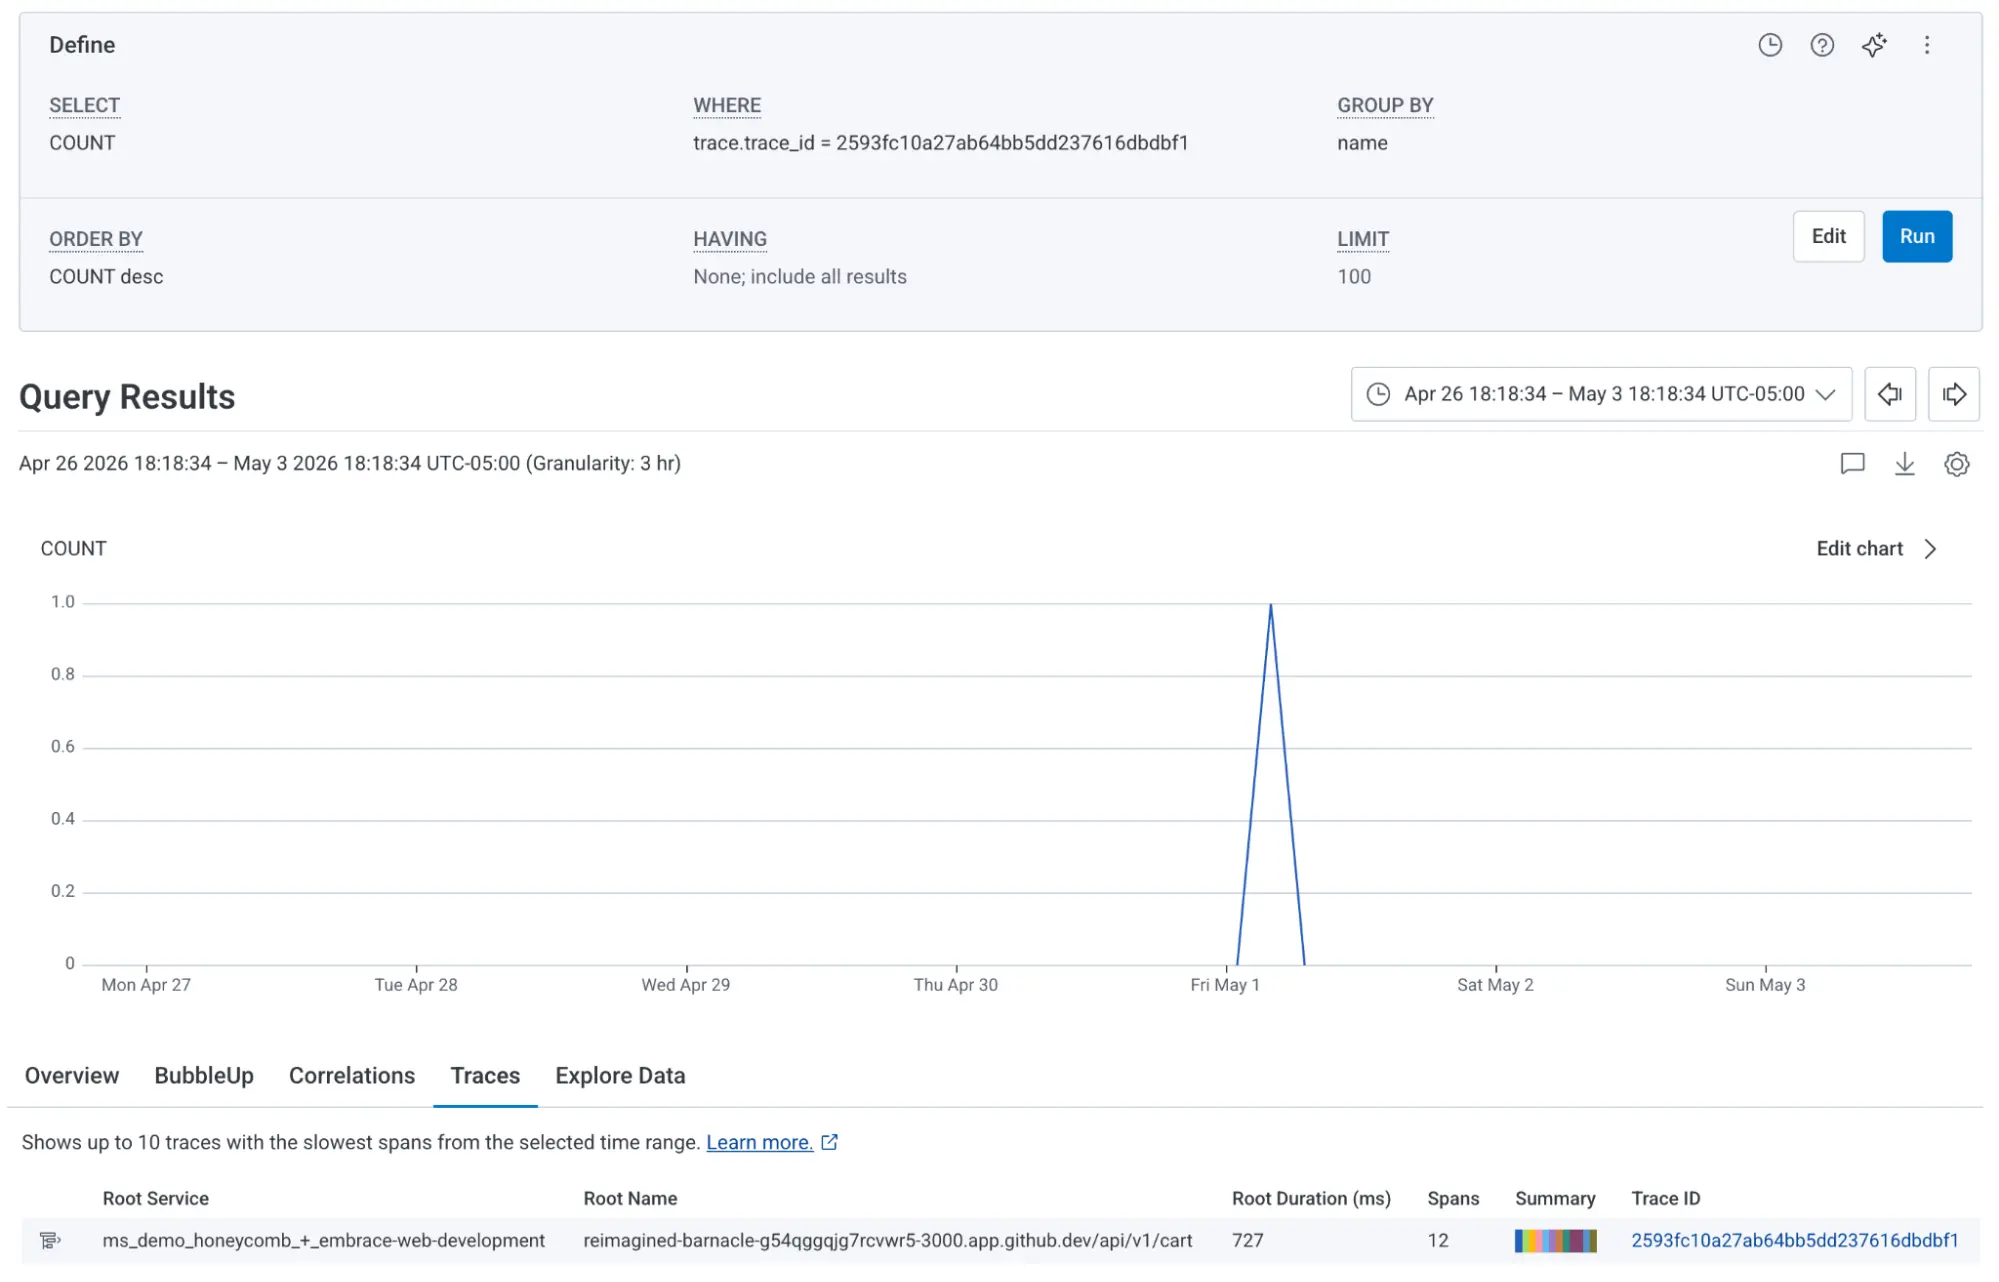
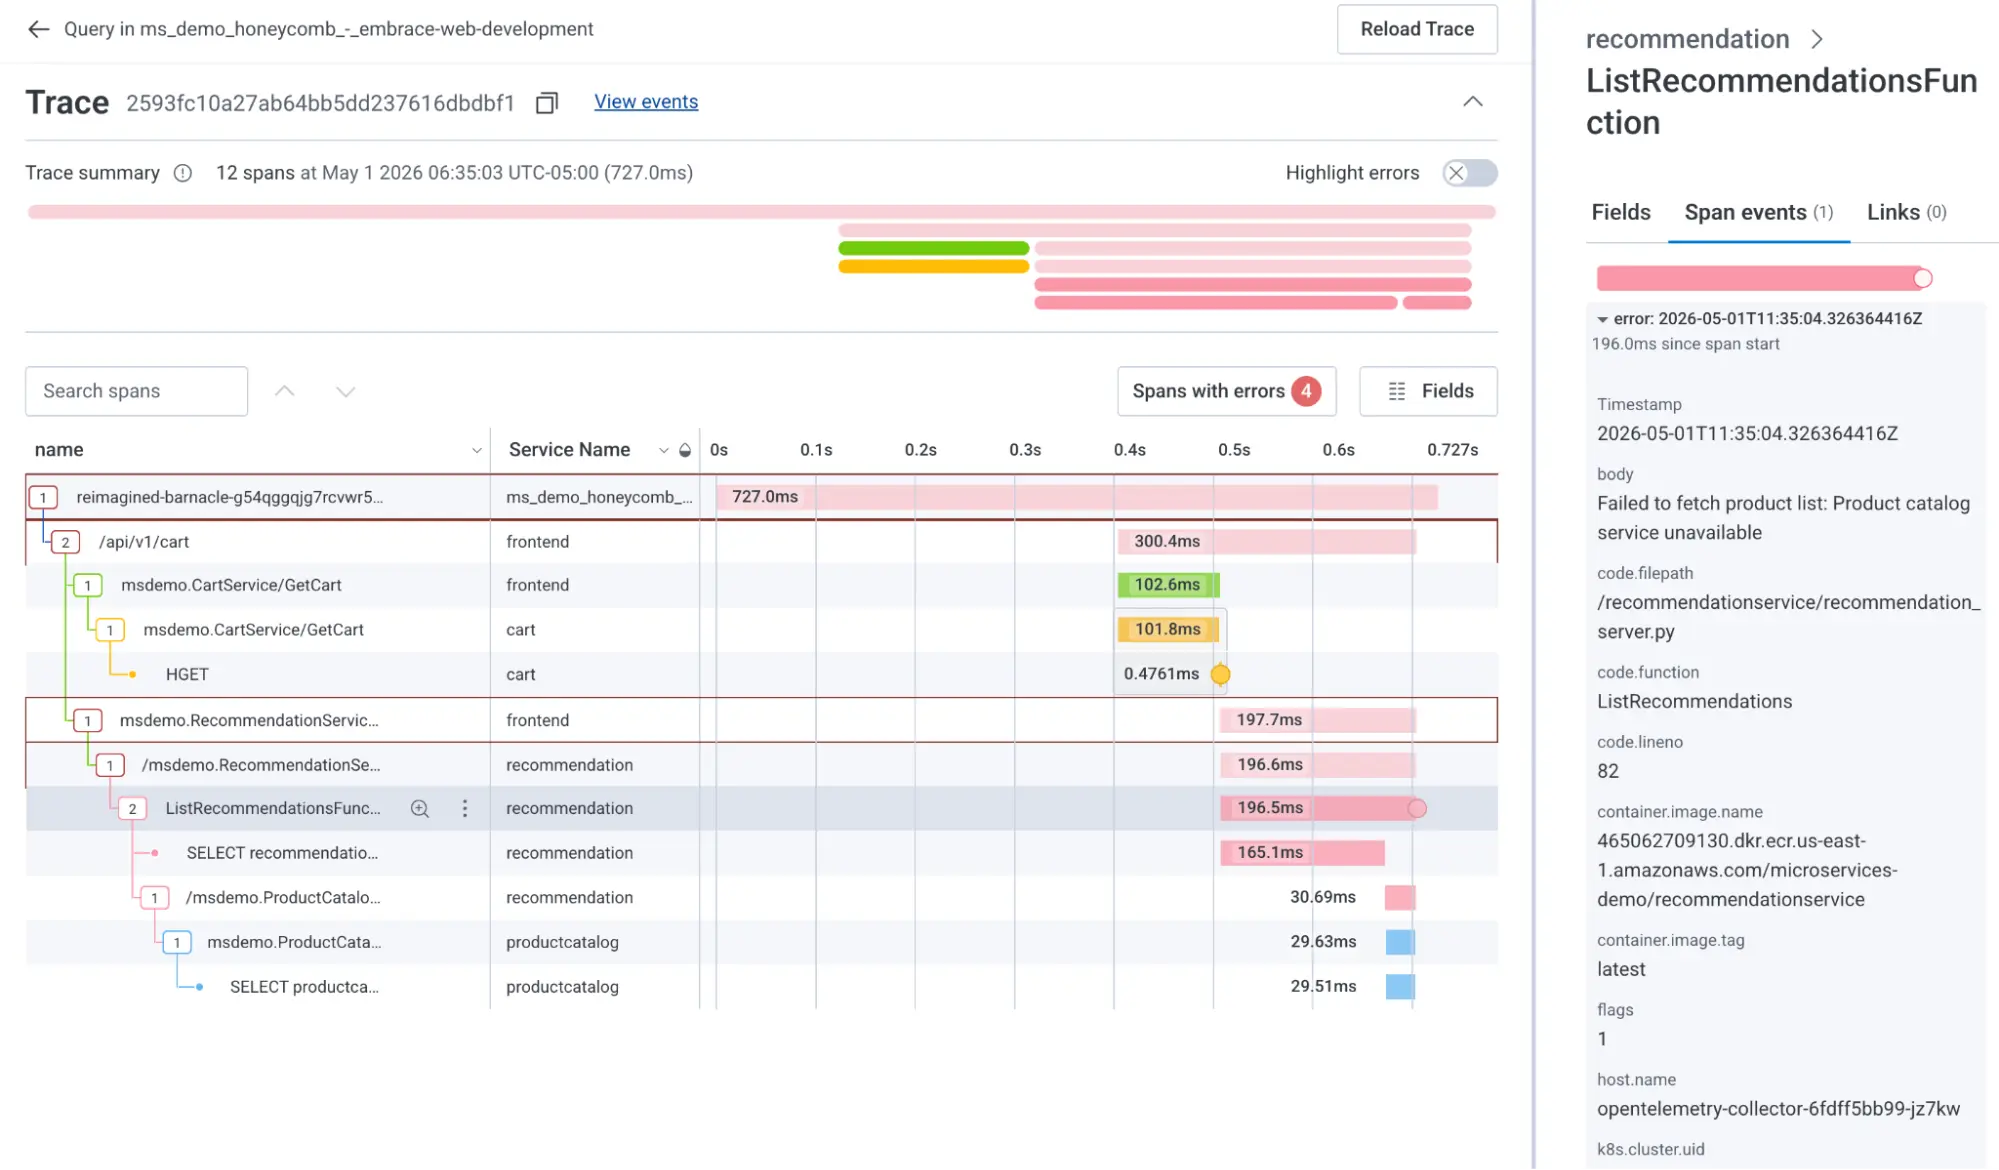
Embrace shows you whether that information has been forwarded to Honeycomb. The green 'Forwarded' label confirms the data made it through. Using the trace context, for example, 00-2593fc10a27ab64bb5dd237616dbdbf1-80a9d71ce8c208aa-01, you can search directly in Honeycomb to investigate the root cause of that 500 error and view the full trace. In this case, the trace points to the product catalog service being unavailable, which is a finding you'd be hard-pressed to surface from frontend data alone.
(Note: the second segment, 2593fc10a27ab64bb5dd237616dbdbf1, is the trace ID of the request to the backend, and it's the piece you'll most often paste into Honeycomb to pull up the matching trace.)
Honeycomb and Embrace teams are currently working together to make this transition much easier by providing a direct link to view the trace view from within the Embrace UI itself.
Conclusion
In the end, why hop between tools when you can have a single, unified view? By speaking the common language of OpenTelemetry, Honeycomb and Embrace are finally closing the gap between the frontend and the backend. It’s time to stop the context-switching and start seeing the full story of your users’ experiences, from the first tap on a screen to the final response on a backend.
This blog was written by Howard Yoo and Aissa Mamdouh.