Improving LLMs in Production With Observability
In early May, we released the first version of our new natural language querying interface, Query Assistant. We also talked a lot about the hard stuff we encountered when building and releasing this feature to all Honeycomb customers. But what we didn’t talk about was how we know how our use of an LLM is doing in production! That’s what this post is all about.

By: Phillip Carter

Quickly: if you’re interested in observability for LLMs, we’d love to talk to you!
And now for our regularly scheduled content:
In early May, we released the first version of our new natural language querying interface, Query Assistant. We also talked a lot about the hard stuff we encountered when building and releasing this feature to all Honeycomb customers. But what we didn’t talk about was how we know how our use of an LLM is doing in production! That’s what this post is all about.
Why observability matters for LLMs in production
LLMs are nondeterministic black boxes that people use in ways you cannot hope to predict up front. And to make matters more difficult, subtle changes to the prompt you send an LLM can result in dramatically different behavior. If you’re an engineer responsible for your product’s behavior in production, that should scare the shit out of you. And really—if you’re anyone in an organization who cares about your LLM features doing well in production, you should be aware that:
- Failure will happen
- Users will do things you can’t possibly predict
- You will ship a “bug fix” that breaks something else
- Latency is often unpredictable
What’s interesting is that these aren’t properties unique to LLMs. Countless engineers have had to deal with subtle systems that can’t be debugged locally. The principles and techniques that make observability necessary for modern software development apply to LLMs in production.
A quick “why” on Query Assistant
In our announcement post for Query Assistant, we say this:
“A common pitfall in many observability tools is mandating use of a query language, which seems to result in a dynamic where only a small percentage of power users in an organization know how to use it.”
To elaborate on this, there’s a pretty direct correlation between how actively someone uses our querying engine and their desire to upgrade to a paid tier. Engineers come to our product with real problems they need to solve, and it’s critical for us to make the product as easy to use as possible. Querying is the most fundamental activity in Honeycomb, and people who struggle with it end up leaving.
To that end, we bet on Query Assistant as a way to make it easier for new people to translate their own mental model of their systems and data into a Honeycomb query. However, this introduces new problems:
- How likely are people to get a relevant and useful query from AI?
- How do we fix errors people have?
- How do we know that our prompt changes resulted in tangible benefits at large?
We can’t apply guesswork to these problems. And so that’s why observability helps us, and we think can help many others with similar problems!
Read the Query Assistant Announcement
A tour of the things you can learn
Before diving into how you do it, here’s a tour of the things you can learn about your LLMs in production with fairly basic observability. You don’t need to carve out a month of time to get started; an afternoon is enough. Below are examples from our own LLM feature, Query Assistant, with real data.
Triplets of user input, LLM response, and error
Whether your call to an LLM produces an error or using its response generates an error elsewhere in your application, you can capture all of this information and trivially present it all.
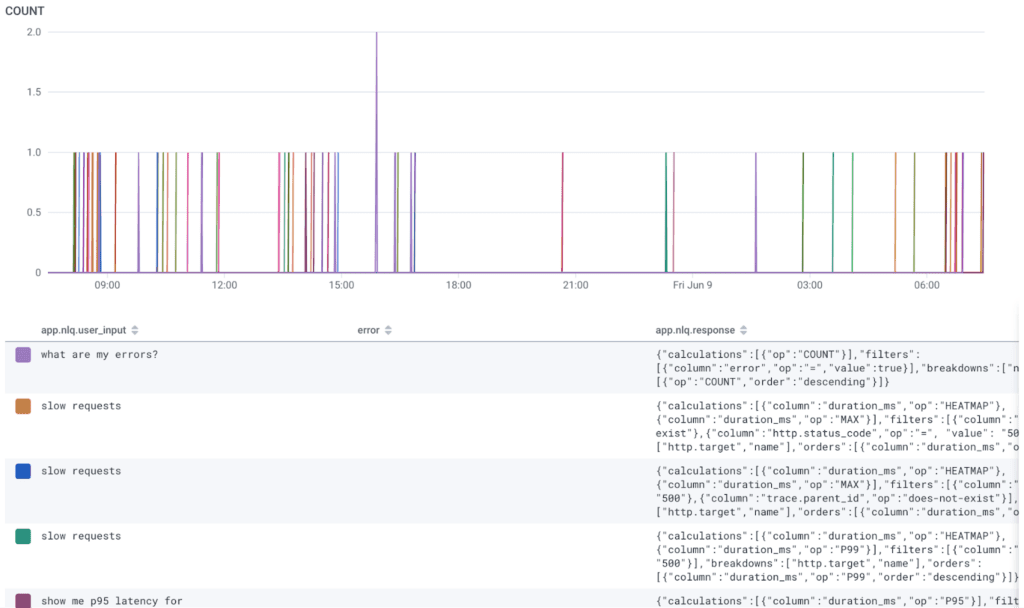
For example, here’s a snapshot of some errors we’ve received in the past, organized as a triplet of user input, error, and LLM response (field names are app.nlq.user_input, app.error, and app.nlq.response):
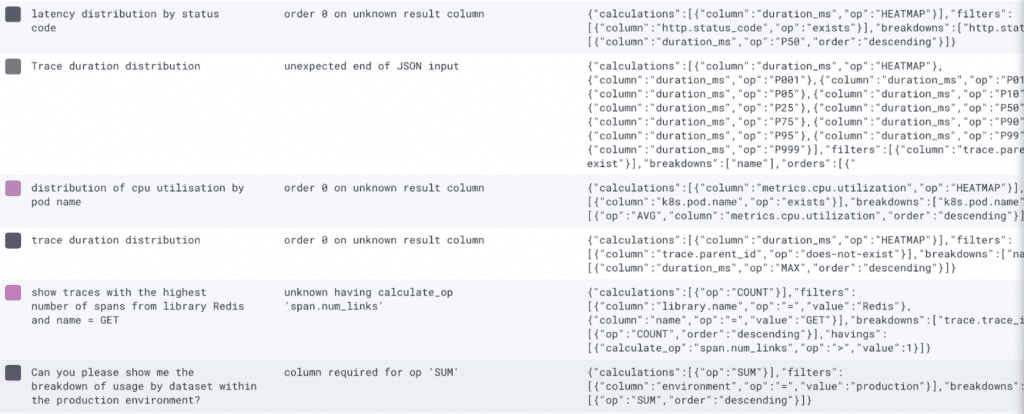
As you can see in the rightmost column, our call to OpenAI results in a JSON string. This JSON string is called a Honeycomb query specification. In fact, the way Query Assistant works is we gather a bunch of context with the user’s input and get the LLM to produce this JSON string.
This snapshot reveals several fixable problems with our feature that lets you create Honeycomb queries from natural language:
- “order 0 on unknown result column” – the LLM produced a query with an ordering (P50(duration_ms)) that doesn’t exist in the calculations block. This tells us that we can work on our prompt to not produce these invalid queries, remove the bad clause, or add a clause into the calculations block that corresponds to the extraneous ordering clause.
- “unexpected end of JSON output” – the LLM produced more output than we allocated for it (150 OpenAI tokens). It went a little wild with calculations, putting in way too many operators. We can improve our prompt so that it doesn’t include so many PXY operators for inputs, similar to “trace duration distribution.”
- “unknown having calculate_op ‘span.num_links’” – a generated query was not structurally correct, and was arguably the wrong query to suggest in the first place, even if it were correct! For some reason, this input led to a havings clause when a filters clause would have been ideal.
- “column required for op ‘SUM’” – the LLM produced an invalid query. However, we don’t know which column in the user’s schema should go with the SUM operator, or whether the LLM’s output makes sense for their input. We’d need to look at this user’s other querying activity to understand what makes sense.
With only three fields based on production data, we can identify several flaws in Query Assistant and improve them. In fact, every time we spend time on prompt engineering, we look at this information to see which patterns are problematic, rather than guessing at what might be worth fixing.
The above snapshot is sort of like a structured log, except it’s assembled ad hoc by a Honeycomb query. At scale, we don’t just look at a stream of data like this—we look at trends, narrow down by time and scope, and analyze. This is a common observability practice.
End user latency and token usage
Beyond errors, good or bad latency is going to make or break your product. Token usage (for LLM outputs) affects latency as well. So why not show a distribution of both of these and look for patterns?
For example, here’s a distribution of Query Assistant’s token usage and latency (called a Heatmap in Honeycomb):
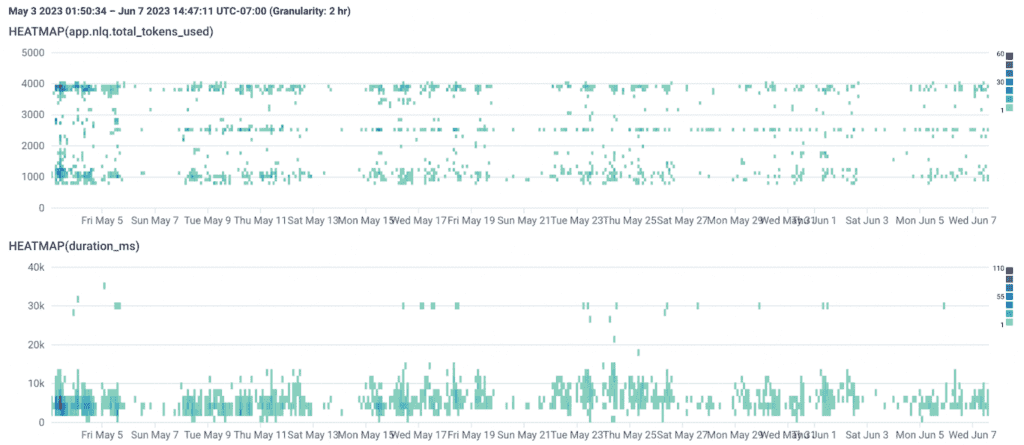
Briefly, Heatmap distributions in Honeycomb distribute and bucket values along a y-axis over time. In the top chart, moving up the y-axis represents an increase in tokens used for requests to OpenAI.
If you look at horizontal bands along the y-axis in the first graph, you can see three general groups related to token usage. The bottom group is a little over 1k tokens per request, the middle one is around 2.5k tokens, and the final group hovers around 4k tokens… which is the limit of gpt-3.5-turbo’s request limits.
In Query Assistant, we include the list of columns in a team’s schema for the dataset they are querying in our prompt. We truncate fields in the schema if they’d go over gpt-3.5-turbo’s context window. The final group at the top tells us that there are a lot of requests where the list of columns approaches or reaches gpt-3.5-turbo’s limits, and we might be eliding critical information to generate a query for these requests.
The above query visualization is also broken down by which teams use the feature, ordered by a COUNT of how many requests to OpenAI they’re responsible for (only showing the top 17 for the sake of this blog):
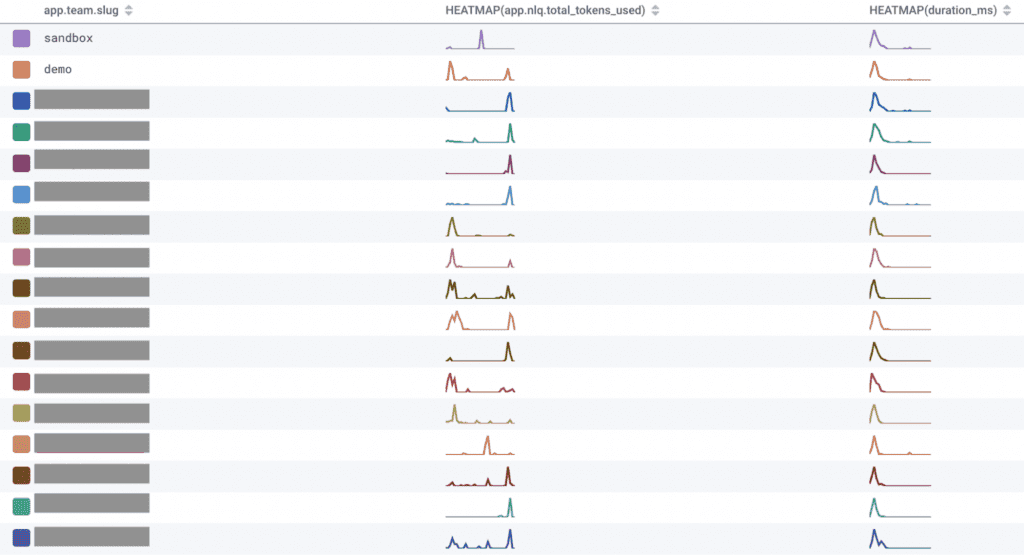
In this table view, there’s a team name (redacted), a sparkline that shows their distribution of tokens used over time, and the latency they experience. Token usage varies based on the team (names redacted). Some teams have large schemas, so they hit the limit at around 4k tokens. Others are well below that limit.
We used this information to make the decision to use Embeddings to only include a subset of a user’s schema. The reason why we didn’t ship with this initially is twofold:
First, we wanted to release Query Assistant to people as soon as possible, and an Embedding management system adds a lot of complexity for an incremental improvement. A tool like Pinecone would mean storing customer schema information with a third-party indefinitely. While Pinecone has good controls for data, this could be problematic for many of our customers compared to the ephemeral storage OpenAI uses for abuse monitoring on data you send via the API. Additionally, schemas tend to only change over short periods of time, so it could be more effective to roll our own system that fetches a schema’s Embedding and updates it when there’s a change rather than use a vector database. Whether we went the third-party route or built our own thing, that’s more vendor management and/or infrastructure overhead.
Second, we knew from analyzing our data that most teams had schemas well below gpt-3.5-turbo’s limit. In fact, the large majority of datasets that people query are small enough to fit every column name into that context window! However, that says nothing about who actually uses the feature once it’s live, which could only be figured out once we released the feature to everyone.
Our hypothesis was that teams with bigger schemas who use our product heavily would see less value in Query Assistant, since they’d already be familiar with querying. As it turns out, they use Query Assistant the most! Oopsie. Observing real world feature usage made prioritizing what to work on next straightforward.
In hindsight, it’s not surprising that teams with the largest (and likely most complex) schemas use our feature the most. This points to different improvements we could make to our product, and aligns with verbatim feedback we’ve gotten from some of our customers.
Most requests to OpenAI take less than 10 seconds. While we’d love for that to improve, the reality is that it often takes users more than 10 seconds to think about how they want to translate what’s in their head into a Honeycomb query and interact with the relevant UI elements that let them do this. Although we haven’t gotten any feedback about response times, we expect that to come in sooner or later.
Triplets of user input, user feedback response, and result they got
User feedback to LLM inputs is critical to a product’s success. However, users tend to give feedback when things aren’t great. While you can’t objectively say how well the feature is doing overall from feedback alone, even a simple “no” response can help you identify patterns in inputs and results.
In Query Assistant, there’s a feedback box that asks the user if the query they got was what they wanted, with buttons for “yes,” “no,” and “not sure.” Here’s a snapshot of recent responses:
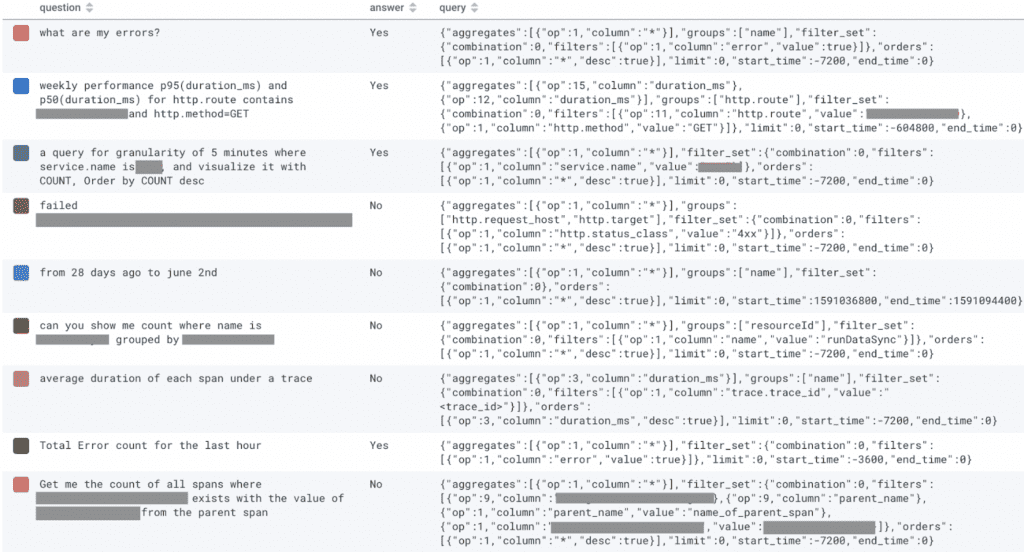
Note that the “query” object is not necessarily what the LLM gave us in our API call. It’s the actual query that ran in our querying engine, which means it was validated and potentially “fixed up” first. Right now it has some oddities, like “op:1,column:*” (an internal representation of the COUNT operator), that we’re planning on cleaning up. But even before we clean the data up, it’s helpful.
One of the “no” answers explicitly asked for something “failed $REDACTED”, but the thing they asked for is nowhere in the query that was run! Is this just an outlier, or is there a pattern where the LLM omits specific details someone asked for? This direct connection to user feedback can inform what to focus on for a prompt engineering session.
Monitoring end user errors over time
It’s not the end of the world if a single user doesn’t get a useful result from your LLM feature. It’s also not the end of the world if there’s a single error, like if OpenAI’s model overloads. However, if you end up with multiple errors in a short span of time, chances are you have a problem to fix. So how do you know when it’s worth investigating? Answer: Service Level Objectives (SLOs).
Briefly, SLOs are a way to measure data (such as requests to OpenAI) and pass it through a function (called a Service Level Indicator or SLI) that returns true or false. You then define the rate at which that function should return true over a span of time. Behind the scenes, a budget for failure is established, and you can define alerts that progressively notify when a budget gets close to—or exceeds—its limit. SLOs ensure people only get alerted when something is actually a problem.
We have an SLO established that tracks how many errors a user of Query Assistant experiences. We configured it as such:
- SLI: any error (doesn’t matter which) as a result of calling OpenAI, parsing its output, or attempting to run the query we got back counts returns false; otherwise true
- Target of 75% successful requests over a seven day period
- Send a Slack notification when we’re four hours away from exhausting our budget
We based this on dogfooding of the feature, and the fact that Query Assistant isn’t a mission-critical system. Most services have a 95% or higher success target, but we felt that didn’t make sense for the initial release of a feature using an LLM to produce a Honeycomb query.
Since release, we incorporated a bunch of fixes with the aim to improve query accuracy. Here’s a snapshot of the impact of the first round of that work over a seven day period:
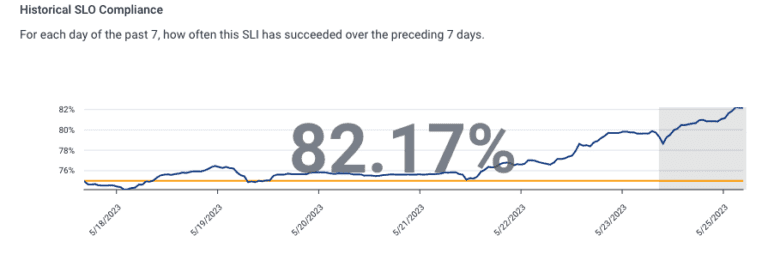
This caused us to change our target to an 80% success rate, since we were clearly doing better than 75%.
Here’s an up-to-date snapshot of our SLO’s description, SLI, and current budget burndown:
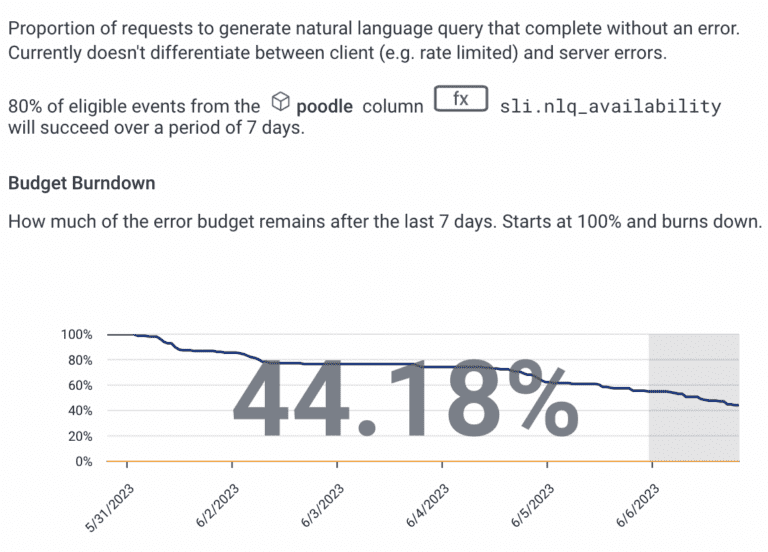
Our error budget is over half exhausted. Could be better, could be worse. Nothing to worry about right now.
We can also see our historical compliance with our SLO:
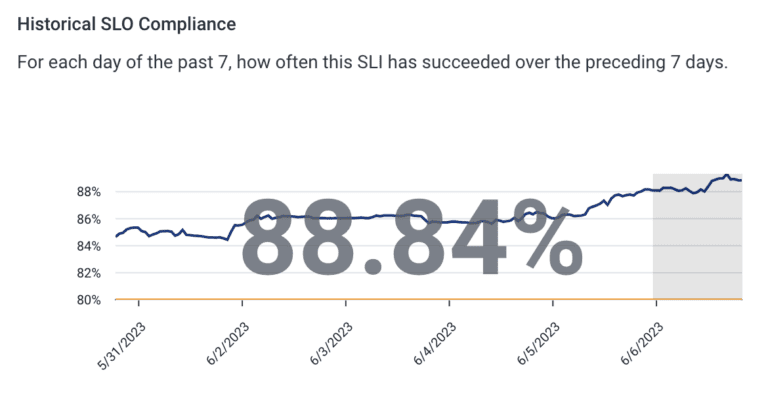
We spent a few weeks identifying “fixable” responses from OpenAI that would normally result in a failure to run a Honeycomb query, then applying a fix so it’s runnable. For example, if it used the COUNT operator and included a column, we’d remove the column because COUNT does not take a column as input. It seems that our work around correcting LLM outputs has paid off! We’re up nearly 15% compared to when we first launched. Now the bulk of errors users encounter is when the LLM itself does not produce a Honeycomb query specification object.
A neat feature about SLOs in Honeycomb is that they let you automatically see the distribution of values of fields in your telemetry. For our SLO on Query Assistant errors, it computes how often a value of a field in our telemetry fails our SLO, then orders by frequency. Here’s how that looks today:
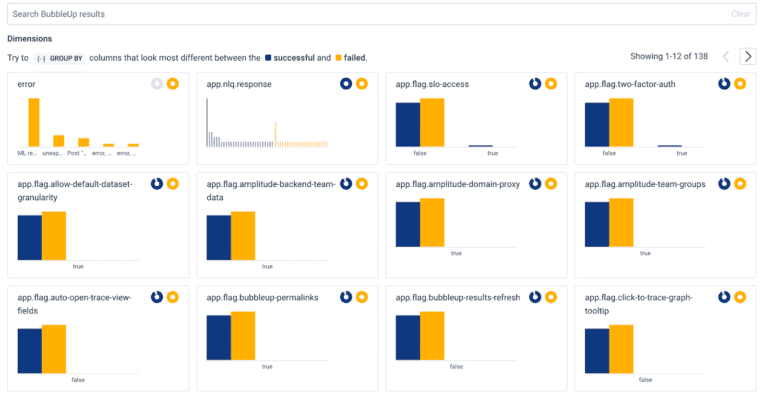
As you might expect, the most common field is “error,” which contains the error message associated with a failed attempt to run a query from Query Assistant.
Digging into that field, we can see which errors are most common. In this case, it’s “ML response contains no JSON,” which means there wasn’t a Honeycomb query in the response. However, we can also see that there’s a different error showing up:
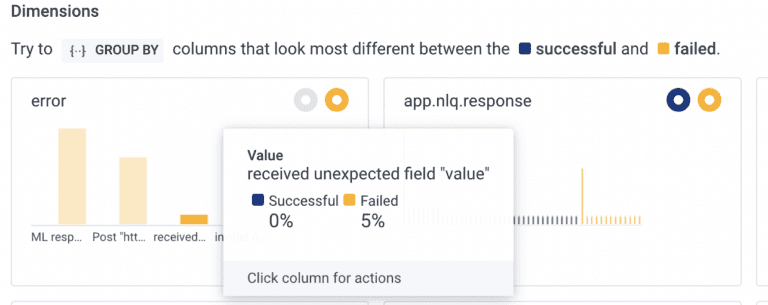
This error tells us that OpenAI generated a query object in JSON, but it’s invalid. Specifically, it has a field called “value” where it shouldn’t be. We can dig into this and automatically query for where this hold true:
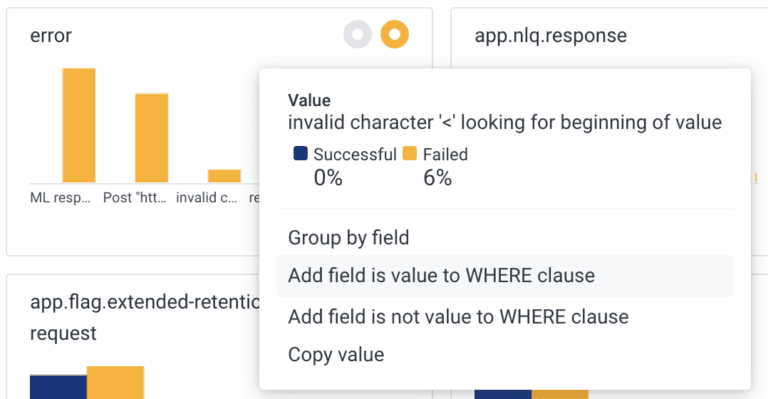
And this will put us in a query where we can then add what the user input and LLM outputs are for this error.
Service level objectives let you monitor what matters for your end users and quickly explore when something isn’t working right.
Monitor cost
If you use a service like OpenAI, you pay for every API call. In our case, we use gpt-3.5-turbo, so cost is not a concern—even with a high volume of usage. However, if you use gpt-4, you want to be careful since it’s two orders of magnitude more expensive. You should work to use gpt-3.5 instead of gpt-4 in production if you can.
While OpenAI (and other vendors) does offer a usage dashboard, it’s not that helpful because it doesn’t show where the usage comes from. Do you have a handful of customers driving up your costs, or is it spread out evenly? Luckily, it’s easy to calculate and monitor when you capture two fields in telemetry:
- Total tokens used for each API call (inputs and outputs)
- Team/User/etc. IDs
Most observability platforms offer a way to compute a field based on the values of other fields. In Honeycomb, they’re called Derived Columns. You can create these fields based on input and output tokens, then visualize your cost and group by identifying information for your users.
It doesn’t take much effort!
You might be thinking, “Well of course an observability company has good observability for their feature, but what about me?” The good news is that all of the above is powered by a small amount of information:
- What inputs are people entering
- What outputs the LLM is producing
- Total tokens used for a given request
- All errors—not just if the LLM call failed, but if its result was invalid and caused an error when it passed to another component
- User/Team/etc. IDs
- Total input and output tokens used
- The feedback users give
- The prompt used when users interact with your feature. If it’s the same, then you can elide this
And that’s it! Not a ton of data. As you’ll see later, also not much effort to add via instrumentation. However, because observability tools let you arbitrarily combine information like this in interesting ways, you can learn an incredible amount about how your feature performs in the wild without much data.
You may need more data over time, but for now, this alone is enough to get you quite far.
To capture this information, you need to create telemetry (also called instrumentation) that captures this information. The standard way to do this is to use OpenTelemetry. OpenTelemetry is a vendor-neutral standard for creating telemetry with broad language SDK support, automatic instrumentation components, a variety of tools to help with deployment, and broad support for open source tools and vendors.
Finally, you want a tool to create and manage SLOs. Most observability products, like Honeycomb, offer this.
The baseline: tracing with OpenTelemetry
If you don’t have tracing instrumentation, now’s the time to get started. Traces are collections of spans. A span is like a structured log, except it has correlation between “logs” baked in, hierarchy, and a notion of duration (i.e., latency) built in automatically.
OpenTelemetry offers automatic instrumentation for several languages. Auto-instrumentation automatically creates traces for requests to your services and any services you call. If you’re using a language without automatic instrumentation, you can still use instrumentation libraries in your language to accomplish the same thing.
Then, you need to go into the code where you call your LLM (such as an OpenAI client call) and create a span that wraps the LLM call. This will come in handy for the next step.
For example, here’s how we do it in our own product, using Go:
func GenerateQueryFromPrompt(w http.ResponseWriter, r *http.Request) error {
    // “instr” is our wrapper around OpenTelemetry and an older
    // instrumentation system.
    ctx, span := instr.StartSpan(ctx, "GenerateQueryFromPrompt")
    defer span.End()

    team := getTeam(ctx)


    // . . . some code elided for brevity that fetches the prompt, team info,
    // user settings, logic to select columns in a schema, etc.

    // GenerateQuery uses the OpenAI Go client to call OpenAI’s API
    response, usage, err := GenerateQuery(ctx, userAndTeam, prompt, settings)
}And that’s it! Creating the span that tracks our LLM call is literally just one line of code. We use instrumentation libraries to instrument requests and responses.
Here’s what that looks like in the middle of one of our traces (several spans that track reading feature flag values are redacted):
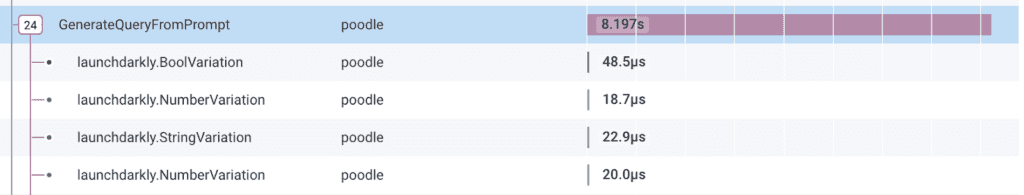
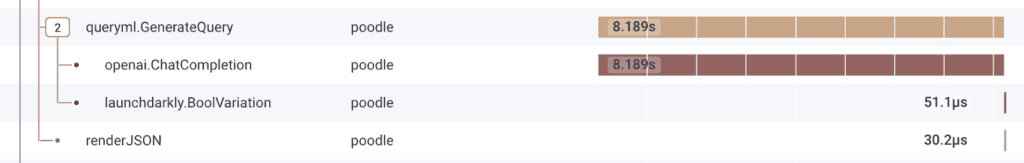
The primary span is “GenerateQueryFromPrompt,” and the two other notable spans it calls are “queryml.GenerateQuery,” which does some internal setup, and “openai.ChatCompletion,” which tracks the actual call to OpenAI.
If it doesn’t look like much, that’s by design. You don’t need a bunch of fancy instrumentation to get observability for LLMs.
Custom attributes
Custom attributes (or fields, as you might call them) are what gives you good observability. When you’re in code, it’s simple to add data as attributes to spans in OpenTelemetry.
Here’s some of our code where we add all the information I talked about in our application. These attributes are added to the “GenerateQueryFromPrompt” span shown earlier:
ctx, span := instr.StartSpan(ctx, "GenerateQueryFromPrompt")
defer span.End()

//...

span.SetAttributes(
    instr.AppString("nlq.user_input", requestPayload.UserInput),
    instr.AppInt("nlq.prompt_column_count", stats.ColumnsSelected),
    instr.AppFloat64("nlq.config.temp", float64(settings.Temp)),
    instr.AppFloat64("nlq.config.top_p", float64(settings.TopP)),
)

response, usage, err := GenerateQuery(ctx, userAndTeam, prompt, settings)
if err != nil {
    span.SetAttribute("error", err)
    return err
}

span.SetAttributes(
    instr.AppString("nlq.response", queryResponseString),
    instr.AppInt("nlq.total_tokens_used", usage.TotalTokens),
    instr.AppInt("nlq.input_tokens_used", usage.InputTokens),
    instr.AppInt("nlq.output_token_used", usage.OutputTokens),
)And that’s it! We capture dozens more pieces of data as custom attributes, but most are specific to settings that are controlled by feature flags, so they’re elided here.
Further on in our product, when we correct a response from Honeycomb, we capture custom attributes about what correction we applied. If the query fails to execute against our query engine, we also capture the error as a custom attribute.
Once you have these custom attributes, you can do everything mentioned above and more. It lets you query data arbitrarily and assemble views of your data on the fly without having to go back into your code and figure out what to log. Here’s an example of how you can assemble this information on the fly in a query:
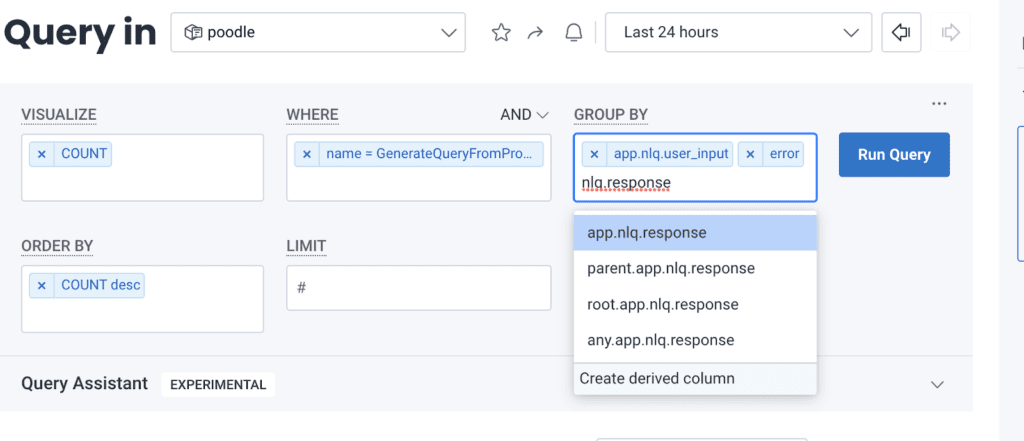
And when it runs, you can see values grouped as they’re queried:
Service level objectives to track what matters
Finally, when you have good instrumentation in place with OpenTelemetry, you can also establish good SLOs.
Most uses for SLOs fall into two categories: latency and error rates. You can get as sophisticated as you want with SLOs, but it’s good to start here.
An SLO that tracks end user latency
When calling a third-party service like OpenAI, you can’t control all aspects of latency. But you can establish what acceptable latency looks like for most users and monitor when it gets worse.
Latency for an LLM is typically dominated by how much output it has to produce. It’s often the case that worse latency can be fixed through prompt engineering and guaranteeing that outputs don’t get larger than a certain size. This is a useful input to the process for picking the right threshold for latency.
I’d recommend the following properties in a latency SLO:
- Requests are less than your acceptable threshold
- 95% of requests should be under this threshold
- Time period for measurement should be seven days
- Alert as a slack message four hours before the budget elapses
Critically, don’t alert someone with PagerDuty or other alerting tools. As of this writing, LLM providers are scrambling to add more capacity and you can experience greater latency through no fault of your own. Don’t let that be a reason why someone gets woken up in the middle of the night.
An SLO that tracks end user errors
Just like the example earlier, an SLO that tracks end user errors is critical. If people can’t get a result out of your feature, they won’t use it.
It’s important that you capture as many possible errors as you can. Don’t just track when the call to OpenAI fails. If you need to parse its results, capture parse errors. If you need to validate after parsing, capture validation errors. Capture it all! This is what lets you fix stuff down the road. Without a lot of different possible errors, you can’t know what’s actually happening in production.
I’d recommend the following properties in an error SLO:
- Requests are less than your acceptable threshold
- Start with 50% or higher as your success rate, but don’t go higher than 90%
- Time period for measurement should be seven days
- Alert as a slack message four hours before the budget elapses
And extra critically, don’t alert someone with PagerDuty or other alerting tools. LLMs are black boxes! You can have a rogue user who intentionally tries to get your feature to mess up through prompt injection. Maybe you can ban them later, but don’t let their nonsense cause someone to get woken up in the middle of the night.
Observability is essential to improve products that use LLMs
If you’re still reading, hopefully you’re convinced that you need observability if you’re building product features with LLMs. I’ll reiterate: LLMs are nondeterministic black boxes that people use in ways you cannot hope to predict up front. Unless you’re into the idea of guessing how to improve your feature, you need to instrument it and use an observability tool to see how it behaves in the real world.
Need in an observability 101 primer? Check out our short video series on the topic. You can also read up in our docs, or explore a live application in a guided tour in our Sandbox (no account required).
Interested in observing your app that uses LLMs? Sign up here—it’s free.
Finally, if you’re interested in observability for LLMs more generally, we’d love to talk to you! We’ve heard from folks that there’s a need, and we want to learn more about the problems you have with LLMs in production.
Want to know more?
Talk to our team to arrange a custom demo or for help finding the right plan.