Measuring Claude Code ROI and Adoption in Honeycomb
Claude Code supports OpenTelemetry out of the box, which means sending telemetry to Honeycomb takes just a few minutes of configuration. In this post, I’ll walk you through exactly how I set this up for one of our monorepos and the insights we gained.

By: Mae Capozzi
Honeycomb MCP: AI Meets Observability
In this quick demo, Michael Sickles shows you how to connect the Honeycomb MCP server to multiple AI environments, including Claude desktop.
Watch Now
At Honeycomb, we’ve been using Claude Code across our engineering team for a while. Anecdotally, I had a sense of who the power users were, and I had seen some examples of complex usage. But I wanted to be able to confidently answer questions, like:
- Were engineers regularly using it to develop in one of our repos?
- Was adoption growing?
- How much were we spending?
- What models were we using?
- Did developers often accept Claude’s suggestions?
Claude Code supports OpenTelemetry out of the box, which means sending telemetry to Honeycomb takes just a few minutes of configuration. In this post, I’ll walk you through exactly how I set this up for one of our monorepos and the insights we gained.
Configuring Claude Code to send telemetry to Honeycomb
Claude Code uses OpenTelemetry for both metrics and logs, so you’ll need to configure both exporters to get the complete picture. For this example, the configuration lives in .claude/settings.json in your project directory, but Claude Code offers multiple options for where settings can live.
Important note: This configuration is project-specific. It will only capture telemetry for Claude Code usage within this particular repository. If you want to monitor usage across multiple repositories, you'll need to add this configuration to each repo’s .claude/settings.json.
For our setup, I configured it at the project level in our main monorepo since that’s where much of our engineering work happens.
Here’s the configuration I used:
{
  "env": {
    "CLAUDE_CODE_ENABLE_TELEMETRY": "1",
    "OTEL_METRICS_EXPORTER": "otlp",
    "OTEL_LOGS_EXPORTER": "otlp",
    "OTEL_EXPORTER_OTLP_PROTOCOL": "grpc",
    "OTEL_METRIC_EXPORT_INTERVAL": "10000",
    "OTEL_LOGS_EXPORT_INTERVAL": "5000",
    "OTEL_EXPORTER_OTLP_ENDPOINT": "https://api.honeycomb.io:443",
    "OTEL_EXPORTER_OTLP_HEADERS": "x-honeycomb-dataset=claude,x-honeycomb-team=YOUR_API_KEY",
    "OTEL_SERVICE_NAME": "claude-code",
    "OTEL_RESOURCE_ATTRIBUTES": "service.name=claude-code"
  }
}You can review your configuration options in more detail in Claude Code’s docs.
Let me break down what each setting does:
CLAUDE_CODE_ENABLE_TELEMETRY: Turns on telemetry collection (required)OTEL_METRICS_EXPORTERandOTEL_LOGS_EXPORTER: Both set tootlpto send data to HoneycombOTEL_EXPORTER_OTLP_PROTOCOL: Usinggrpcfor efficient data transferOTEL_METRIC_EXPORT_INTERVALandOTEL_LOGS_EXPORT_INTERVAL: I set these to 10s and 5s respectively (faster than the defaults) so I could quickly verify data was flowing during setupOTEL_EXPORTER_OTLP_ENDPOINT: Honeycomb’s OTLP endpointOTEL_EXPORTER_OTLP_HEADERS: This is where you specify your Honeycomb API key and dataset nameOTEL_SERVICE_NAMEandOTEL_RESOURCE_ATTRIBUTES: Ensures events are tagged with the service name “claude-code”
Important: Replace YOUR_API_KEY with your actual Honeycomb API key. You can use an ingest key with create datasets turned off. You can find this in your Honeycomb account settings.
Once you’ve added this configuration, restart Claude Code, start a new session, and begin conversing with Claude again. Data should start flowing into Honeycomb.
The second edition is here!
Grab your free copy of Observability Engineering
and learn the foundationals of observability
from the experts.
Verifying data is flowing
Before building a comprehensive dashboard, I wanted to confirm that data was actually arriving in Honeycomb. I ran a simple query to see what event types were coming through:
COUNT | GROUP BY event.name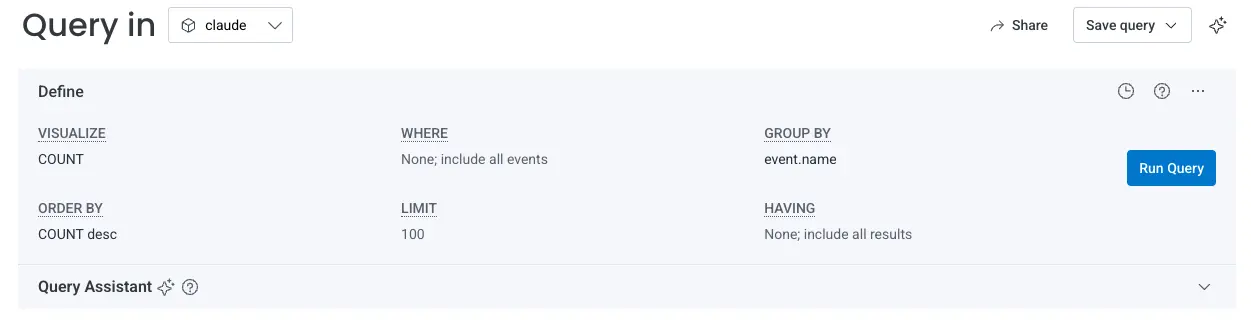
Within seconds, I saw data populating across multiple event types:
api_request: API calls to Claude with token usage and coststool_result: Tool executions (Read, Edit, Bash, Grep, etc.)api_error: API failures with error detailstool_decision: User decisions to approve or reject tool executionsuser_prompt: User messages to Claude (redacted by default)
This gave me confidence that both logs and metrics were being ingested properly.
Asking the right questions
Now came the fun part: figuring out what questions I actually wanted to answer. I started thinking about what would help us understand ROI and usage patterns:
Adoption and engagement:
- How many engineers are actively using Claude Code?
- How many sessions are running per day?
- Is usage growing over time?
Cost management:
- What’s our total spend per user?
- Which models are most expensive?
- Are we effectively using prompt caching to save costs?
Developer experience:
- Which tools do engineers use most?
- Are any tools consistently failing?
- What's the latency of API requests?
- Do users frequently reject tool executions? (Could indicate trust issues)
Performance and reliability:
- Are we hitting rate limits?
- What types of errors are we seeing?
- Which tools are slowest?
Rather than manually building 15+ queries one by one, I used Honeycomb's MCP server to let Claude Code itself create the board.
Setting up the Honeycomb MCP server
Before Claude Code could help me build the monitoring board, I needed to connect the Honeycomb MCP server. MCP (Model Context Protocol) is a standard that lets AI assistants interact directly with external tools—in this case giving Claude Code the ability to query data, create boards, and manage Honeycomb resources.
Important note: You must have access to Honeycomb Intelligence to use the MCP server.
You can configure the Honeycomb MCP server from the command line:
claude mcp add honeycomb --transport http https://mcp.honeycomb.io/mcpRestart Claude Code
Once you’ve added the configuration, restart Claude Code. You should see a message indicating that the Honeycomb MCP server is connected.
Now, Claude Code has direct access to your Honeycomb environment and can run queries, create boards, search for columns, fetch traces, and more—all through natural language requests.
Using Honeycomb's MCP server to build the board
If you recall from earlier, I had a list of questions I wanted to answer with a Honeycomb board. With the MCP server connected, I asked it to create a board for me to answer those questions.
I want to track Claude Code adoption and ROI. Please use the Honeycomb MCP server to create a board that answers the following questions:
Adoption and engagement:
- How many engineers are actively using Claude Code?
- How many sessions are running per day?
- Is usage growing over time?
Cost management:
- What’s our total spend per user?
- Which models are most expensive?
- Are we effectively using prompt caching to save costs?
Developer experience:
- Which tools do engineers use most?
- Are any tools consistently failing?
- What’s the latency of API requests?
- Do users frequently reject tool executions? (Could indicate trust issues)
Performance and reliability:
- Are we hitting rate limits?
- What types of errors are we seeing?
- Which tools are slowest?
Claude Code used the MCP server to quickly create the board, fully configured and ready to use. I spent some time verifying that the queries were correct and tweaking the time ranges until I was satisfied.
Use board templates instead
If you’re less interested in creating your own custom queries and you’d like a more out-of-the-box approach, you can use our pre-built board templates instead.
First, select the environment that you sent the data to. Then, navigate to the Boards page in Honeycomb, and select the Templates tab. Look for these two board templates:
- Claude Code - ROI & Cost Monitoring
- Claude Code - Usage & Performance
Select the board you want to create, make sure data is flowing through correctly, and click the “Use Template” button.
Key fields to know
As you build your own queries, here are the most useful fields to filter and group by:
Identity and session fields:
user.account_uuid: Unique user identifiersession.id: Individual Claude Code sessionterminal.type: VSCode, Cursor, iTerm, etc.
Cost and usage fields:
claude_code.cost.usage: Cost per Claude Code sessioninput_tokens,output_tokens: Token consumptioncache_read_tokens,cache_creation_tokens: Cache effectivenessmodel: Which Claude model was used
Tool fields:
tool_name: Read, Edit, Write, Bash, Grep, etc.success: true/falseduration_ms: Execution timedecision: “accept” or “reject”
Event types:
event.name: Filter byapi_request,tool_result,api_error,tool_decision, oruser_prompt
Conclusion
I hope this blog inspires you to measure Claude Code adoption at your organization. Want to try this yourself? Check out Claude Code's monitoring documentation for complete telemetry configuration options, Honeycomb's MCP server documentation for MCP setup details, and sign up for a free Honeycomb account to get started.