A New Approach to Metrics
Today at o11ycon+hnycon—right now, actually, if you’re reading this blog when it was posted—we’re announcing several new Honeycomb features during the keynote. Our industry and community have come a long way since we burst…

By: Christine Yen
Today at o11ycon+hnycon—right now, actually, if you’re reading this blog when it was posted—we’re announcing several new Honeycomb features during the keynote. Our industry and community have come a long way since we burst onto the scene, and I’m delighted to give you another version of Honeycomb that continues to demonstrate what’s possible with observability.
And it includes metrics.
A long-awaited API and redesigned Query Builder
First, we’re rounding out our APIs with a new Query Data API. The Query Data API lets you create and run Honeycomb queries programmatically, and returns the results so you can integrate that data into your workflows any way you see fit. Rather than being limited to just the Honeycomb UI, you can now get query results anywhere you need them.
A common use case for functionality like this is to visualize data from Honeycomb in other tools. A new and exciting use case we’ve seen is customers using Honeycomb query data to make automatic decisions in their deployment pipelines—e.g., “Is this canary deployment going well? If so, continue rolling out that feature to more users.” We can’t wait to see what other things you’ll build with it.
We also completely redesigned Honeycomb’s Query Builder, the core of your experience with Honeycomb. You can now ask questions faster than ever, and slice and dice your data in more ways to also get answers faster. The Query Builder now helps you auto-complete field values by showing you data recently sent to the specific column you’re querying. You can use that new functionality to do things like quickly see—as you are building your query—whether a field name that was being used a year ago still has the answers you’re looking for. Guess less. Know more.
You’ll also see a few new ways to sift through your data. Time comparisons let you compare query results over two time ranges. For example, as you query your data, you might see a spike in latency. But is that spike normal? With time comparisons, you can quickly compare traffic patterns to that same time period day over day, or week over week. You can easily see if that’s a known pattern of behavior or an isolated incident to further investigate.
You’ll find a slew of other enhancements, like a new HAVING clause that lets you filter down noise and refine the visualizations you need. There are keyboard shortcuts to toggle display of markers, or build and execute queries without using a mouse. You can even take the name and value pills used to generate your queries and rearrange them to modify your queries and resulting charts on-the-fly.
This set of improvements is all about giving you more flexibility in how you ask questions and get answers with Honeycomb. We’re also taking more steps to help you fit Honeycomb to more needs in your team’s workflow. And that brings us to today’s other big announcement: Honeycomb Metrics.
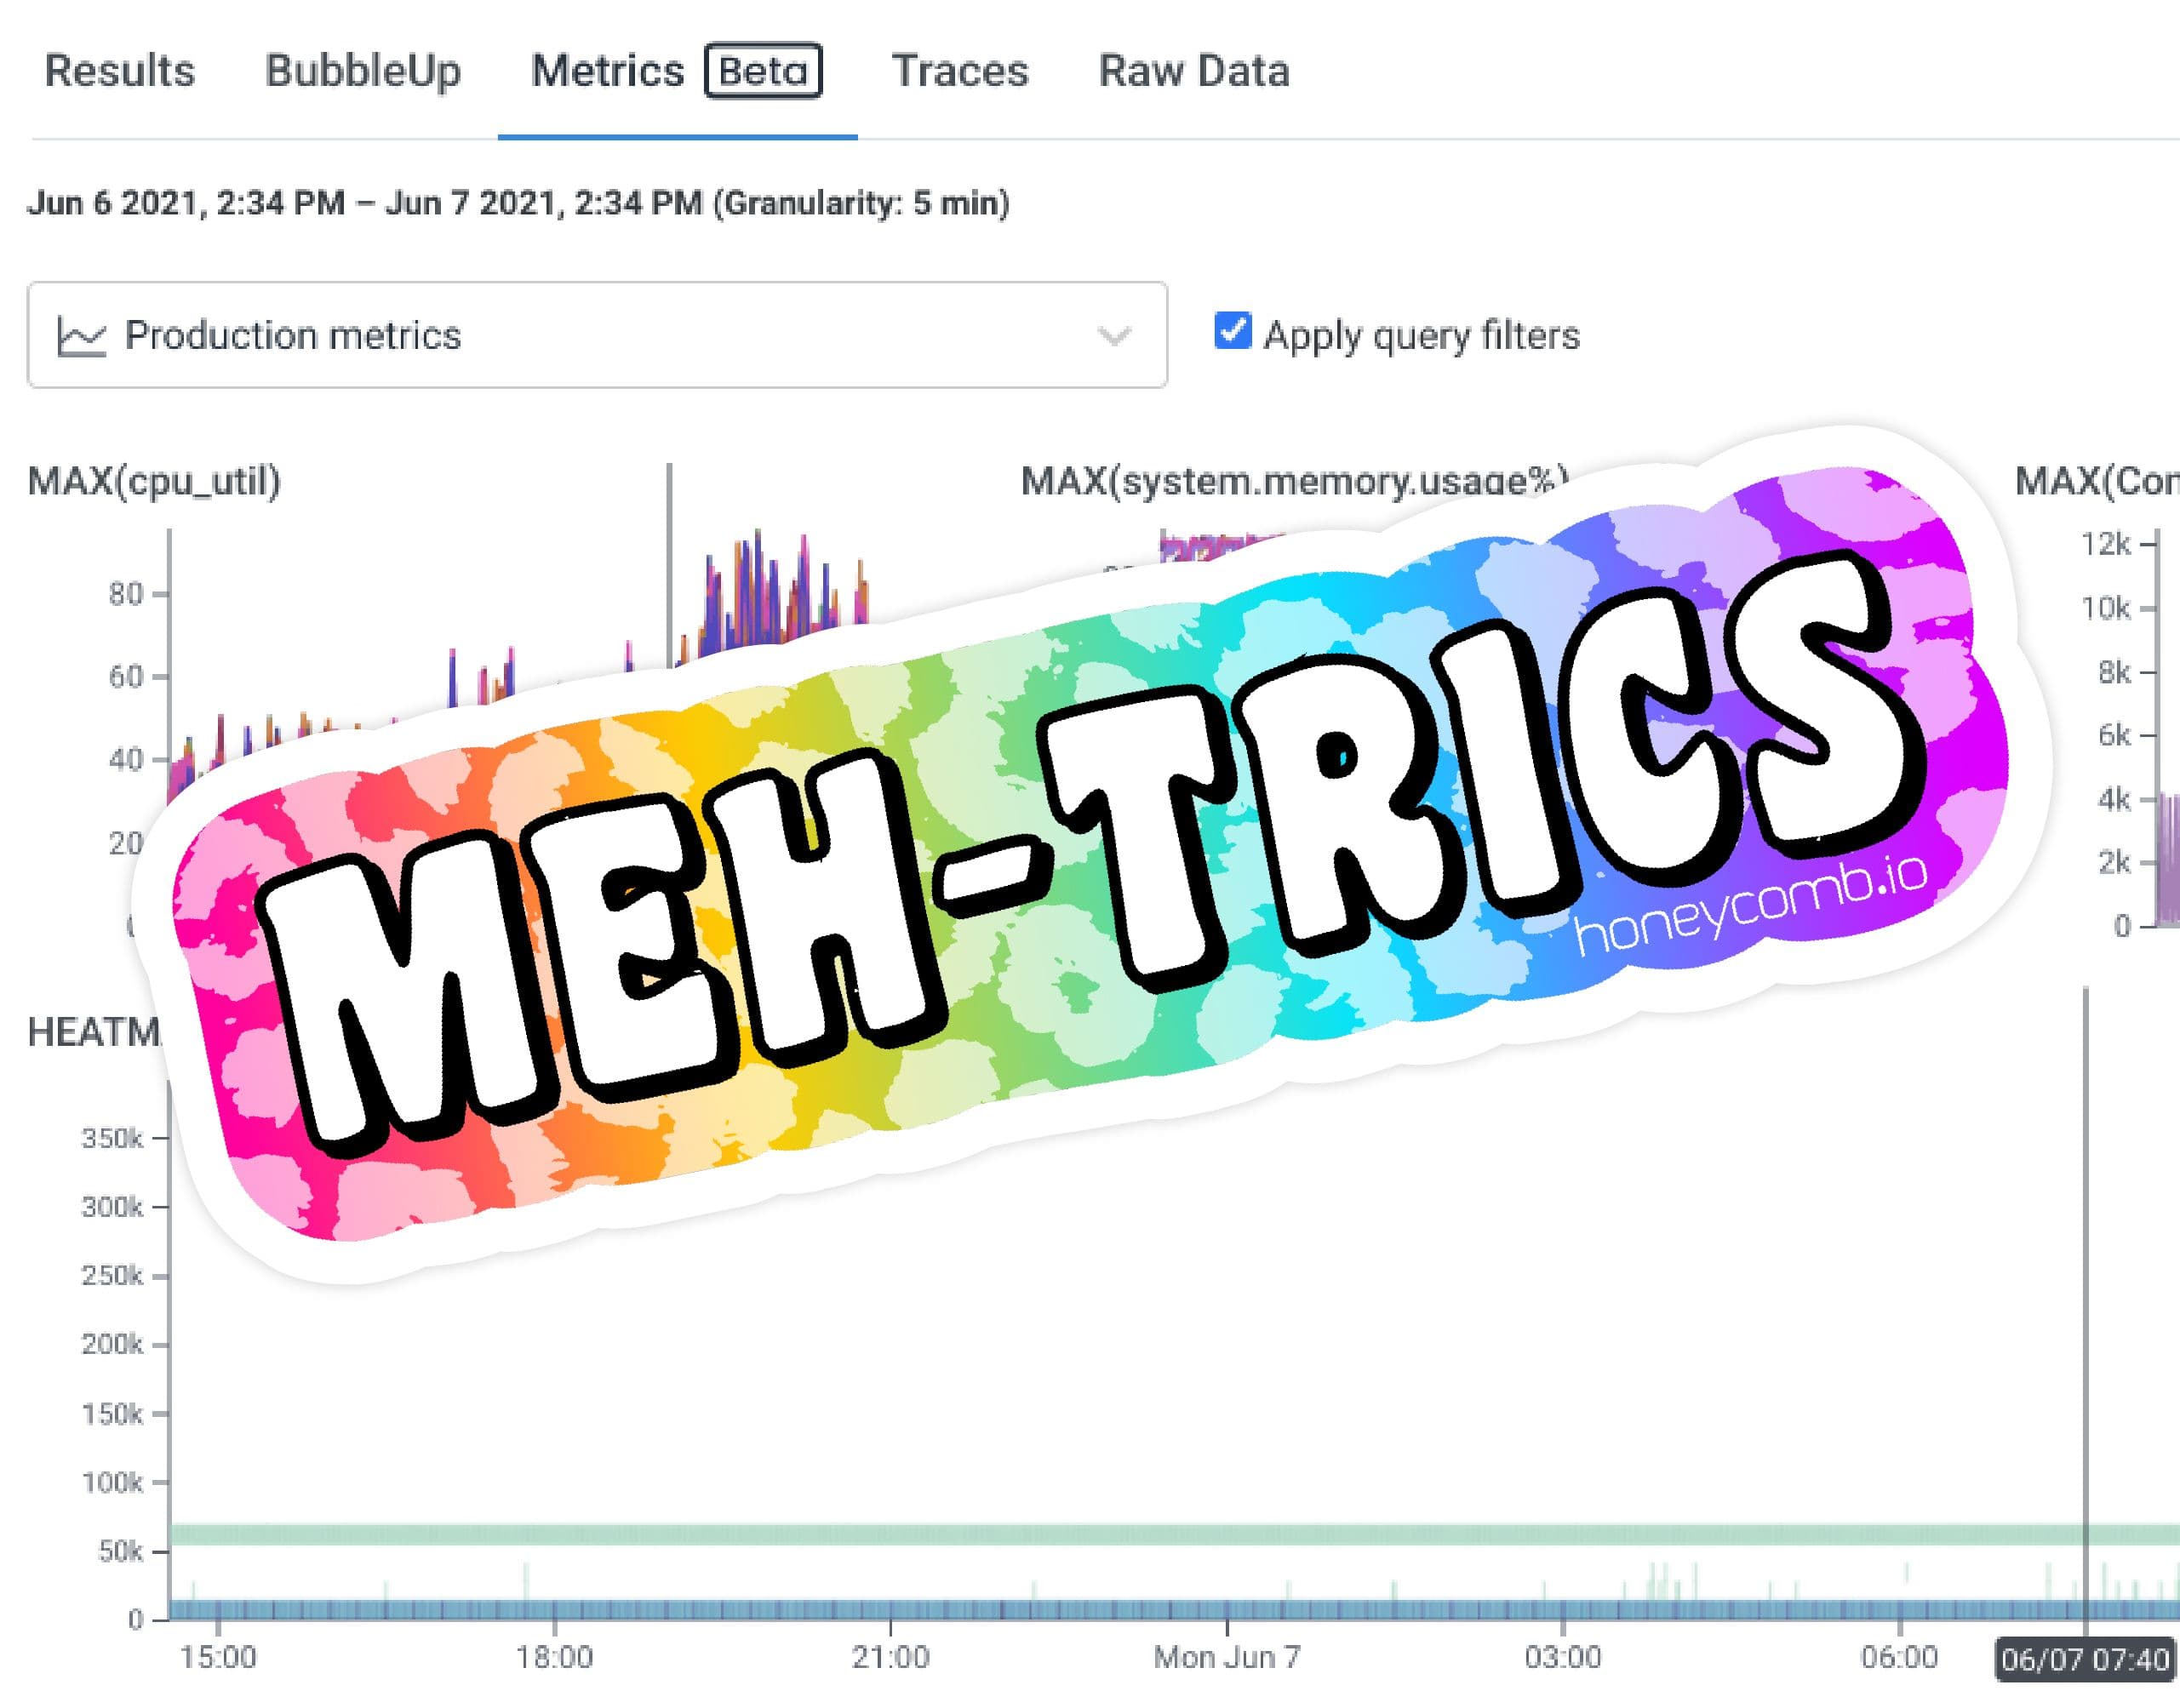
Meh-trics
Starting today in open beta, we’re announcing support for receiving metrics data directly in Honeycomb. Does that mean we’re no longer meh on metrics?
Far from it. Yes, metrics are cheap and efficient aggregate measures used to store information about infrastructure health, counters, and overall system health. However, those aggregate measures always have been, and continue to be, too coarse to understand how individual requests behave in your system. Time series data bundles everything about system state over a given period of time into one number—and that number can’t be decomposed back into its individual event parts after it has been recorded.

When Honeycomb was born, metrics were the de facto method used to debug in production. When the only tool you have is a metric, every problem looks like a new time series. That’s why three important dashboards suddenly balloon into thirty. That convention is why teams have learned to live with a “meh” solution—and still rely on brittle runbooks to identify and resolve new issues.
Through Honeycomb and observability, we forged a new path where events were dominant: a granular measure that let you understand how individual user requests flowed through your system. And we built the practice of observability around that event-based world.
But not everything has to be instrumented events. In fact, sometimes you simply can’t add instrumentation to legacy systems. Or even if you could, you don’t need an individual-request level of granularity to understand aggregate measures like CPU consumption or concurrent threads in your runtime. For a majority of use cases, it makes sense to use events for understanding the code you write and use metrics for understanding constraints that impact how your code runs.
In other words, observability for your code and metrics for your systems. And by “systems,” we mean your infrastructure, or your runtime, or counters that help you see when you’re about to slam up against an operating constraint. At the end of the day, what matters to your business is how the applications you wrote perform in the hands of your customers. The only reason your business is concerned about those underlying systems is because they could negatively impact application performance.
For example, you want to know if CPU is pegged on a virtual instance with a noisy neighbor because that tells you the latency you’re seeing isn’t an issue inside your code. Or if you see that physical memory is close to being exhausted across your entire fleet, that tells you there’s an impending disaster that probably originated from your code. Correlating system constraints with application performance matters, but system performance matters mostly as a warning signal or a way to rule out code-based issues.
In the role of a warning signal, aggregate measures like metrics work just fine. But they aren’t, and never have been, a good way to understand how the code you wrote behaves in the hands of individual users. For that job, they’re still very meh.
Why we built metrics into Honeycomb now
Times are different now than when Honeycomb was born. The practice of instrumenting events for debugging is well established. We don’t need to explain the definition of observability before showing people its value. As an industry, we’ve adopted distributed tracing and structured logs. And you could always get metrics into Honeycomb, but with workarounds that folded them into your events.
But what that strictly event-based model effectively meant is that for many of our customers, getting metrics into Honeycomb was simply too big a lift. They’d keep minimally used metrics tools around and, whenever production issues occurred, they would have to context-switch between Honeycomb and that other tool to rule out (or confirm) infrastructure issues.
The promise of observability is that you don’t need to use separate tools with separate data sources and cobble pieces of information together in your brain to solve complex mysteries. The debugging data you need should be in one place, where you can slice it and dice it any way you see fit, to quickly ask any questions you need, and to get fast answers.
And that means making room for metrics. We’ve built metrics support so that it doesn’t pull users back to the old days of using them to solve every problem. Rather, they’re available to help supplement the event-based debugging that’s at the very heart of observability. We’ve created room for metrics to shine in their own meh little way.
Try it for yourself
We think you’re going to get a lot out of the new experience we’ve built for you at Honeycomb. Everything I’ve written about in this post, and talked about in our conference keynote, is starting today.
The new Query Builder is now generally available to all Honeycomb users.
The Query Data API and Honeycomb Metrics are both in open beta for Enterprise customers. That means anyone with a Honeycomb Enterprise account should be able to use both, right away, with no special setup needed.
If you’re not already an enterprise customer, you can try it for yourself by signing up for a free Enterprise trial account.
Want to know more?
Talk to our team to arrange a custom demo or for help finding the right plan.