You Don't Need Three Pillars, You Need Single Threads
One of the customers I’m currently working with is a large financial institution that has a robust three pillar implementation. Every critical application ships their telemetry to either or both their cloud-native tool and a central tool. This worked fine when they had relatively monolithic applications, but with their architecture moving towards a service-based one, it’s getting harder to manage.


Scary Things Happen in Production. Context Helps You Find Them.
Your data doesn’t become linearly more powerful as you add more context, it becomes exponentially, combinatorially more powerful with each added attribute.
Read Now
Last week was a great reminder for me about the challenges of the traditional model of observability defined by the “three pillars” of metrics, logs, and traces.
One of the customers I’m currently working with is a large financial institution that has a robust three pillar implementation. Every critical application ships their telemetry to either or both their cloud-native tool and a central tool.
This worked fine when they had relatively monolithic applications, but with their architecture moving towards a service-based one, it’s getting harder to manage.
Last week was a bit rough for them, with three separate, unrelated incidents ranging from relatively small to absolutely massive. Each of those outages had a particular lesson to learn about the challenges of the traditional three pillars model and what makes the combination of OpenTelemetry and Honeycomb so powerful.
Lesson 1: Application telemetry (like uptime) tells you nothing about customer impact
The first lesson came from the major incident. While making some changes, one of the main load balancers for a busy region became unavailable, leading to all requests being dropped. And while their traditional tools did alert them, trying to figure out what the impact was for their customers was impossible to do until after the incident, because while they knew which services/applications were affected, it wasn’t immediately clear what services used which other services that might have been affected.
Read our O’Reilly book, Observability Engineering
Get your free copy and learn the foundations of observability,
right from the experts.
Because the impact was so large, the potential cause was immediately obvious, along with the fact that it was a major incident. But had it been just one application or one endpoint that stopped working, it would have been much harder to detect and diagnose.
A great example of that happened to me at Honeycomb. Early in their afternoon, two users from Japan mentioned that the Honeycomb UI was so slow it was barely usable. So, I had to quickly figure out if this was an issue on our side and if it was going to affect all of our European users about to start work, or if it was an issue on their side. By looking at the browser traces, I saw very slow outliers indeed—but they were all from users at the same company, and users at other companies were fine. It turned out to be a configuration issue with their VPN provider.
Lesson 2: The devil is in the interactions
As is typical in organizations this size, they have a lot of different services that all need to talk to each other to get something done. And sometimes it is in those interactions that things fail without there being one system at fault.
In this case, when the amount of file downloads crossed a particular threshold, the entire system failed catastrophically. A grand combination of unbounded queues, a lack of timeouts and two thread pools that could deadlock, meant that the system could become unstable for hours at a time after a spike in download requests.
And after a large email campaign to promote the file download capability, that is exactly what happened. Of course.
But from the perspective of each individual team, their application was doing fine and the problems were elsewhere. The requests from the first service could arrive at the second service delayed by 20-30 minutes, which meant the authentication token had expired. And the deadlock looked exactly like the backend service being unavailable. And so no application alerted when this happened, because they all assumed that another part of the call chain was at fault and they would be alerted.
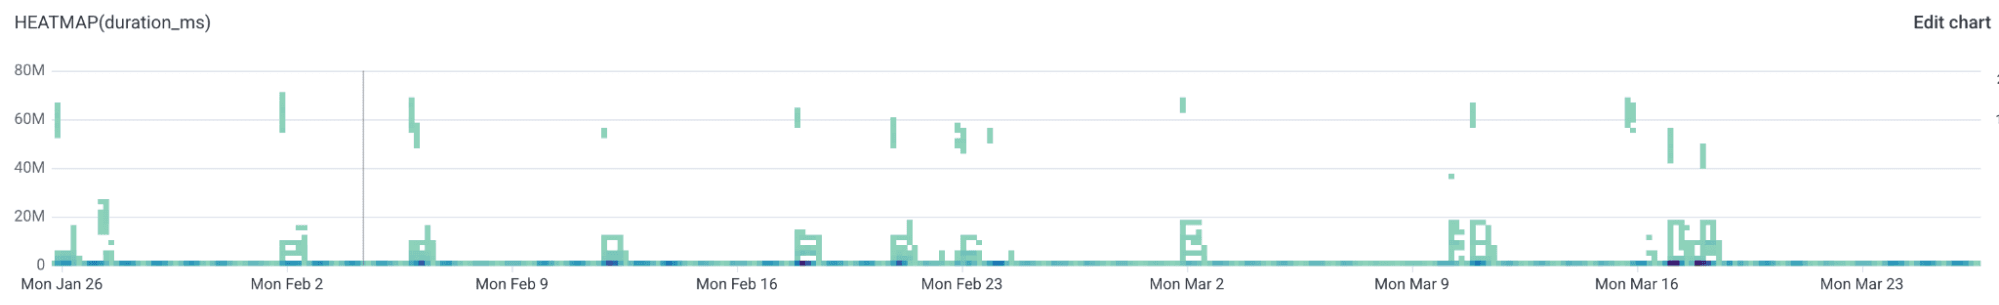
As you can see on this graph, this has been happening one or twice a week for a while.
It wasn’t until we implemented a customer-facing SLO for file downloads that the scale of the problem became clear. SLOs are most powerful when they are used like this, to measure how you delivered on your customer’s expectation. All the application-focused alerts missed this because it did not look like that application was the problem.
Lesson 3: Green across the board doesn’t mean everything is ok
The smallest incident was another one that had to do with file downloads. With every file download, some additional information was to be returned with the file and displayed to the customer. But in one of the services involved with the file download, a service-wide change was made that had the side effect of not successfully retrieving the additional information. Since the main task (retrieving the file) worked fine, this didn’t end up returning a 500 to the caller. They returned the file and omitted the additional information.
This went unnoticed until someone investigated the previous issue. When looking at multiple traces, they noticed that these secondary calls to the backend were failing.
What are single threads?
Useful single threads are clear end-to-end traces that show a customer request and trace it through all of the services. These are the threads that you want to see, single customer requests going through all the different services.
It’s on those threads that we can build SLOs that measure the customer experience—not from the point of view of a single application, but from the point of view of your actual customers. My colleague Nick Travaglini said it best: “Traditional observability can tell you if your servers are happy. Modern observability will tell you if your customers are happy”
Once you have these single threads, you can start adding a lot more context to them, especially context that is relevant to your business. Which customer, what type of customer, what are they trying to achieve, on what resources?
One of Charity’s recent blog posts, Data is made powerful by context, is (unsurprisingly) quite on point.
We’ve started creating these single threads with this customer by implementing OpenTelemetry not just across network boundaries between client devices, cloud platforms, and on-prem mainframes, but also across organizational boundaries between teams and even business units. We then take these single threads, align them with customer intent, and create SLOs in Honeycomb.
This has allowed this customer (and many others) to find and diagnose problems that they previously weren’t even aware of, allowing them to create a better experience for their customers. And better context doesn’t just make things easier for the humans. For the second issue, Canvas, our built-in AI assistant, found the root cause of the issue—threads getting into a deadlock—in just two prompts.But don’t just look at your telemetry once you’re alerted and things are on fire. Look at them after every deployment. That third minor incident should have been caught a few minutes or hours, at most, after the bad deployment.
The big trap to avoid
A warning: there’s a trap when creating customer-centric SLOs that I see some customers fall into. They use them to beat the software development teams over the head with, especially the first team in the chain.
It’s very easy to get into an adversarial relationship between business and software teams about why performance and reliability is less than expected. But the question of who is (most) responsible for the current state of the service is entirely useless and self-defeating. The only thing worth considering is how we improve it.
Performance and reliability are a shared responsibility between not just software teams, but also with product and business stakeholders. Software developers may not have created software that was as performant or reliable as we had hoped, but they also almost certainly didn’t get enough time to actually make sure things were performant and reliable enough. That’s what’s so powerful about these sorts of SLOs: you can use them to determine if you need to spend more time and effort improving performance and reliability, or if you’re good to focus on building new features.
How to get started
How can you create more customer-focused SLOs?
Generate the right kind of telemetry, of course.
Obviously, end-to-end traces with something like OpenTelemetry is ideal, but even if you can’t do that (yet), there’s a lot you can do. For instance, generate one wide log as close to the customer as you can with all of the relevant context from the request and the response and create metrics from it.
But just focusing on the technical aspects won’t be enough. You’ll want to involve your product and business stakeholders. They’re often the ones to decide what level of performance and reliability is acceptable, and they’re the ones who decide what the focus for the development teams is going to be. And so, they’re an important user of these SLOs.
Even though the logs or spans that those SLOs or metrics are based on might come from the service closest to the customers, don’t put them on their boards. These are for all of the services that cover those particular customer requests and should be treated as such.
Context is king
To sum up everything, context is king.
If you can trace a single customer request through your services from the first service that accepts the request to the database calls that perform the function, you have what I call the threads, or the walking skeleton of your telemetry that you can then use to enrich with any other relevant context you can find.
Context is what makes your data powerful. Every little bit you can add, within the telemetry framework you now have and what it allows you to do, will likely pay off in unknown and unknowable ways for your future self.