Observability with AI? Honeycomb with AI!
Honeycomb exists to help people understand custom software. It doesn’t pretend to know what matters in your application. That’s an interpretive task, not programmatic.

Honeycomb Intelligence: How to Use Canvas
In this quick minute and a half video, Michael Sickles shows how Honeycomb Canvas works and how you can use it to speed up your investigations.
Watch Now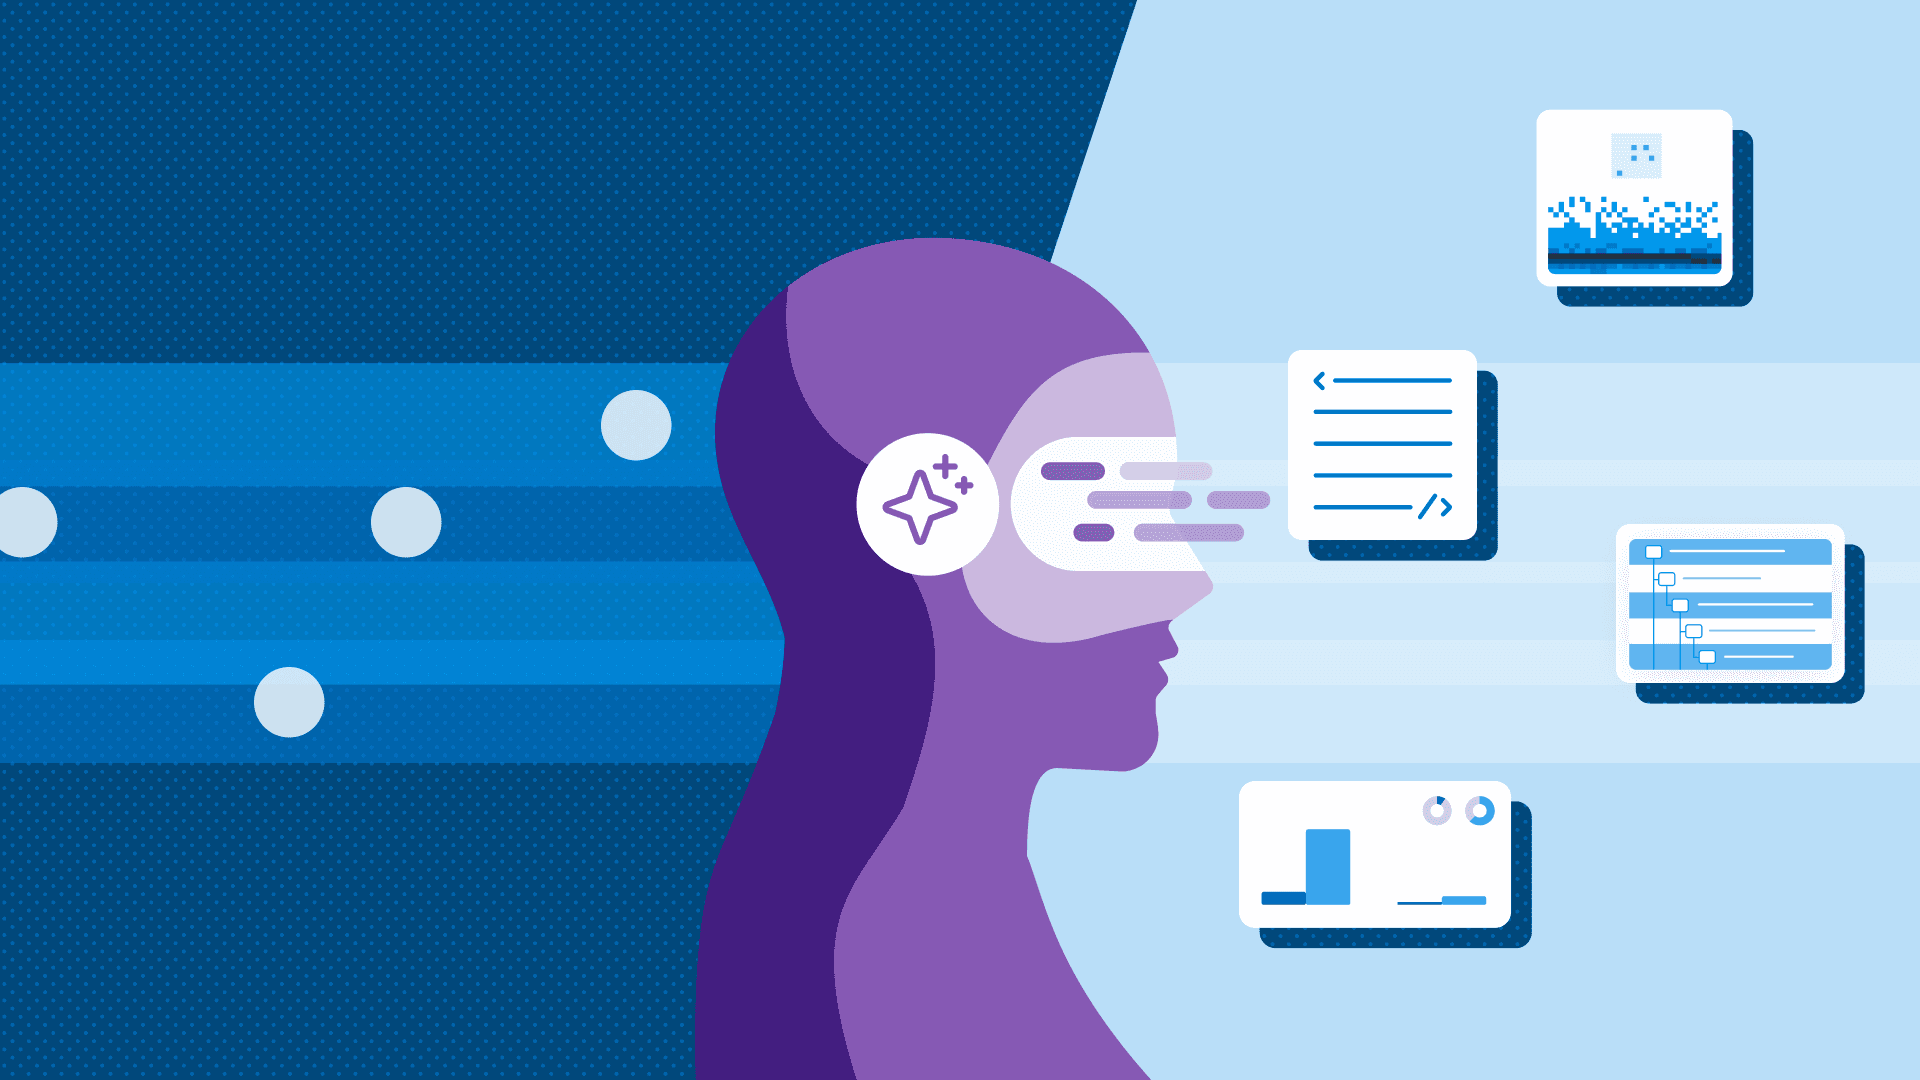
Since Honeycomb started, it has had a weakness: too many choices. Every field, custom or standard, hundreds of them, all are free to group, filter, and visualize in dozens of ways. Which ones are interesting?
Honeycomb exists to help people understand custom software. It doesn’t pretend to know what matters in your application. That’s an interpretive task, not programmatic.
Hey, computers can do interpretation now!
If I want to know what’s going on in my application right now, I don’t have to look at a dashboard. I can ask Canvas, Honeycomb’s built-in agent. It runs all the queries and shows me the results while narrating what it’s doing and what it found. I ask, “How is my app responding right now?” then see Canvas look at errors, request counts, and durations until it finds something interesting.
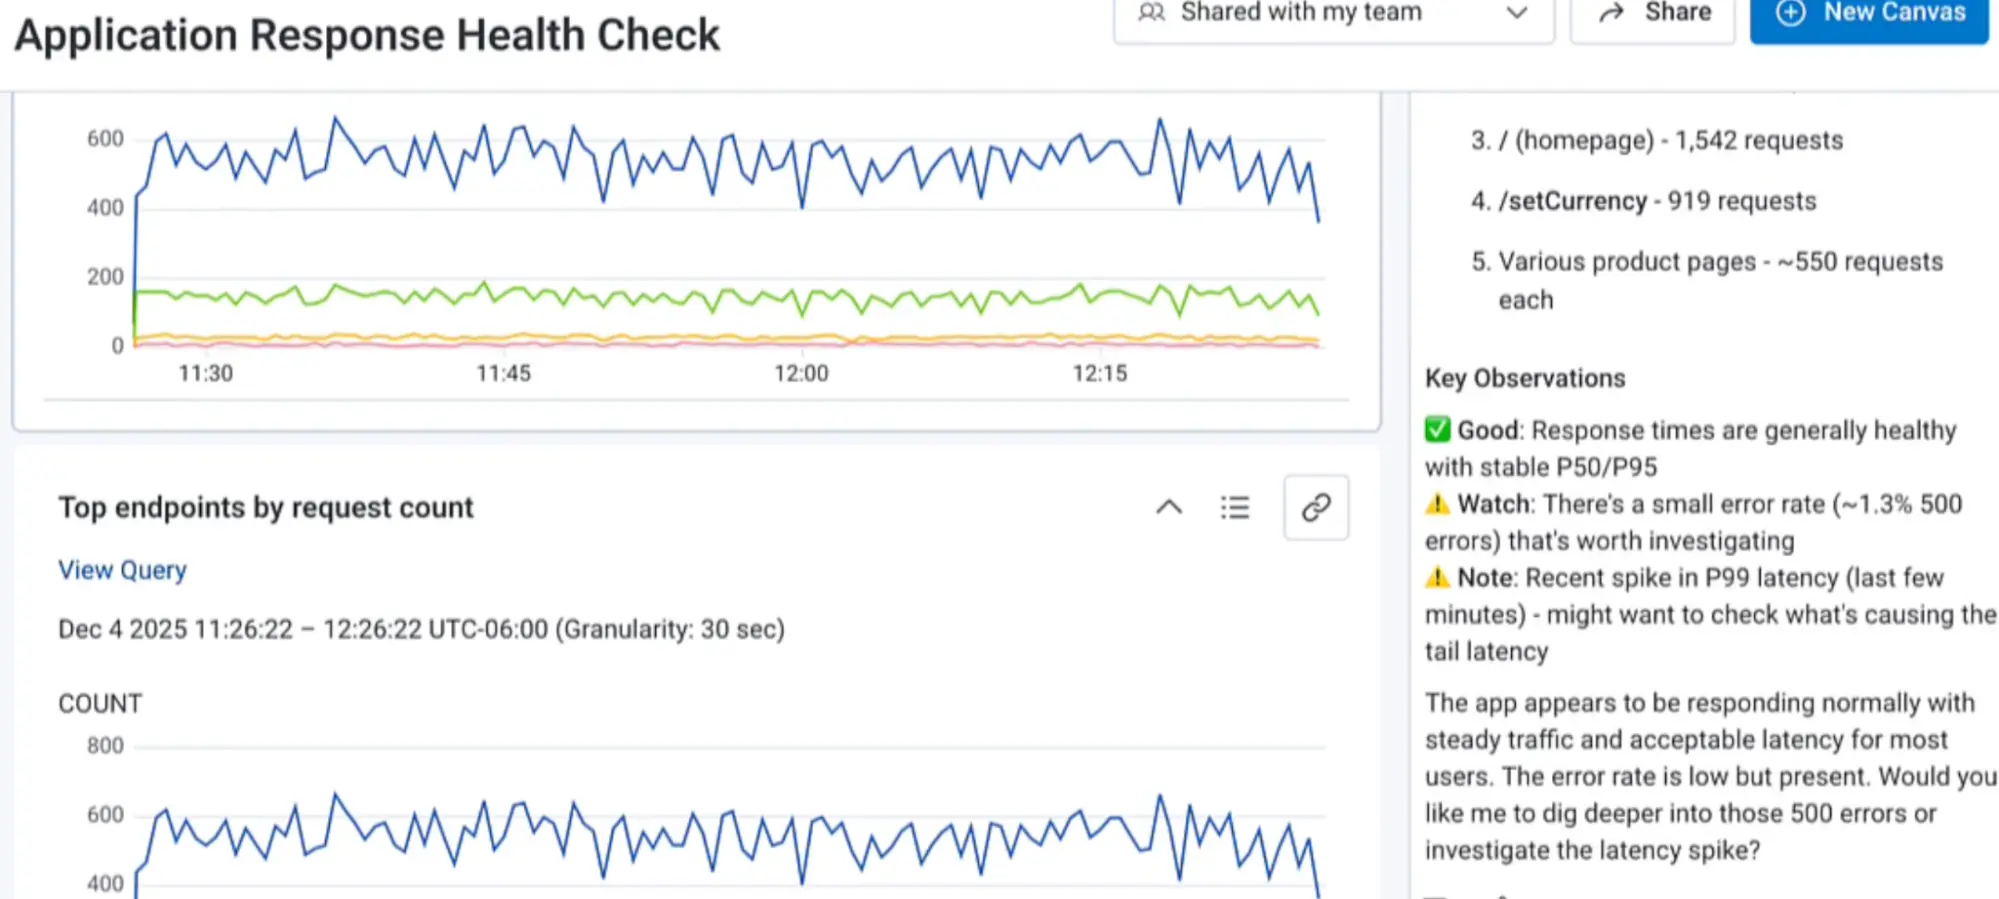
These are all high-level measurements that any tool will give you quickly. One magic of Honeycomb is that every measurement is fast: I can get every request duration by User ID in a problem location, or error rate by endpoint and user agent, or token use by prompt.
As a person, I can run like six queries a minute. An AI agent can run dozens! I ask it, “Look into that latency spike you found,” and it starts narrowing down the problem.
Honeycomb serves measurements by deep fields like User ID and prompt because it is calculating them from structured logs and trace spans. After the agent narrows down the latency spike to only /checkout requests, it drills into specific traces to find the cause. It finds that the getDiscount function got slow.
You need more than data
Observability data can only get you so far. Each span in the distributed trace represents some code executing; I need to combine this knowledge of what’s happening in production with the code that’s running there. My coding agent can do this when I hook up the Honeycomb MCP.
The MCP lets the agent run queries in Honeycomb, view traces, and search for the right columns.
When I ask Copilot, “Can you see the problem with checkout latency in Honeycomb?” it looks around in Honeycomb until it finds that same latency spike. It fetches a trace and finds the same source of latency. Then it looks at the code and locates getDiscounts. About two minutes after I ask the question, the agent gives me a code change to solve the problem.
For years, I’ve wished for Honeycomb in the IDE. Now I have it! Observability and code, together. Every field that my application adds to the telemetry, understood. Agentic AI is what a fast, flexible observability platform was made for—except it’s been grown for ten years, battle tested, and great for humans too.
Leverage AI-powered observability with Honeycomb Intelligence
Learn more about Honeycomb MCP, Canvas, and Anomaly Detection.