Stop Your Database From Hating You With This One Weird Trick
Let’s not bury the lede here: we use observability-driven development at Honeycomb to identify and prevent DB load issues.

By: Ben Hartshorne

Let’s not bury the lede here: we use Observability-Driven Development at Honeycomb to identify and prevent DB load issues. Like every online service, we experience this familiar cycle:
- You start with an idea and build a thing
- You have a database that holds some data
- Your thing gets popular
- Your database load increases
- You add more features
- Your database load increases
This is not a bad thing! It’s a normal thing. Databases are easy to start with and do an excellent job of holding important data. There are many variations of this story and many ways to manage and deal with the growth, from caching to read replicas to sharding to separation of different types of data and so on.
When the load starts to get high, you need to spend a little bit of time getting it low again so your business can continue. Honeycomb has gone through this twice already and the third time is looming. Each time we hope to enable another 10x growth or so and leave for a later time further improvements. After all, our job is not to build the perfect database implementation but to provide a service to our customers.
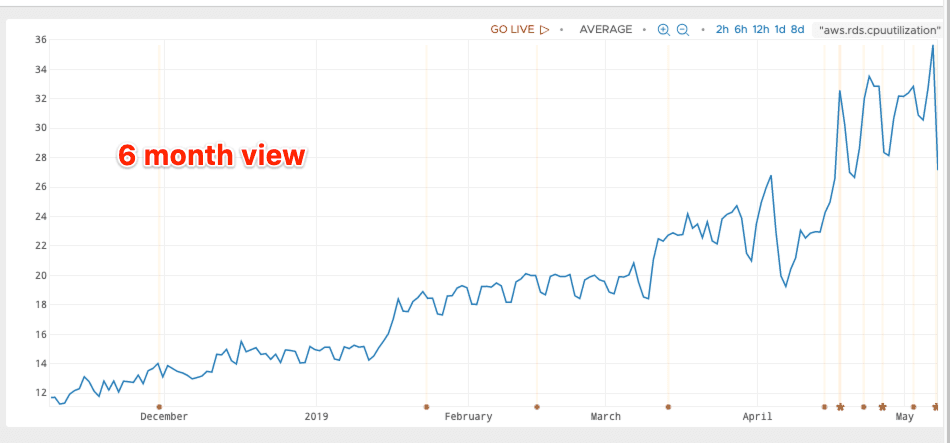
When should we (as developers) spend time on the database?
My rule of thumb is when utilization (either CPU or I/O) hits about 40% of the capacity of the machine. Databases can be fickle and quickly switch from “everything’s fine” to “I HAAATTE YOUUUUUU” so 40% feels like a good threshold.
The first time we hit our 40% threshold we added a cache in our API servers so that each event we process doesn’t need to get the dataset schema (and other things) from the database. This solved our problem for the next 10x, since the scale was now on the number of datasets rather than the number of events.
The second time we took the easy way out and bumped our RDS instance type from db.m4.xlarge to db.m5.2xlarge. That got us another 8 months of growth and development (a fine trade of money for dev time, IMO). Now we’re about to embark on our third round of this little adventure.
Anytime the system is pushing up against limits (even very conservative limits like 40% utilization) it’s nice to have an easy thing to do to back off the pressure just a bit while we explore options. This is the tale of that backoff.
A tale of TTLs
From the first time we rode this ride, we have a cache in front of our API server’s most frequent queries. But they still happen a lot. To lighten the load just a touch, maybe we should double the TTLs on our cache? There are a few calls that have a 30sec TTL and really, our system can easily handle a larger spread that that in the things that these caches are protecting, so let’s give it a try. But which TTLs should we change? How large will the effect be?
Enter a query to our API dataset in Honeycomb: Show us the COUNT of DB queries by caller. SUM the DB time, because that does a good job of balancing very-frequent-but-fast queries with still-frequent-but-slower ones. Thankfully we have instrumented our API server with the Go Beeline and it includes spans representing every database call made by the service.
Asking Honeycomb this question is as simple as filtering the query to only show spans that represent database calls (meta.type = sqlx) and breaking down by db.caller, the name of the function invoking the database query. The breakdown could have easily been on the SQL query itself, but I find the name of the function making the DB call is easier to visually identify and understand, as well as easier to jump in to the code to explore directly.
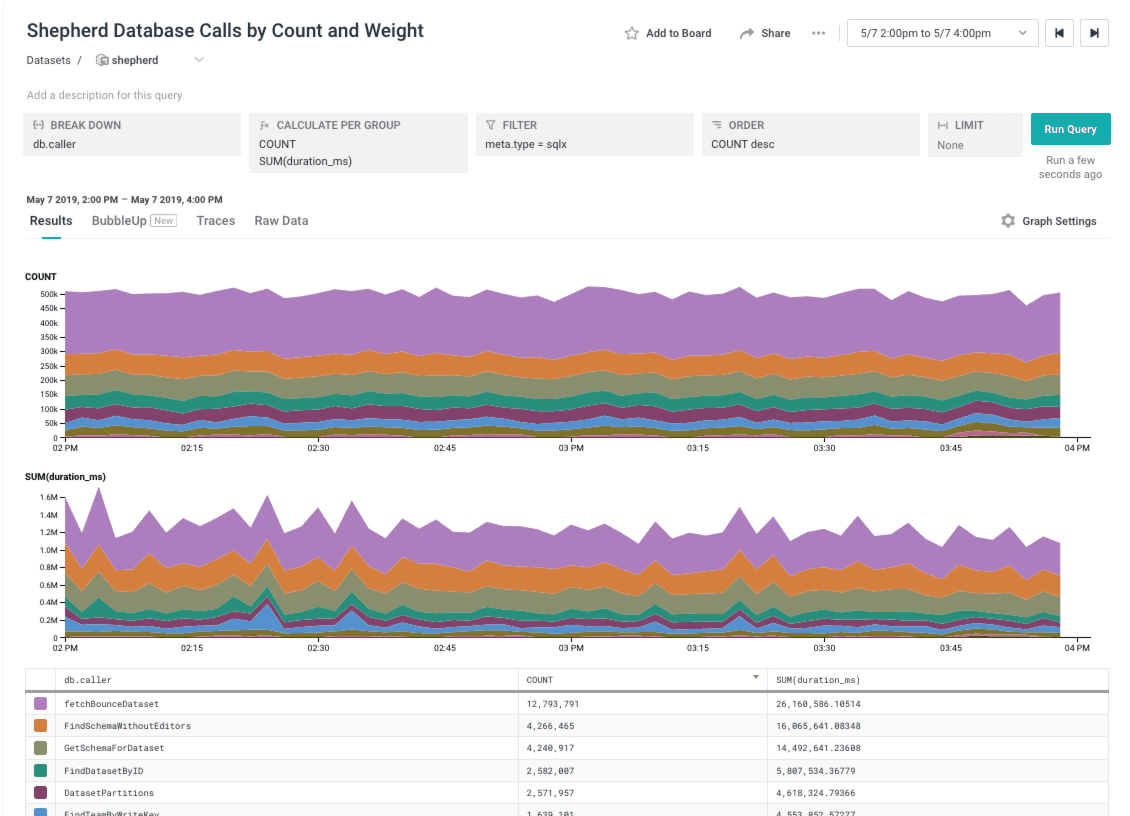
Here’s our list. There are three pretty clear winners; the top 3 lines in that graph make up 70% of the calls (by count) and 75% of the time spent in the DB.
A quick dive through some code begins, and we look at those three functions. Two happen to share the same timer, so a short change results in a nice short github diff:
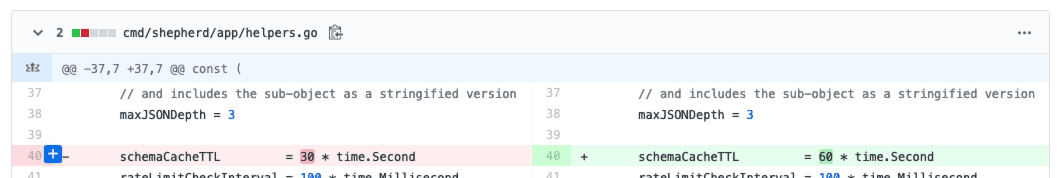
Test, review, merge, deploy, and there we go.
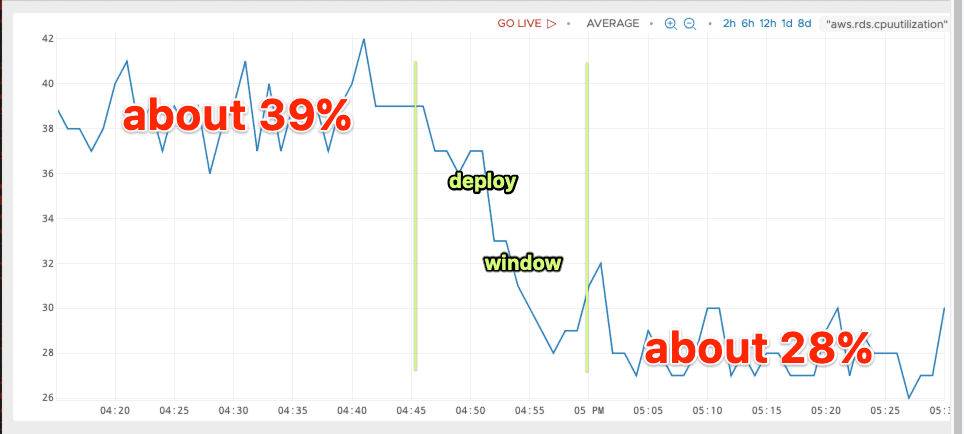
We’ve shaved off roughly a month’s worth of growth with maybe an hour of work. That gives us plenty of room to consider what choices we would like to make next to enable Honeycomb to continue to grow without feeling constrained by our database. We haven’t decided which of the available options is most attractive or will give us the next year or 10x traffic growth, but we’ve got plenty of data to work with as we make those choices.
Want to know more about Observability-Driven Development? Read this free guide: Observability for Developers.
Want to know more?
Talk to our team to arrange a custom demo or for help finding the right plan.