Taming Log Noise With the OpenTelemetry Collector's Drain Processor
Do you receive 50 million log lines per day and struggle to see what actually matters? Health checks, heartbeat pings, connection pool messages—they all drown out the errors and anomalies you're trying to find. What if the Collector could figure out the patterns for you?

By: Mike Goldsmith
The Director’s Guide to the Future of Observability: AI, OpenTelemetry, and Complex Systems
Read Now
Do you receive 50 million log lines per day and struggle to see what actually matters? Health checks, heartbeat pings, connection pool messages—they all drown out the errors and anomalies you're trying to find.
Most teams deal with this by writing filter rules to drop the noisy patterns. But those rules are manual, per-pattern, and brittle. A new deployment changes a log format and the filter misses it. A new service starts logging a chatty startup sequence nobody thought to exclude. The list grows, each rule a hand-crafted response to a specific annoyance.
What if the Collector could figure out the patterns for you?
Read our O’Reilly book, Observability Engineering
Get your free copy and learn the foundations of observability,
right from the experts.
Log clustering
Log clustering is a technique for grouping log lines by structural similarity. Instead of matching exact strings, you extract a template that captures the fixed parts of a message and replaces the variable parts with wildcards.
Take these three log lines:
user alice logged in from 10.0.0.1
user bob logged in from 192.168.1.5
user carol logged in from 172.16.0.3A clustering algorithm looks at these and derives a template:
user <*> logged in from <*>The usernames and IP addresses vary, but the structure is identical. Once you have the template, you can reason about classes of logs rather than individual lines. How many logs match this pattern? Is this pattern worth keeping? Is it drowning out more useful signals?
The Drain algorithm is a well-known approach to this problem. It builds a parse tree from the token structure of incoming log lines, groups lines with similar structure into clusters, and derives a template for each cluster. It works inline, processing one log line at a time as it arrives, which makes it a natural fit for a streaming pipeline like the OpenTelemetry Collector.
The drain processor
The drain processor is a new component in OpenTelemetry Collector Contrib that brings Drain-based log clustering into the Collector pipeline. It has alpha stability for logs and will be available in the standard contrib distribution starting with v0.151.0.
Here's the important thing about the drain processor: it annotates—it does not filter. When a log record passes through, the processor derives a template from its body and writes it as a log.record.template attribute on the record. The log itself passes through unchanged.
This is a deliberate design choice. The Collector already has processors for filtering, deduplicating, and routing logs. There's no reason to duplicate that. By keeping the drain processor focused on annotation, you can compose it with any downstream processor. Drop noisy patterns with the filter processor. Collapse repetitive logs into summaries with the logdedup processor. Route logs to different pipelines based on template with the routing connector. Or just send everything through and use log.record.template as a queryable attribute in your backend.
The attribute name log.record.template aligns with proposed additions to the OpenTelemetry semantic conventions, so it should play well with the broader ecosystem as those conventions mature.
Configuration
The drain processor has a handful of configuration options that control how the algorithm behaves. Here's a full example with the key options explained:
processors:
  drain:
    # Parse tree depth — controls how many tokens are considered
    # when matching log lines to clusters. Higher values produce
    # more specific templates. Min 3, default 4.
    tree_depth: 4

    # Cluster similarity threshold — how similar two log lines
    # need to be to belong to the same cluster. Range [0.0, 1.0].
    # Lower values create more clusters (more specific templates).
    # Default 0.4.
    merge_threshold: 0.4

    # Maximum number of clusters to maintain. When exceeded,
    # least-recently-used clusters are evicted. 0 = unlimited.
    # Default 0.
    max_clusters: 500

    # Maximum children per tree node — bounds memory usage.
    # Default 100.
    max_node_children: 100

    # Additional token delimiters beyond whitespace.
    extra_delimiters: []

    # For structured log bodies (maps), extract from this key
    # instead of using the full body. Empty = full body.
    body_field: ""

    # Output attribute name. Default: "log.record.template"
    template_attribute: "log.record.template"

    # Pre-load known templates at startup for consistency
    # across restarts and multi-instance deployments.
    seed_templates:
      - "user <*> logged in from <*>"
      - "heartbeat ping <*>"
      - "health check <*> returned <*>"

    # Raw log lines to train on at startup — the processor
    # derives templates from these before real traffic arrives.
    seed_logs:
      - "user alice logged in from 10.0.0.1"

    # Suppress annotation until this many clusters have been
    # observed. Prevents unstable templates during warmup.
    # 0 = disabled (annotate immediately). Default 0.
warmup_min_clusters: 20The two most important tuning knobs are merge_threshold and tree_depth. A lower merge_threshold produces more granular templates (more clusters), while a higher value groups more aggressively. tree_depth controls how many leading tokens the algorithm considers when routing a log line through the parse tree. Deeper trees are more precise but use more memory.
For most workloads, the defaults are a reasonable starting point. Start there and adjust based on what you see in your data.
Building a pipeline: annotate, then act
The drain processor on its own merely adds an attribute. Its power comes from combining it with downstream processors that act on the template. You have two main options, and the choice comes down to a tradeoff: drop noisy logs entirely for maximum volume reduction, or collapse them into periodic summaries to retain visibility while still cutting the noise. You can mix both. Drop patterns that are pure noise, collapse patterns you still want a pulse on.
Option 1: drop with the filter processor
The filter processor matches logs against conditions and drops those that match. Combined with drain, you can filter entire classes of logs by template:
processors:
  drain:
    max_clusters: 500
    seed_templates:
      - "heartbeat ping <*>"
      - "health check <*> returned <*>"
      - "connection pool recycled for <*>"
    warmup_min_clusters: 20

  filter/drop_noisy:
    error_mode: ignore
    logs:
      log_record:
        - attributes["log.record.template"] == "heartbeat ping <*>"
        - attributes["log.record.template"] == "health check <*> returned <*>"
        - attributes["log.record.template"] == "connection pool recycled for <*>"

service:
  pipelines:
    logs:
      receivers: [otlp]
      processors: [drain, filter/drop_noisy]
exporters: [otlp]A log arrives, drain annotates it with a template, filter checks the template against known noisy patterns, and noisy logs are dropped before they reach your backend. This gives you maximum volume reduction, but you lose all visibility into the dropped patterns. If one of those health checks starts failing, you won't see it.
Option 2: collapse with the logdedup processor
The logdedup processor takes a different approach. Alex Boten wrote about how we used it at Honeycomb to achieve a 75% reduction in log volume. Instead of dropping, it collapses duplicate logs into a single representative log with a count over a time window. By configuring it to group on log.record.template, you can compress thousands of repetitive logs down to one per template per interval while keeping visibility into the fact that they're still happening:
processors:
  drain:
    max_clusters: 500
    seed_templates:
      - "heartbeat ping <*>"
      - "health check <*> returned <*>"
      - "connection pool recycled for <*>"
    warmup_min_clusters: 20

  logdedup:
    include_fields:
      - attributes.log.record.template
    interval: 10s
    log_count_attribute: SampleRate

service:
  pipelines:
    logs:
      receivers: [otlp]
      processors: [drain, logdedup]
exporters: [otlp]With this configuration, every 10 seconds the logdedup processor emits one log per unique template, with a SampleRate attribute showing how many logs matched that template during the interval. 2.3 million heartbeat pings per day become 8,640 summary logs, which is a 99.6% reduction in volume while keeping visibility into the fact that heartbeats are happening—and at what rate. Tune the interval to balance latency against compression. Lower intervals mean logs flow through faster but with less deduplication per batch.
This is particularly useful for patterns you're not sure about yet. Instead of dropping them entirely and hoping nothing goes wrong, you compress them and keep a pulse on the volume. If the count for a usually-quiet pattern spikes, that's a signal worth investigating.
Discovering your noisy patterns
Whichever approach you choose, you don't need to know the noisy patterns upfront. Deploy the drain processor on its own first, without any filter or dedup rules. Let it annotate your logs for a few hours. Then, query log.record.template in Honeycomb. A GROUP BY on that attribute with a COUNT shows you exactly which patterns dominate your log volume:
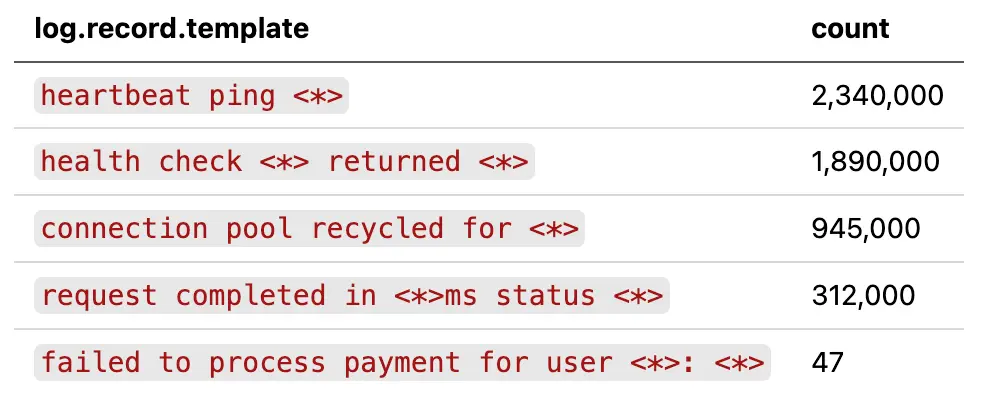
Now you can see the shape of your log data. The top three patterns account for the vast majority of volume, and they're all operational noise. The payment failure at the bottom is the signal you care about, and it's currently competing with five million noisy logs for your attention.
From here, decide per pattern: drop it entirely with a filter, or collapse it with logdedup. You might drop heartbeat pings outright (pure noise) but collapse health checks (you still want to notice if they stop).
Production considerations
Seeding for consistency
If you're running multiple Collector instances (which most production deployments do), each instance builds its own parse tree independently. Without seeding, different instances may derive slightly different templates for the same log patterns during their initial warmup period, especially if traffic isn't evenly distributed.
seed_templates solves this by pre-loading known templates at startup. Every instance starts with the same baseline, so they converge on identical templates from the first log line. Update your seed templates as you discover new patterns worth tracking.
seed_logs is an alternative. You provide raw log lines and the processor trains on them at startup, deriving the templates itself. This is useful when you have example logs but haven't manually extracted the templates yet.
Warmup period
When the drain processor starts fresh (or restarts without persistence), the parse tree is empty. The first few log lines may produce unstable templates that shift as more data arrives. warmup_min_clusters addresses this by suppressing annotation until the specified number of clusters have been observed. Log records still pass through, they just don't get a log.record.template attribute until the tree has stabilized.
If you're using seed templates, warmup is less critical since the tree starts with known-good patterns. But for deployments where you're discovering patterns organically, a warmup of 20-50 clusters is a reasonable starting point.
Memory management
The parse tree grows as new log patterns are observed. max_clusters puts an upper bound on this. When the limit is reached, least-recently-used clusters are evicted. This ensures memory usage stays predictable even with highly variable log patterns. max_node_children bounds memory at the tree node level.
For most workloads, 500-1000 clusters is a good range. If you're seeing useful templates being evicted too quickly, increase the limit or add them to seed_templates so they're always present.
Internal telemetry
The processor exposes two metrics for monitoring its own behavior:
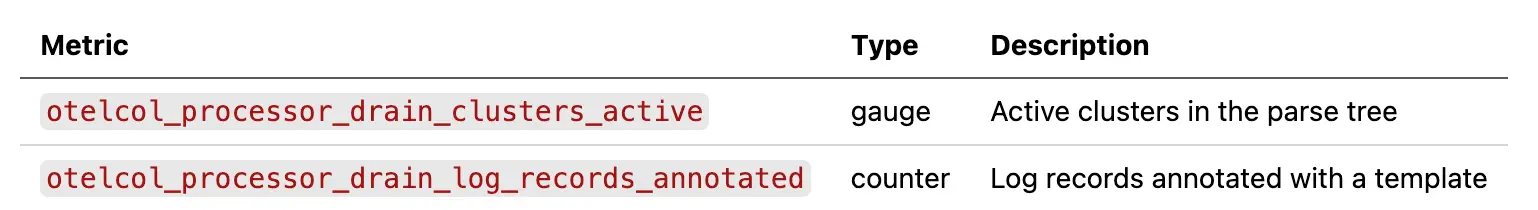
Watch clusters_active to understand how diverse your log patterns are and whether max_clusters is appropriately sized. If it's consistently at the limit, you may be evicting useful patterns via the LRU mechanism. In that case, increase the limit or add essential patterns to seed_templates so they're always present. If the gauge stays well below the threshold, your log diversity fits comfortably within the current configuration.
What's next
The drain processor is at alpha stability and working well for the core annotate-and-filter use case. There are a couple of extensions on the roadmap:
Snapshot persistence: Today, the parse tree is rebuilt from scratch on each restart (unless you use seed templates). Snapshot persistence would save the tree state to disk and restore it on startup, preserving learned patterns across restarts without needing to enumerate them all in the config.
OTTL body extraction: The body_field option currently supports simple map key access for structured log bodies. Full OTTL path expressions would let you extract the clustering input from deeply nested or complex body structures.
Getting started
The drain processor will be available in the standard otelcol-contrib distribution starting with v0.151.0 at alpha stability—no custom build needed. Add it to your logs pipeline, let it annotate for a while, and query log.record.template in your backend to discover what patterns dominate your volume. Then decide what to keep, what to collapse, and what to drop.
Sign up today
Want to see how your own data looks across semconv versions? Sign up for a free Honeycomb account and start querying, or book office hours with one of our Developer Advocates if you want a hand getting set up.