Using Honeycomb for LLM Application Development
Ever since we launched Query Assistant last June, we’ve learned a lot about working with—and improving—Large Language Models (LLMs) in production with Honeycomb. Today, we’re sharing those techniques so that you can use them to achieve better outputs from your own LLM applications. The techniques in this blog are a new Honeycomb use case. You can use them today. For free. With Honeycomb. If you’re running LLM apps in production (or thinking about it), these approaches should be useful.

By: George Miranda

Ever since we launched Query Assistant last June, we’ve learned a lot about working with—and improving—Large Language Models (LLMs) in production with Honeycomb. Today, we’re sharing those techniques so that you can use them to achieve better outputs from your own LLM applications.
The techniques in this blog are a new Honeycomb use case. You can use them today. For free. With Honeycomb. If you’re running LLM apps in production (or thinking about it), these approaches should be useful.
A new way to use Honeycomb
At Honeycomb, we jumped onto the LLM train fairly early. In doing so, we learned more than a few lessons. Along the way, we discovered a new way to use Honeycomb.
LLMs are nondeterministic black boxes that people use in ways you can’t possibly predict while still in development. Once released into production, operating those LLM-based apps becomes incredibly complex. Because natural language is infinitely expressive, users will ask your LLM apps to do funky and unpredictable things that break your expectations. With observability, you can quickly identify those failures and ship a bug fix. However, the subtleties of prompt engineering and fine-tuning likely mean that “fix” can—and will—break something else.
Developing apps around LLMs creates an entire host of challenges that can’t be debugged in local development. We quickly learned that those challenges are exponentially magnified when working with LLMs in production.
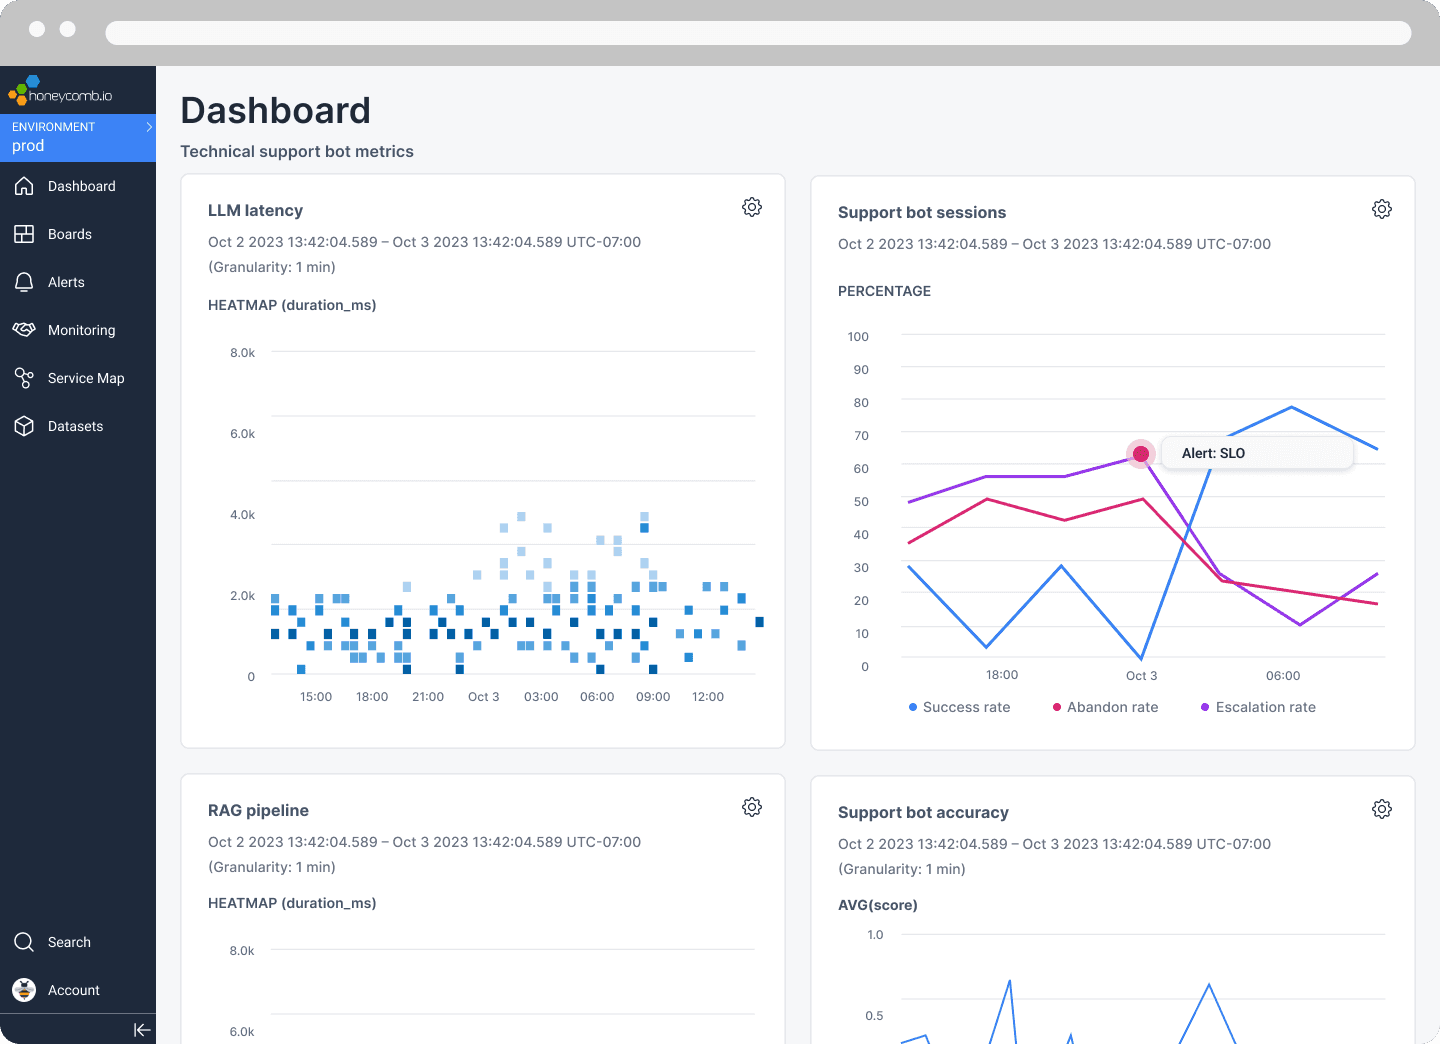
Running a reliable LLM app requires the ability to see individual user requests and analyze granular details within them to discover often hidden performance issues. When your LLM app fails to give a usable answer to a customer, was it due to external factors like network latency? Or was it due to internal factors, like your prompt causing the LLM to not produce output in an expected format? If you use Honeycomb, you probably already know how to use distributed tracing and SLOs to proactively identify issues like that in production.
That part isn’t new. That type of observability is a baseline requirement before working with LLMs—which are a critical external component within your app stack. If you don’t already know how to quickly identify the correct source of elusive issues in your stack, start there first.
At Honeycomb, we kept adding better instrumentation to our own LLM app as we worked to tune its performance. That led us to discovering a new use case for what’s possible with distributed tracing and generative AI.
Today, we’re showing you how to do that (manually) while we develop product capabilities to make this a smoother experience with faster time to value.
A quick primer on the problem LLMs introduce
How do you usually know what failed in your code? You load debug symbols, provide a specific input, and then step through each phase of execution to determine exactly where the output you expected failed to materialize. In the world of LLMs, the range of possible outputs for any given input is enormous, and it may even be intentional that it’s nondeterministic for your application. It’s impossible to exhaustively test all potential input scenarios because there’s no way to capture all outputs. Traditional techniques like unit and integration testing simply don’t work in this world.
Instead, ML teams build evaluation systems to check the effectiveness of a model (or a prompt, in the case of LLMs). These systems are powerful and they play a role similar to unit testing. But evaluation systems for your app have to be built over time. There’s typically no such thing as a drop-in evaluation system for your specific domain.
Effective evaluations are also difficult to build if you don’t have a good way to generate representative usage data in development. Which means most teams don’t build them—at least, not initially. When teams do build an evaluation system, it’s often only capable of ensuring basic levels of confidence that outputs aren’t explicitly bad or harmful. Evaluation systems need to capture real-world usage data over time in order to better flesh out those capabilities.
As engineers running production systems, what have we learned time and time again?
Test in prod or live a lie.
In the ML engineering world, that approach is called an online test. You don’t know if your systems are actually doing their jobs effectively until they run up against real-world usage.
Production usage is the best feedback loop
Users will ask your LLM-based apps to answer all sorts of questions you couldn’t possibly have predicted while in development. At Honeycomb, we found that we couldn’t accurately predict what users would try to do when given a natural language querying system.
In order to ensure Query Assistant delivered accurate results, we had to iterate based on what our real-world users did with it. As with traditional application performance, creating a feedback loop with real world usage data is critical to building reliable systems.
When working with LLMs, achieving accuracy often requires building effective evaluation systems and iteratively engineering better prompts. As a business, you have a decision to make: do you invest time upfront to fine-tune within a controlled environment, or do you accept that the model won’t be perfect and ship it anyway? Without an accessible and reliable way to iterate the quality of your LLM apps in production, your choices are either slow time to market, deliver poor quality results, or both. You can work past those choices by fine tuning your model after it goes live.
With Honeycomb, we’ve been able to capture real usage data and feed it back into our development cycle to rapidly iterate our Query Assistant into a trustworthy state. Honeycomb’s own Phillip Carter wrote an O’Reilly report, Observability for Large Language Models, where he walks through the steps in depth.
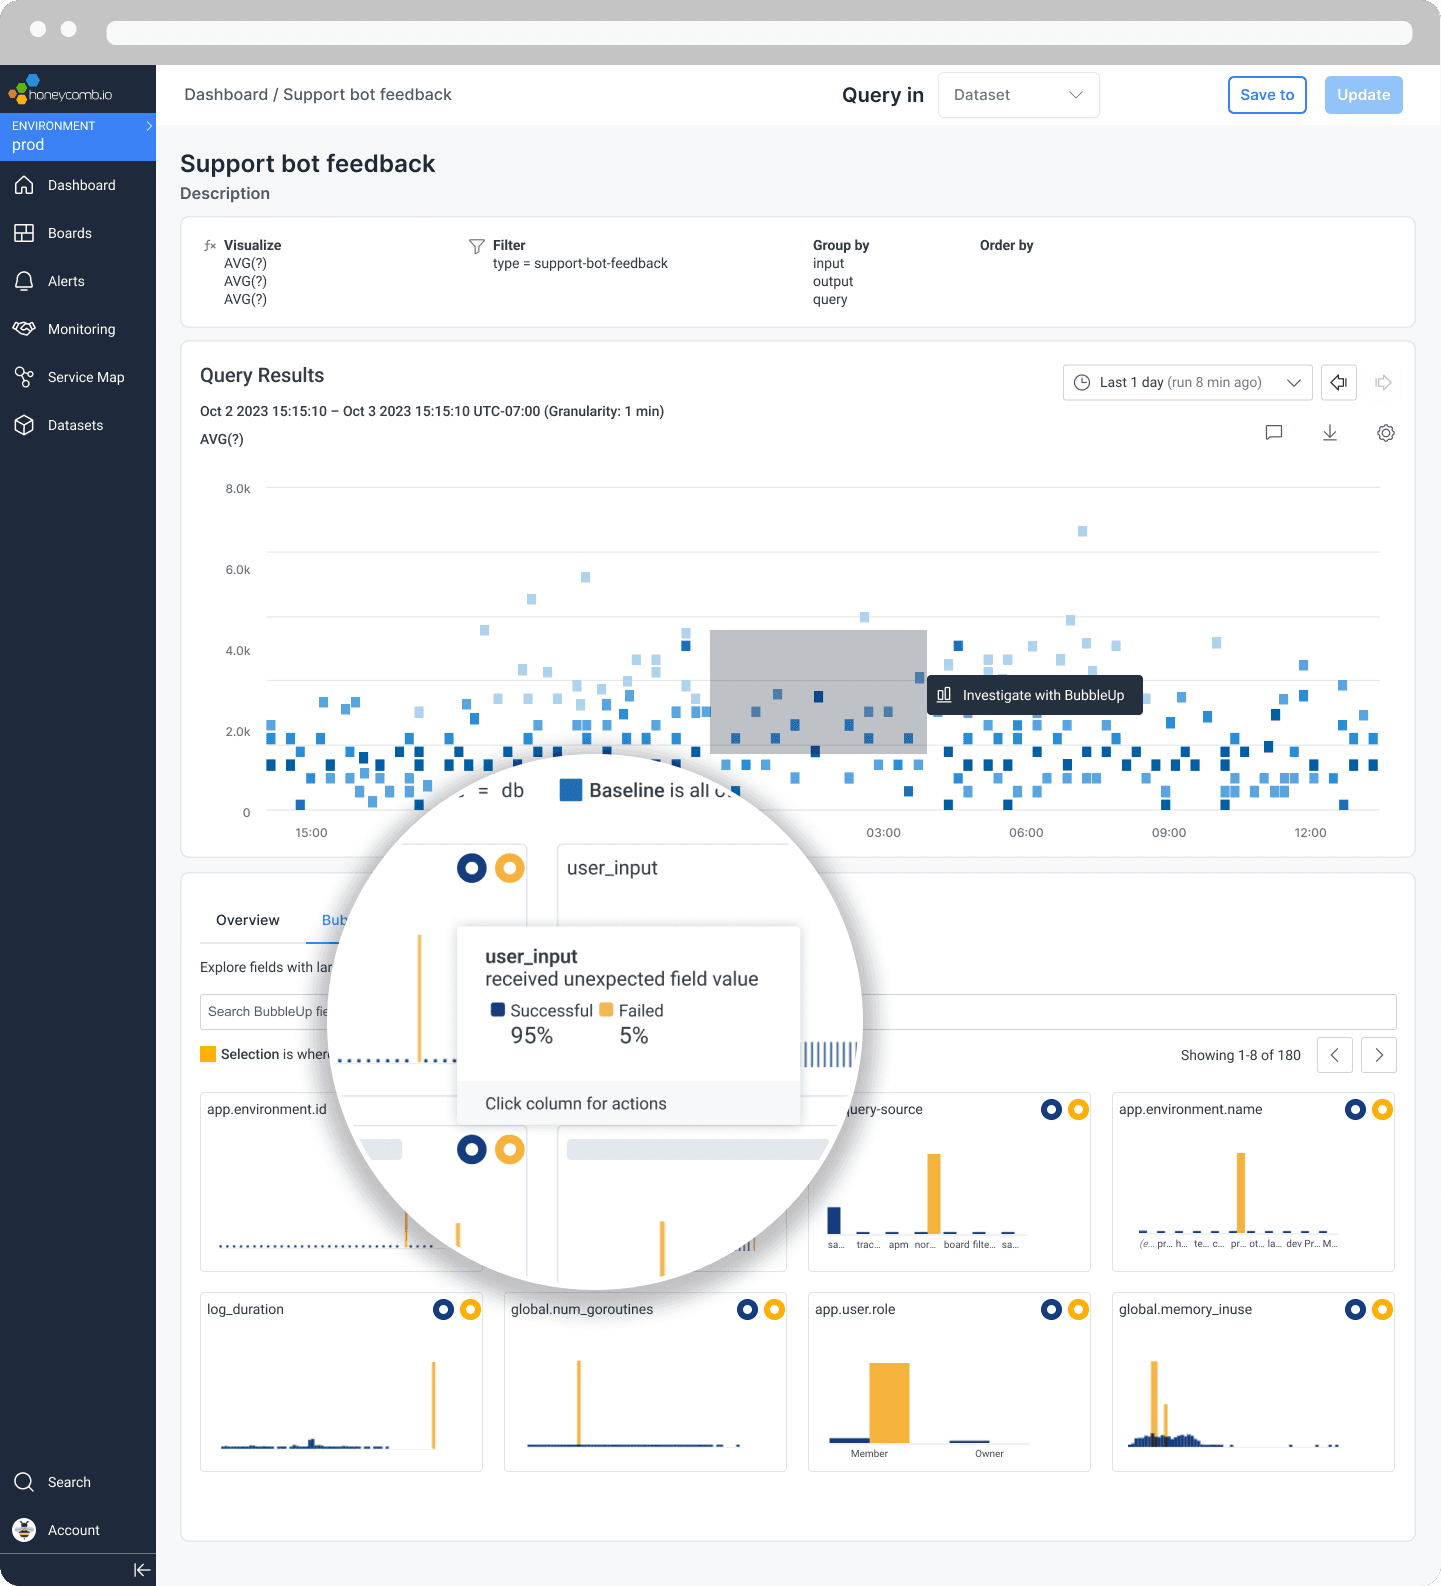
In short, you instrument your application with traces that gather valuable data about real user behavior and system performance such as user inputs, LLM outputs, parsing/validation outputs or errors, and user feedback. That telemetry can be used with all common LLM app development patterns, like Retrieval-Augmented Generation (RAG), chat apps, agents, and chaining.
With that data in your traces, you can isolate specific requests that exemplify poor behavior of your prompt or fine-tuned model, providing specific and actionable feedback on what to fix. It can also be aggregated into larger tables that become the basis for test cases in an evaluation system.
Check out our docs to see how you get started by manually adding LLM instrumentation to your existing traces. You can do that today with any Honeycomb account.
Test in prod or live a hallucination
For many teams, the scariest part of deploying LLM-based apps to production is the uncertainty around accuracy of results once they’re live. How do you know if your LLM is hallucinating and, more importantly, how do you mitigate that? How do you ensure the fix you deployed for one problem doesn’t introduce another?
We think the key to mitigating hallucinations can come from actively monitoring real-world trace data, which includes the entirety of an LLM app’s lifecycle using Service Level Objectives (SLOs).
At Honeycomb, we also believe that creating a production feedback loop is a core part of any observability practice. When working with LLMs, that requirement is especially pronounced.
The path to an easier way
A popular mantra for building great software is to make it valuable, then easy, then fast, then pretty. As early adopters running LLM-based apps in production, we’ve found this pattern immensely valuable.
Today, you still have to build some plumbing to make it all work. We’re working on that. For now, between the O’Reilly report and our docs, you have the core components to build this type of production feedback loop for yourself.
One part of making that easier in the future might be from the OpenLLMetry project. OpenLLMetry is a set of extensions built on top of OpenTelemetry. The project runs in parallel to OpenTelemetry, and we believe that’s the right choice given the rapid pace at which the LLM space is evolving. OpenLLMetry has applied to become a CNCF project, a move we support, endorse, and are excited about.
Beyond instrumentation, we’re also currently working on additional product capabilities within Honeycomb to more effectively enable this use case. Stay tuned for more news. For now, if you’re running LLM-based applications in production, we’d love to hear from you and learn more about your use case.
Getting started
The solutions presented in both our docs and the O’Reilly report are usable today with Honeycomb. You’ll need to do some work on your own to make them possible, but we’d love to help you on your journey. Here’s what you can do to get started.
Check out our documentation on instrumenting your traces for LLMs. On that page, you’ll also find a link to pop into our LLM Office Hours, where you can chat with us and get help as you get started.
Want to know more?
Talk to our team to arrange a custom demo or for help finding the right plan.