Observability Sheds Light on Dark’s Business Growth and Customer Scaling Needs

By: Maulik Mistry

About
Dark is a new way of building serverless backends. Just code your backend, with no infra, framework, or deployment nightmares. In less than an hour, you can use Dark to code a custom API for your app.
Environment
- OCaml & Rust
- Apps are mostly monolithic
- Kubernetes
- Structured logs (previously in Stackdriver)
- Heap (for business insights)
Goals
Dark’s engineering team relied on logs to understand how users interacted with their platform. But a desire for both deeper understandings of user behavior throughout the platform and a need for better visualizations drove the team away from Stackdriver and toward observability-driven development with the adoption of Honeycomb. They wanted to use tracing to understand performance and traffic pattern changes. They also needed to identify the highest-impact areas where investing in system optimization would result in better user experience.
Through this journey from unstructured to structured logs and now observability, I’ve enjoyed being able to run richer queries. I don’t always know what I’ll want later on but as we instrument, get it into Honeycomb, we know that we’ll figure out what’s useful.
Ian Smith
Engineer at Dark
What They Needed
- An ability to better understand how users experience Dark’s platform by running rich queries & interactive visualization for introspection.
- To proactively understand how deployments and performance tuning impact application behavior using tools like tracing and Honeycomb markers.
- A way to enable collective debugging across the team using tools like boards and team history.
Use-case: System Optimization
Honeycomb helped the team notice when a change in data loading for one of their high-traffic endpoints not only experienced a significant number of hits (COUNT), but also generated more compute time than anything else (SUM(request_time)). With that insight, they were able to determine it was the right place to optimize because even though the individual requests were small, the aggregate SUM() was very large.
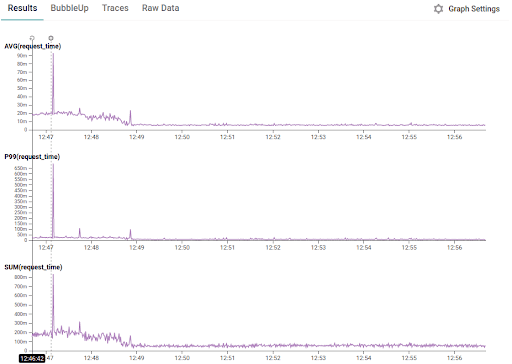
The marker on the left shows when the change began to ship, followed by a decline as the deploy rolled out (showing a clear reduction). The goals were achieved right after the rollout. This type of visualization is exactly what Dark’s team needed for their weekly retro.
Getting a Clear Picture of Business Needs
In order to better understand customer usage patterns, the team created Honeycomb boards for Dark’s CEO Ellen Chisa. She and other customer-facing teams provided extremely valuable insights before they could roll out a full-blown business analytics platform a year later.
I relied on Honeycomb to understand relative traffic between different users. Honeycomb tells me how much bigger a particular user is and how much of our load we are experiencing from a business viewpoint.
Ellen Chisa
CEO at Dark
The team also uses Rollbar for error reporting and collective triage. Rollbar code spits out a log, which is also now in Honeycomb, that allows engineers to correlate Rollbar and Honeycomb data and see which users are affected by an issue.
I see users and their projects. We didn’t know what their project was without Honeycomb. If I find out about an incident where something was broken in the last two hours, I can see exactly who was impacted by that particular incident. It helps us get ahead of issues.
Ellen Chisa
CEO at Dark