Database Observability
Honeycomb works directly with MySQL, MongoDB, or PostgreSQL in order to reliably track down the source(s) of any slowness or odd behavior in just a few clicks.
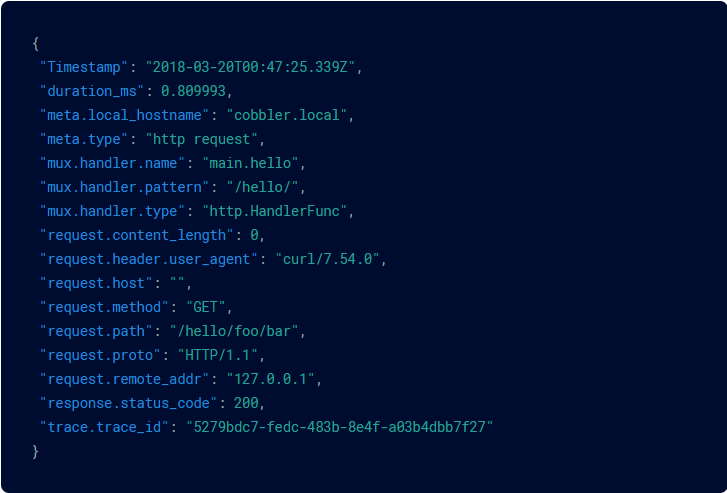
By consuming logs (or capture TCP and parsing them into structured data, Honeycomb makes it possible to answer deep questions about database operation instantly.
Get Started Now
Data Collection
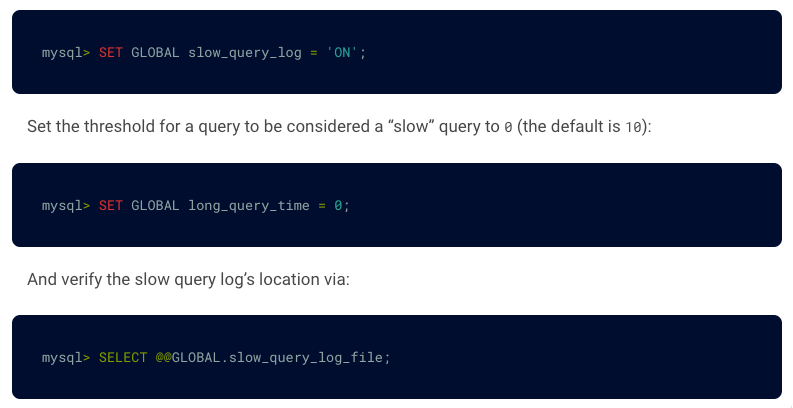
The honeytail agent captures logs, extracts structure and transforms query-level events into JSON, and streams the data into Honeycomb as it’s written—gathering query-level details crucial to debugging struggling databases. We have a range of integration options for MySQL, and PostgreSQL.
You can also backfill old logs into Honeycomb to look at past data.
Query Log Analysis
With query-level database events in Honeycomb, you can ask questions like:
- What is the sum of all lock times held, over time? Grouped by normalized MySQL queries?
- What is the read lock percentage on the slowest MongoDB collection?
- Which set of queries are responsible for the most lock time held?
- What % of the write time is being consumed by any given user, app, shopping cart?
- What are 20 most commonly-run normalized query families (avg, 95th, 99th, 99.9th, 99.999th percentiles, and MAX duration), ordered by the slowest raw query?
- What is the scan efficiency–how many rows are being scanned by each normalized query family, relative to the number of rows in the table?