Case Studies Observability Distributed Tracing Customers
Intercom Accelerates Developer Productivity With Observability and Distributed Tracing
15 minute read
Intercom’s mission is to strengthen the relationship between businesses and their customers through better communication. With that in mind, they began their journey towards complete observability to improve their development pipeline to be able to ship more quickly and efficiently.
The early days of Intercom’s observability journey were characterized by multiple different vendors for different telemetry data types. A typical workflow looked something like this: a tool would send an alarm and its description to the team, directing them to a dashboard in a second tool. The dashboard typically had at least 100 charts that lacked clear correlations or specific data about the issue at hand. So, the team would have to go to a third tool to find information about transactions, for example. If the team needed exceptions tracking, that was yet another tool.
“It quickly became obvious that these workflows were extremely inefficient,” said Kesha Mykhailov, Product Engineer at Intercom. “Multiple tools mean multiple costly setups, and multiple silos where telemetry data is stored. Only a few people really master these tools to the point where they can use them efficiently. The bottom line is that people were not happy—the experience was hard, and they couldn’t get the information they needed.”
“What people really want is the ability to see different visualizations easily and quickly, without having to hop through various tools,” Kesha continued. “They want to understand what ‘normal’ looks like, and what ‘deviation’ looks like. All they want is a tool that allows them to seamlessly switch between different visualizations and get alternate perspectives on their problem. That’s what tracing gets us.”
Proving the value of observability
Because traces provide a much more granular view, they have a massive advantage over other ways that telemetry data can be presented and observed. They encode enough information about transactions to power a much more detailed view of an organization’s systems and environment. To support the shift to a distributed tracing model for observability, Intercom worked with Honeycomb on a proof of concept to get tracing into the hands of engineers as quickly as possible—and enable the entire company to see how they make observability workflows more efficient. While Intercom considered other vendors for its observability solutions, it decided to continue working with Honeycomb. “In the end, we concluded that Honeycomb not only worked better for the main workflow we had identified, but also ticked the boxes on sampling, pricing, and usage metrics,” explained Kesha.
To learn more, please visit our distributed tracing page.
Distributed tracing in action at Intercom
While most people think of distributed tracing in the context of microservices architecture, the majority of Intercom’s product is concentrated in a single monolith. However, many of the web requests the system processes use code from as many as 14 different product teams. “Because the code is so complex, we use tracing to help us understand what’s going on,” Kesha explained. “If something is broken, what team is responsible for that part of the application? Which service was it? If something is slow, we ask the same questions. Distributed tracing helps us find the answers.”
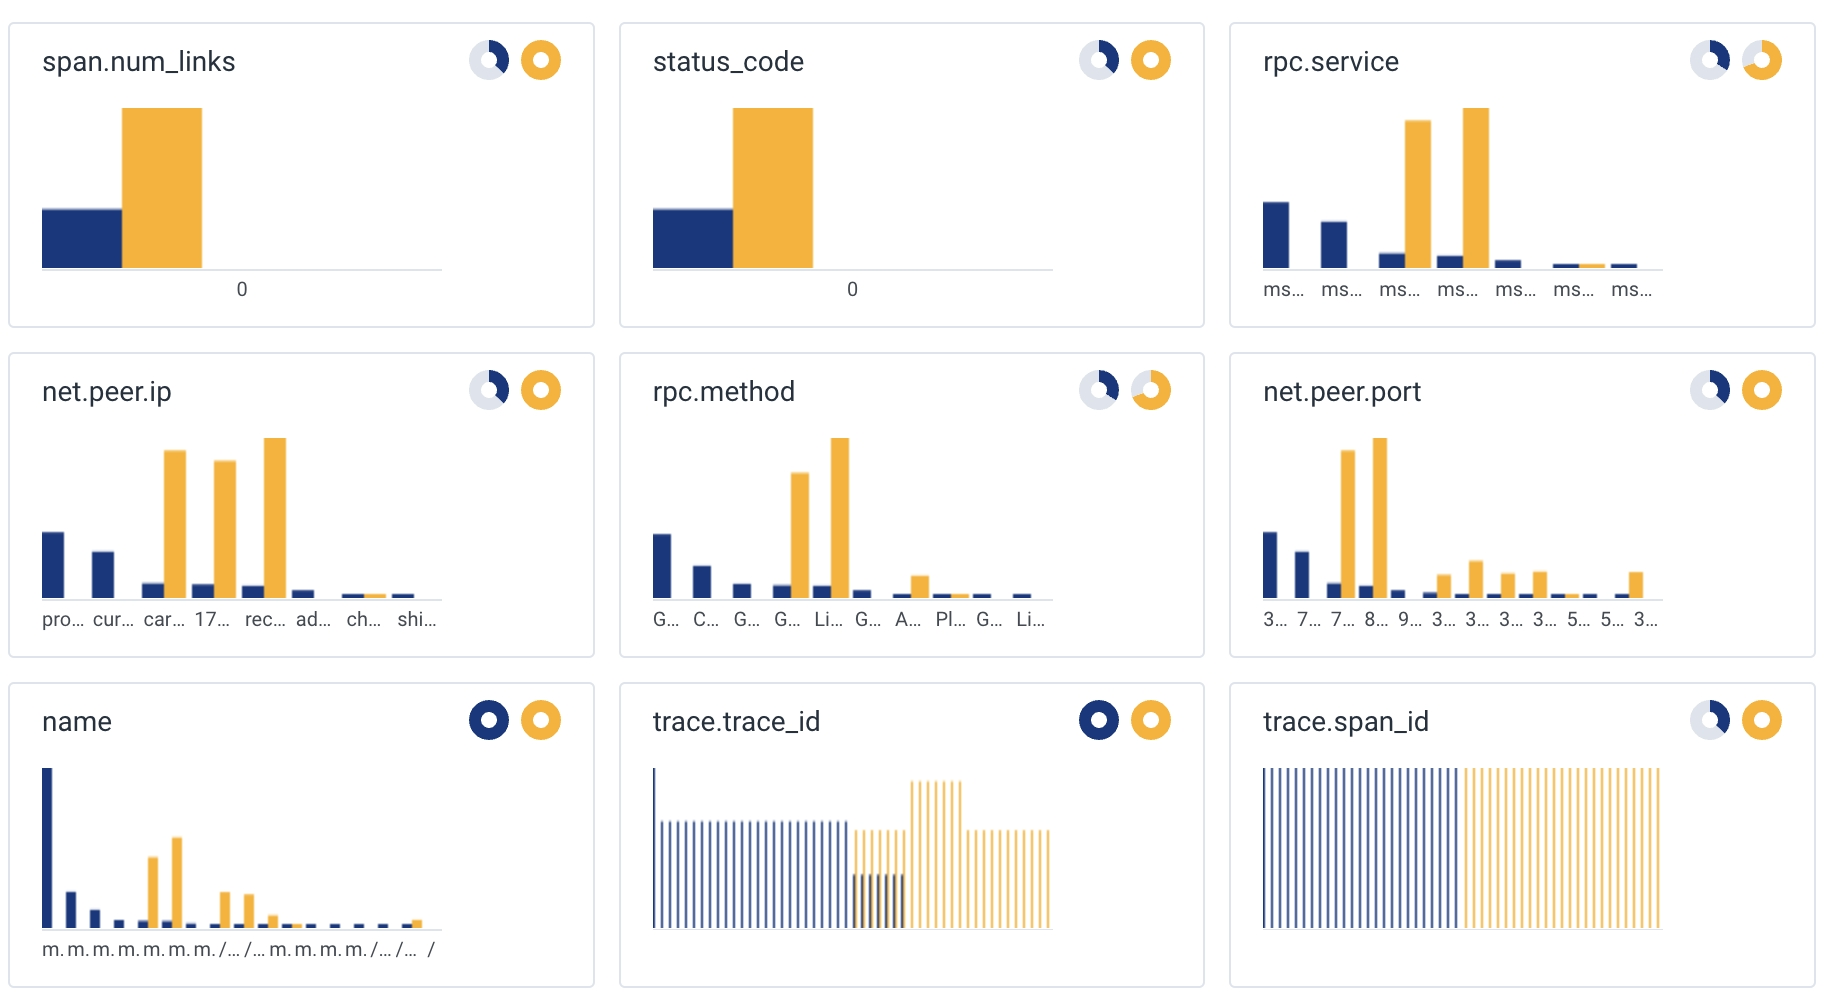
Distributed tracing also supports Intercom’s engineering team across a wide spectrum of use cases. These can range from understanding how a certain signal changes over time or under certain conditions, to seeing distributions in the form of heatmaps to identify outliers.
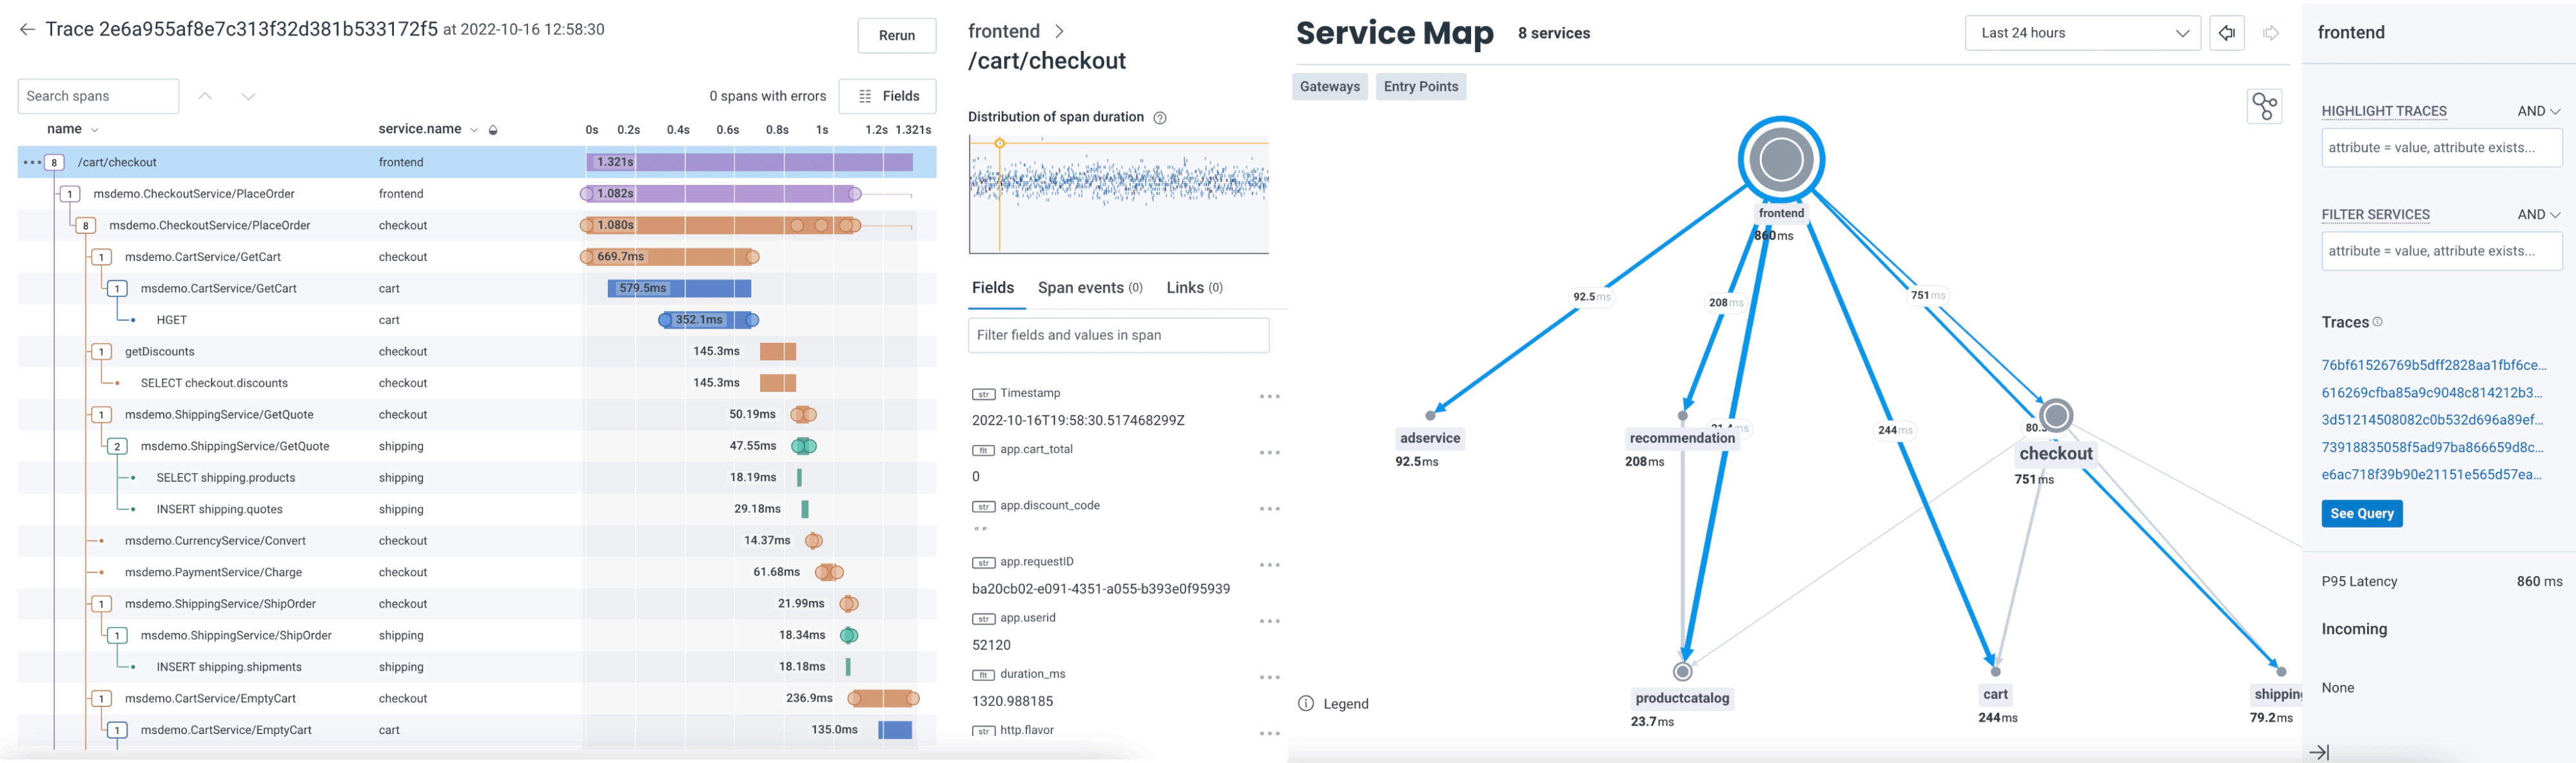
“Tracing is also helpful for engineers new to the team who are just trying to understand the system they own,” Kesha noted. “Say I want to learn what kind of components or systems go into processing a certain request. All I have to do is open a Honeycomb trace view to see the hierarchical structure of the different units of work.”
“For more experienced engineers, being able to look at traces produced in the local development environment helps them build muscle memory without being under pressure,” he added. Because Intercom’s engineers can see how the instrumentation will look before it’s pushed to production, they have more time to run queries on the code and find reasons for anomalies. Then, if there is a problem in production, they know how to solve it.
Sampling decisions made intelligently
Distributed tracing is key to finding and resolving issues, but it can also generate a lot of data about successful actions in an application. That means it can be difficult to find and retain the important traces—the ones that indicate the situation isn’t normal. Sampling enables teams to assign a single value to a set of traces that are not problematic. But, determining how to set up sampling isn’t always easy, and Intercom needed help.
The team turned to Honeycomb Refinery, a trace-aware tail-based sampling proxy that examines whole traces and intelligently applies sampling decisions based on predefined rules. “The ability to have precise sampling rules opens up various use cases,” said Kesha. “For example, we have a full audit of anything folks do in the production console, which is really valuable.”
Observability culture and measuring adoption
Adopting distributed tracing was part of a greater shift to a culture of observability at Intercom, and measuring adoption is one way to understand the progress of that shift. While it can be challenging to measure adoption directly, Intercom developed a proxy approach using GitHub, which the company uses for issue tracking. The team postulated that if insights gained from tracing were valuable, people would share them with their colleagues. They decided to count the number of issues or pull requests where Honeycomb was mentioned or linked to (trace, query result, etc.) as a proxy for adoption. “Measuring adoption through how frequently folks share their insights gives us a better idea of how useful those insights are,” Kesha noted.
To further embed the culture shift, Intercom has added an observability channel to Slack. When someone asks a question related to observability, Kesha asks them to post it in that channel so that everyone can see and learn from it. “We try to make observability practices part of operations so that they’re not used only when something breaks, but to answer basic questions that help us understand our system better,” Kesha added.
What’s next for Intercom observability?
Recently, Intercom began transitioning to Service Level Objectives (SLOs) to enable trigger alerts for critical issues. “This is a massive opportunity for us in terms of adoption,” Kesha explained. “If we start pointing folks toward the right tooling from the alarm, we’ll be more productive, and our workflow will be smoother.”
“We’re starting to get larger enterprise customers. We want to make sure their experience is positive. Tracing helps us establish better visibility and assess for impact,” Kesha concluded.
Get started with distributed tracing
Are you ready to leverage distributed tracing? Sign up for free to get started.