Introducing Relational Fields
By Josephine Yuan | Last modified on April 23, 2024We’re excited to bring you relational fields, a new feature that allows you to query spans based on their relationship to each other within a trace. Previously, queries considered spans in isolation: You could ask about field values on spans and aggregate them based on matching criteria, but you couldn’t use any qualifying relationships about where and how the spans appear in a trace.
Relational fields allow you to more easily find interesting traces and learn about the spans within them, saving time for debugging and enabling more curiosity within your team around how transactions perform throughout your services. We currently provide support for three types of relational fields:
root.
root. allows you to narrow your query to only spans that have root spans with specific attributes. If you’re looking for traces that you know start with certain fields, use root.
- Filter for the
root.fields. - Additional filters in your query will then match only to the spans in traces you’ve identified that match these conditions.
- You can also group by
root.without additional filters.
parent.
parent. allows you to narrow your query to spans whose direct parent span has specific attributes. If, for example, you know a service is called somewhere further down in a trace and you want to find one of its direct children, use parent. It narrows your query to a much finer section of a trace than root. and limits the additional filters to the direct children of the parent. match.
- Filter for the
parent.fields. - Additional filters in your query will then match only to the direct children spans of the parent you identified.
- If you want to count the children of a parent span with a given attribute, you can group by
parent.with no additional filters. We will find one parent span match per trace.
any.
any. allows you to narrow your query to only spans where a single other span within the trace has specific attributes.
- Filter for
any.fields. Using more than oneany.will match many fields on a single span. - Your search will only find spans where another other span matches the
any.criteria. any.isn’t ordered as it looks through a trace—it finds the first match randomly.- With
root.andparent.you need to understand the shape of your traces. You have to know what’s on the root or what a given parent hierarchy looks like. Withany., you can know less about those shapes as long as you know about important fields on the spans.
What does this look like?
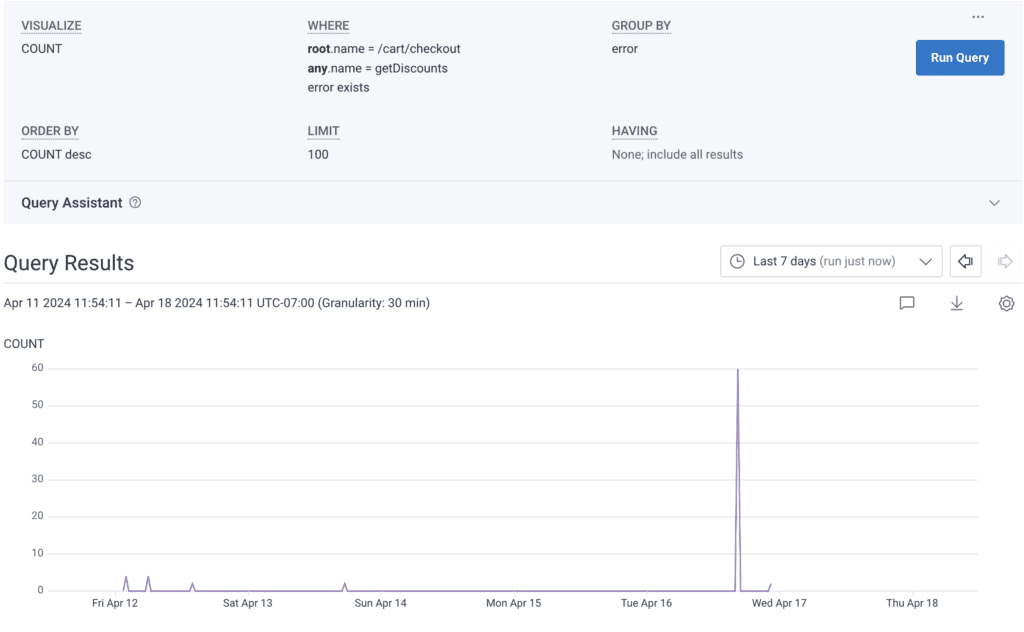
Let’s say you want to find any spans with errors during the checkout process where a discount code was used. An example query utilizing both the root. and any. prefixes might look like:
- VISUALIZE:
COUNT - WHERE:
root.name = /cart/checkout AND any.name = getDiscounts AND error exists - GROUP BY:
error
This example query would find the count of all spans where an error exists, where any span in the same trace is named getDiscounts, and where its root span is named /cart/checkout.
Example span clicked from the query results:
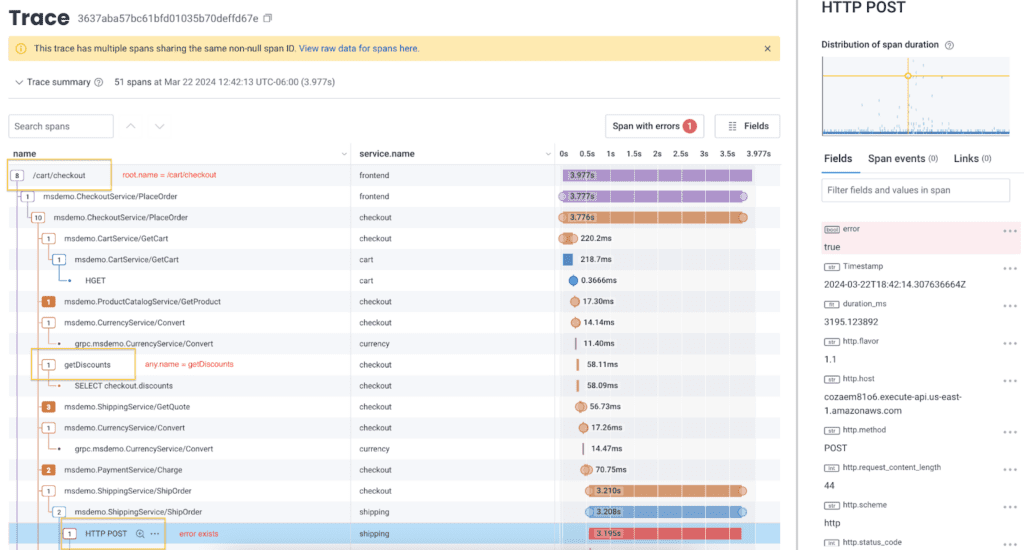
You can see that we found a span with an error where the root span has name = /cart/checkout and where any single span in the trace had name = getDiscounts.
How you can use relational fields
Investigations and errors
When troubleshooting technical issues, especially in distributed systems, it's common to encounter situations where crucial information is dispersed across various spans or layers of the system.
For example, if an error is happening far down the stack, it might show up on a span deep within your trace—but only the root span of that trace was instrumented with team information. If you want to figure out which teams are affected by that specific error, you would need the ability to query on those deeply-nested error spans and their traces' root spans.
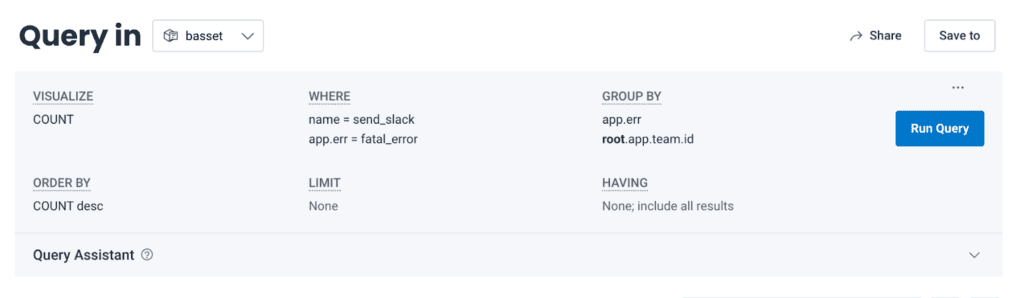
This exact case happened at Honeycomb a month ago. Failure rates for sending Slack notifications were elevated by roughly 5%. We wanted to know if this affected everyone or if it was isolated to a specific set of teams.
We initially tried to answer that question without relational fields, but this proved impossible. Spans that had the notification-related errors populated didn't have access to the team information.
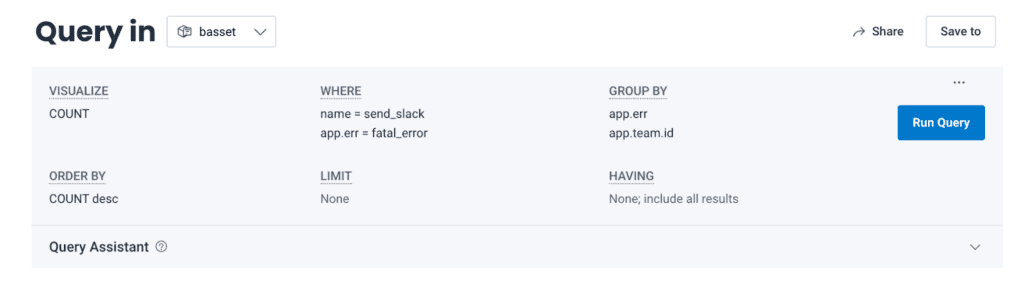
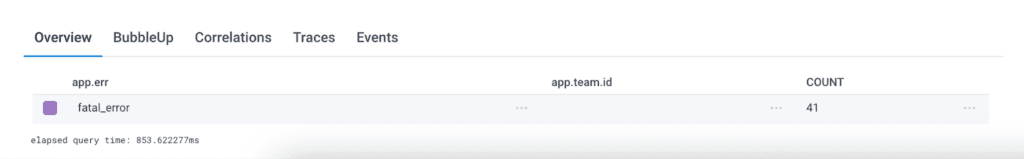
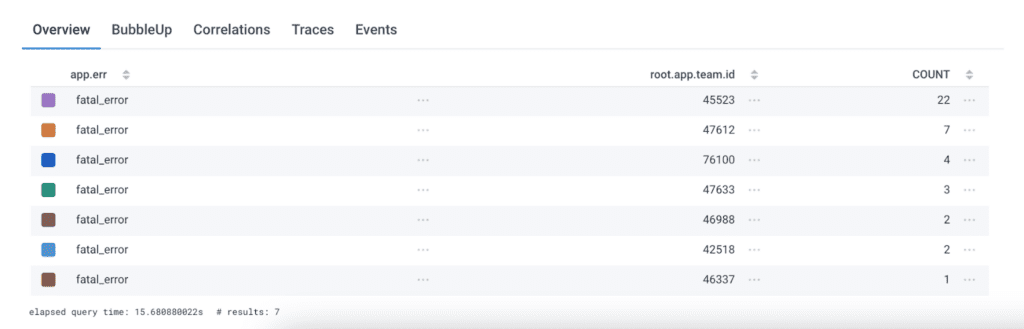
However, the root spans of these traces did have access to team ID! By adding a join on the root span, we were able to identify the exact list of customers affected by the issue. With this combination of filters and groups, we could see that it was, in fact, only a small number of teams impacted. We laid out our next steps accordingly.
Performance bottlenecks
There are instances where you may want to identify performance bottlenecks in a multi-tier application.
For example, you want to locate spans where a particular service (e.g., a database call) takes longer than a threshold (e.g., 200 ms) and its parent span is in the application layer.
You might write a query like this:
VISUALIZE COUNT, P95(duration_ms)
WHERE type = db.query AND duration_ms > 200 AND parent.service = app
Usage analysis
You may want to understand the volume, performance, or usage per service at times.
To achieve this, you could query event count by root span name in order to find out how many events each of your lambda functions or API endpoints are generating.
You might write a query like this:
VISUALIZE COUNT
GROUP BY root.name
Conclusion
Relational fields allow you to query relationships across the trace to find spans of interest. This is extremely profound in many scenarios, and we’re happy to bring this functionality to the Honeycomb platform. Read more about the feature in our docs.
Want to try it for yourself? We have a very useful free tier—start sending your data and play with the feature today!
This post was written by Josephine Yuan and Quinn Leong.
Related Posts
Introducing Honeycomb for Frontend Observability: Get the Data You Need for Actionable Customer Experience Improvements
Honeycomb for Frontend Observability gives frontend developers the ability to quickly identify opportunities for optimization within their web app. This starts with better OpenTelemetry instrumentation,...
Real User Monitoring With a Splash of OpenTelemetry
You're probably familiar with the concept of real user monitoring (RUM) and how it's used to monitor websites or mobile applications. If not, here's the...
Transforming to an Engineering Culture of Curiosity With a Modern Observability 2.0 Solution
Relying on their traditional observability 1.0 tool, Pax8 faced hurdles in fostering a culture of ownership and curiosity due to user-based pricing limitations and an...