Agent Timeline: The Flight Recorder for Your AI Agents
Every LLM call, every tool invocation, every agent handoff, every downstream service span, in one conversation, in one view. Now in Early Access.

By: Dan Juengst
Honeycomb Innovation Week: Full Day 2 Sessions
Watch a full replay of all keynotes on Day 1 of Honeycomb's Innovation Week and learn more about what's on the roadmap for us this year.
Watch Now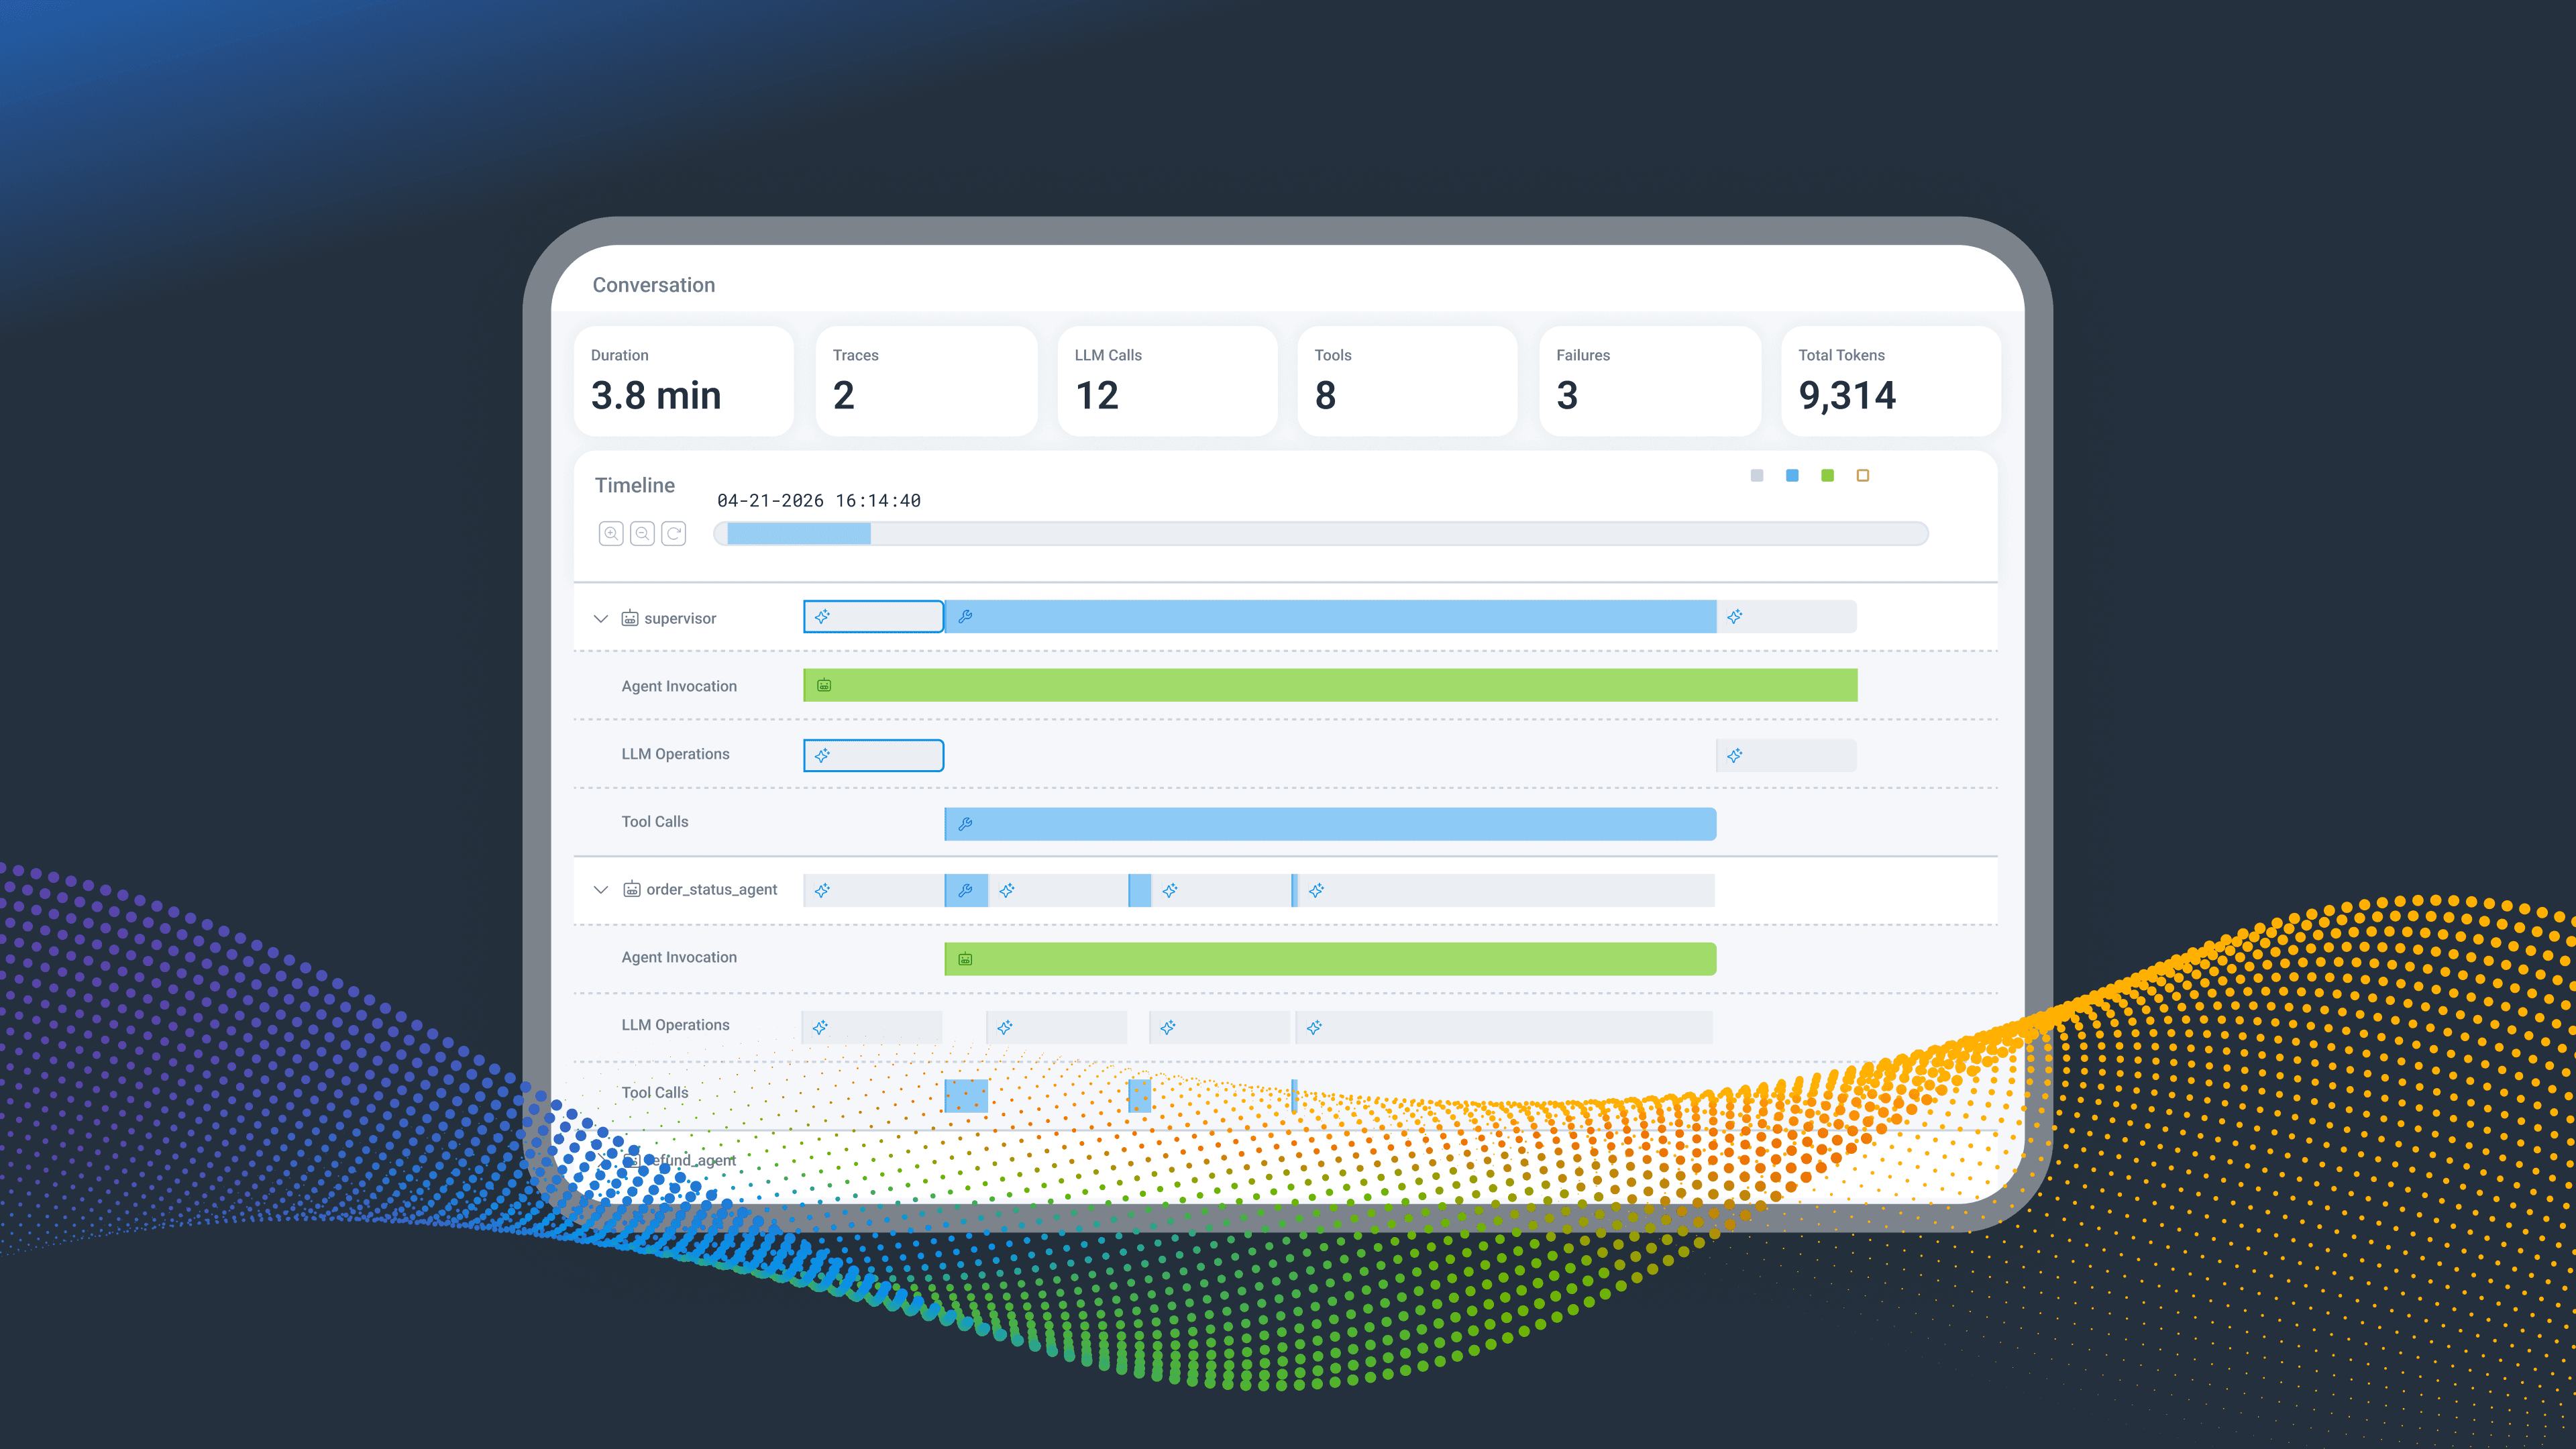
Last week, we introduced Agent Timeline, a powerful new observability experience purpose-built for debugging AI agent workflows in production. Agent Timeline uniquely connects AI-layer visibility to full-stack observability by organizing telemetry around an agentic conversation. A conversation contains one or more agent executions, each of which may contain LLM calls, tool invocations, handoffs, retries, human escalations, and downstream system calls.
Think of it as the flight recorder for your AI agents. When something goes wrong, the sequence of events is right there, with full context attached. No fragments to reconstruct.
Watch the full demo video below.
Why we built Agent Timeline
It's 11:47pm on a Tuesday. You're on call. A Slack ping lands from customer success: "Enterprise customer says the agent just stopped mid-conversation. They were trying to refund an order."
You open your laptop and start digging.
First tab: your LLM observability tool. Lots of calls, all green, but the view stops at the model. You can't see what the agent was trying to do between calls, or why everything stopped after a six-second gap. The data is sampled, too. At the volume your enterprise customers generate, you're flying partially blind.
Second tab: your APM. There's a 502 from payments that loosely correlates, but it's from five minutes ago, not right now. You're reading yesterday's newspaper while the fire is still burning. And even if the timestamps aligned, you couldn't drill into the individual request. Your agent framework wraps things in its own context and the trace IDs don't line up. High-cardinality lookups like "show me every event for this specific user, in this specific session, across every service it touched" aren't something these tools were built for.
Forty minutes later, you've assembled a theory: a tool retried against a rate-limited API, error messages bloated the context window, and the agent gave up.
The tools exist, they're just not built for this. Not real-time enough to catch agents in the act. Not high-cardinality enough to follow a single thread through a distributed system. And not built to scale when one enterprise customer alone can generate millions of spans a day.
This is what debugging AI agents has been until now. And it is brutal.
New to Honeycomb?
Get your personalized demo today.
You’re not alone
If that scene felt uncomfortably familiar, congratulations: you're running AI agents in production. The fundamental problem is that an agent conversation isn't a single request and response. It's a story, and your tools only show you fragments of it.
What if it could be easier?
Imagine the same Tuesday night. Same Slack ping. This time, you open Honeycomb's Agent Timeline.
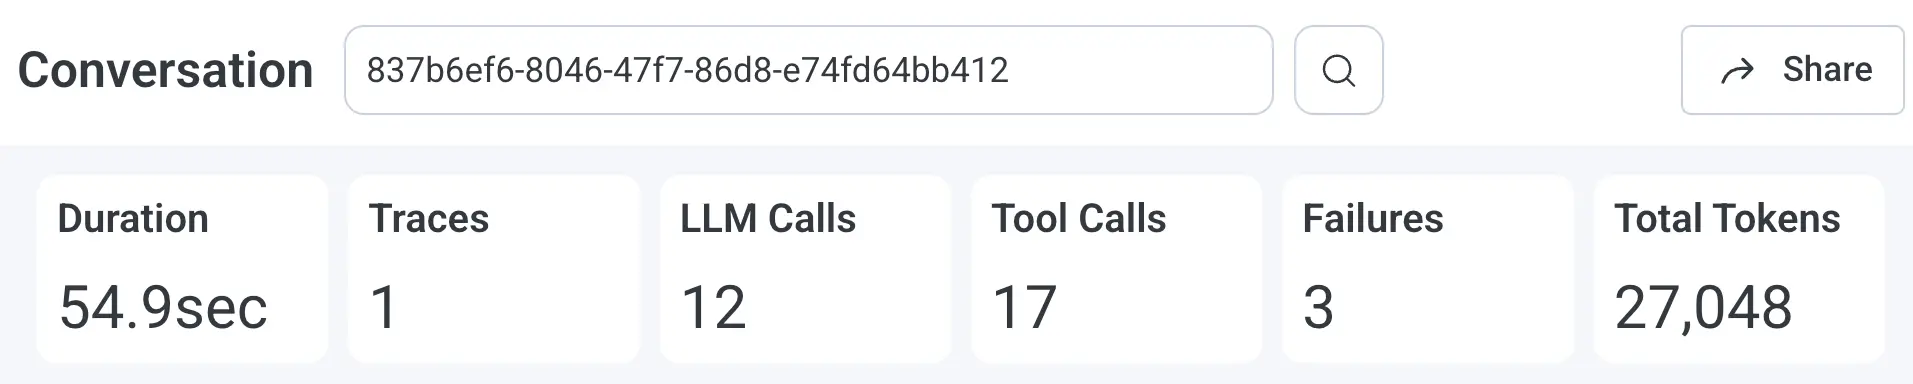
The whole conversation is right there: total duration, agents involved, tool calls, retries, and a red failure count at the top. Toggle "Show Failures Only" and the noise drops away. The failing tool invocation lights up: it called a rate-limited payments API six times before the agent gave up. Click in for the prompt, model, tokens, retry history, and the full trace waterfall connecting that AI-layer decision to the 502 from payments.
Five minutes. Done.
Why your current tools don't get you there
Dedicated AI observability tools stop at the model and can't follow the trail into your downstream application and infrastructure spans. Traditional APMs have no concept of an agent conversation. To stitch them together mid-incident, you're copying timestamps and praying trace IDs line up. The root cause of an agent failure can be anywhere between the LLM and downstream services, and your tools aren't built to follow the thread.
What Agent Timeline does
Agent Timeline gives you a conversation-first entry point. You start at the conversation-level and drill down, rather than reasoning upward from a single span into "what was the agent even trying to do."
Failures are first-class navigation primitives, not data you have to hunt for. Click a failed span for the full picture: prompt, tokens, model, tool name, error reason, and, most importantly, the full trace waterfall connecting that AI-layer span to whatever happened downstream.
How it works
Agent Timeline runs on the high-cardinality, event-based foundation Honeycomb has had for a decade. That foundation is perfect for the agent era, since agentic systems produce the rich, high-cardinality telemetry that breaks tools built around pre-aggregation and indexing.
Instrument your agents with the OpenTelemetry GenAI Semantic Conventions, send your spans to Honeycomb, and Agent Timeline binds them together by conversation via the conversation_id attribute. Your instrumentation stays portable: standard OpenTelemetry spans, no Honeycomb-specific SDK, no vendor lock-in. Agent Timeline works out of the box with any framework emitting the required OpenTelemetry GenAI spans. Check out our Agent Instrumentation Guide for more info.
Agent telemetry often contains sensitive data, so Agent Timeline supports production-safe instrumentation patterns: capture full prompts when appropriate, send metadata-only spans when needed, or apply redaction before data reaches Honeycomb. Conversation structure, failure signals, and trace context are preserved regardless of what content you emit.
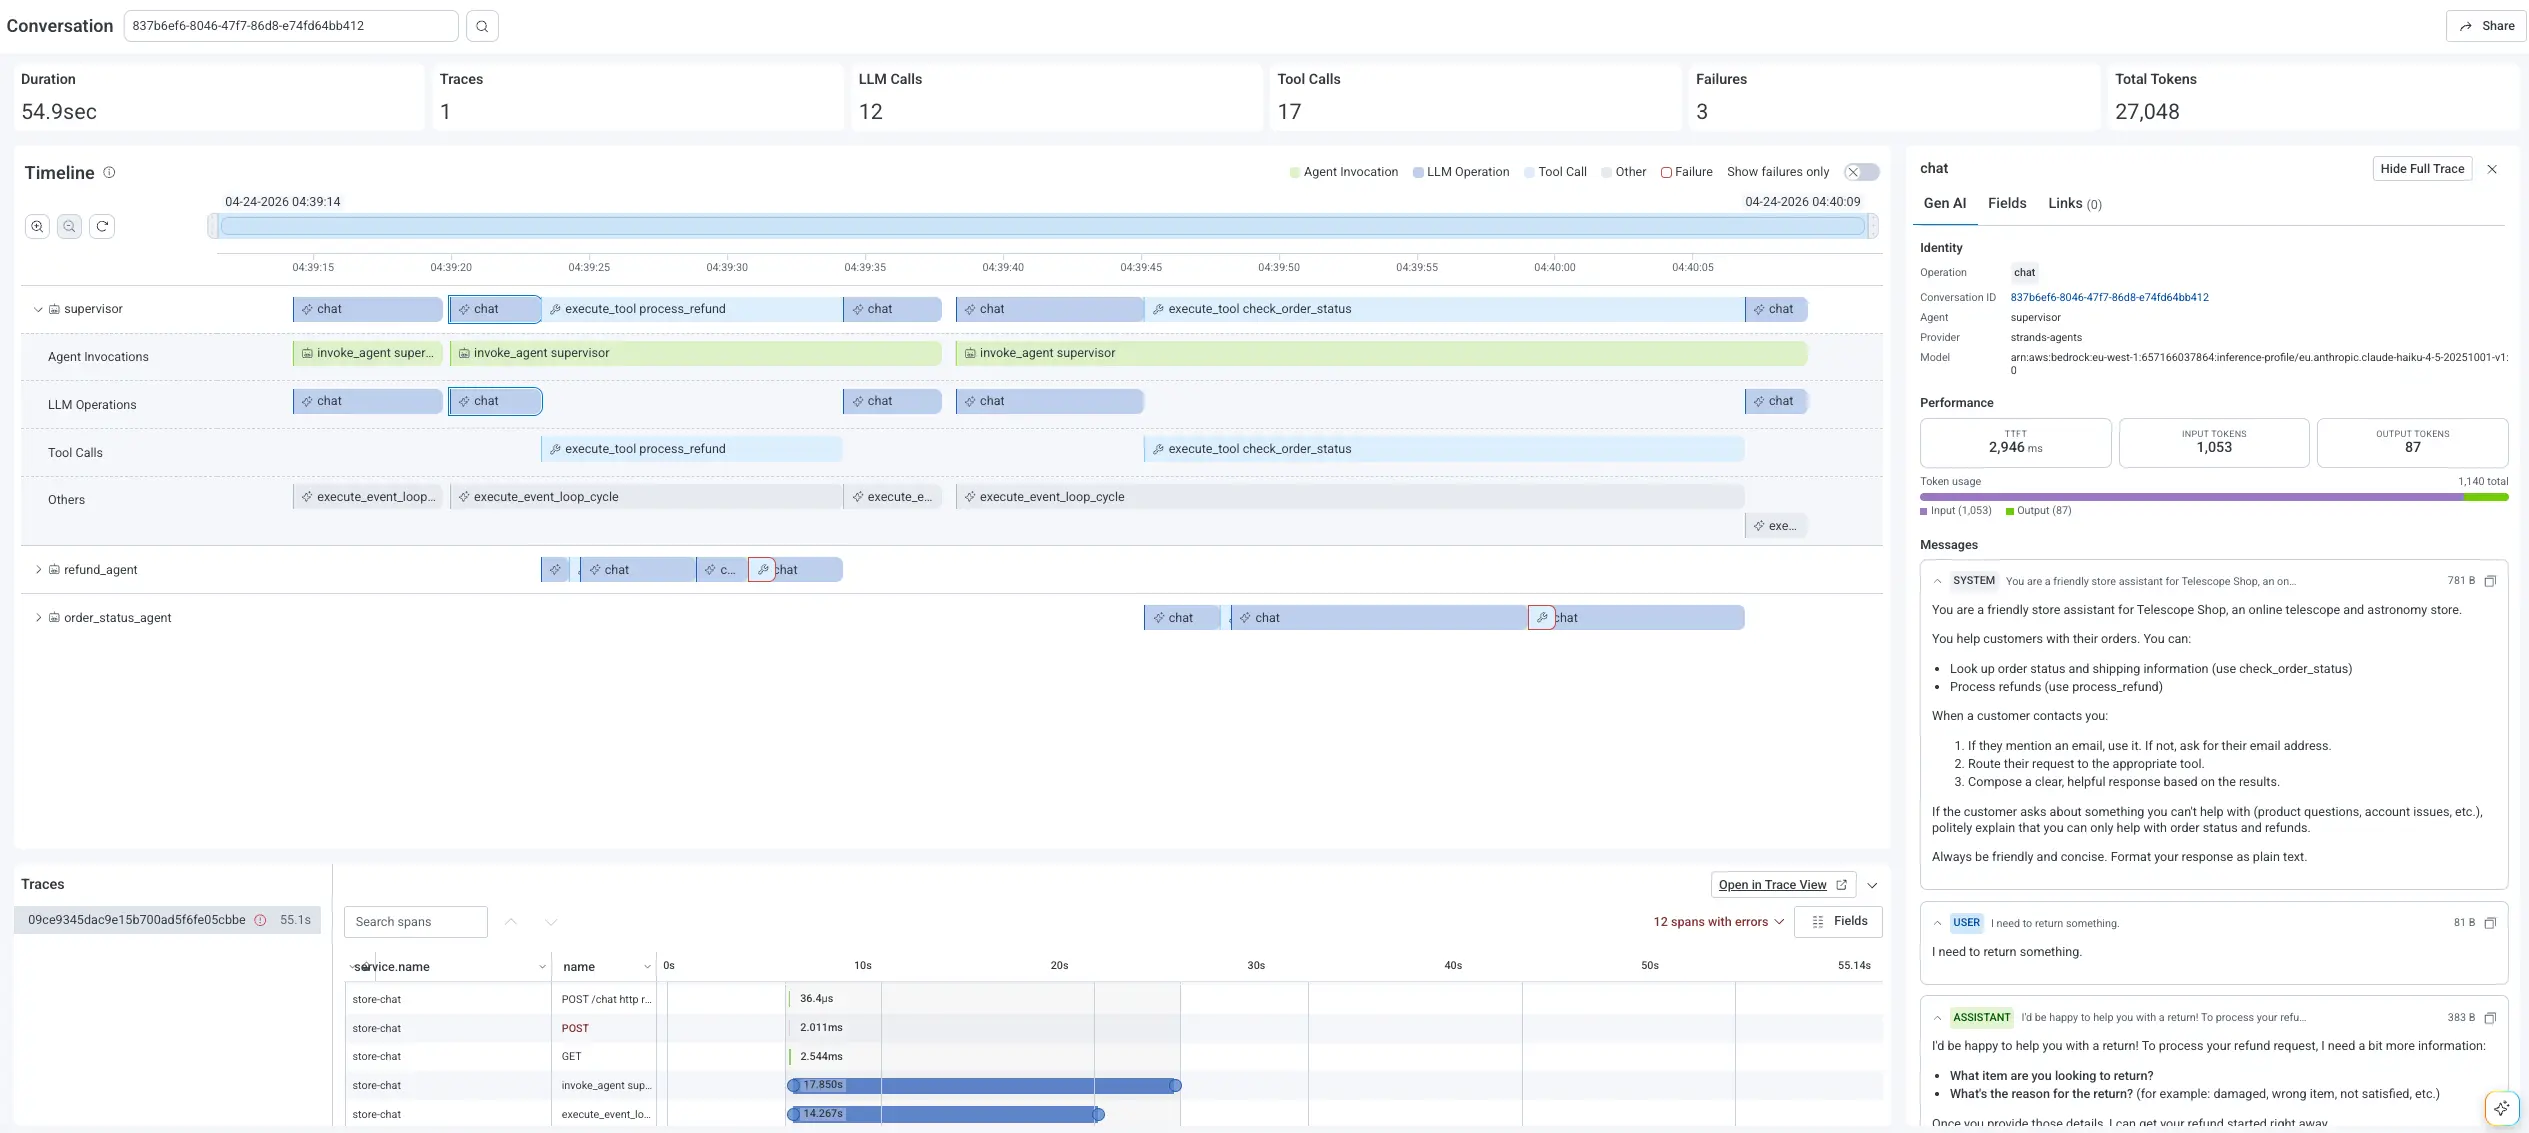
A quick tour of the UI
Conversation summary
Top-of-screen view of duration, model calls, tool calls, agents, retries, escalations, and failure count. Your "How bad is it?" view.
Agent lanes
Horizontal lanes show parallel agent execution and handoffs so a misbehaving agent stands out visually instead of buried in nested traces.
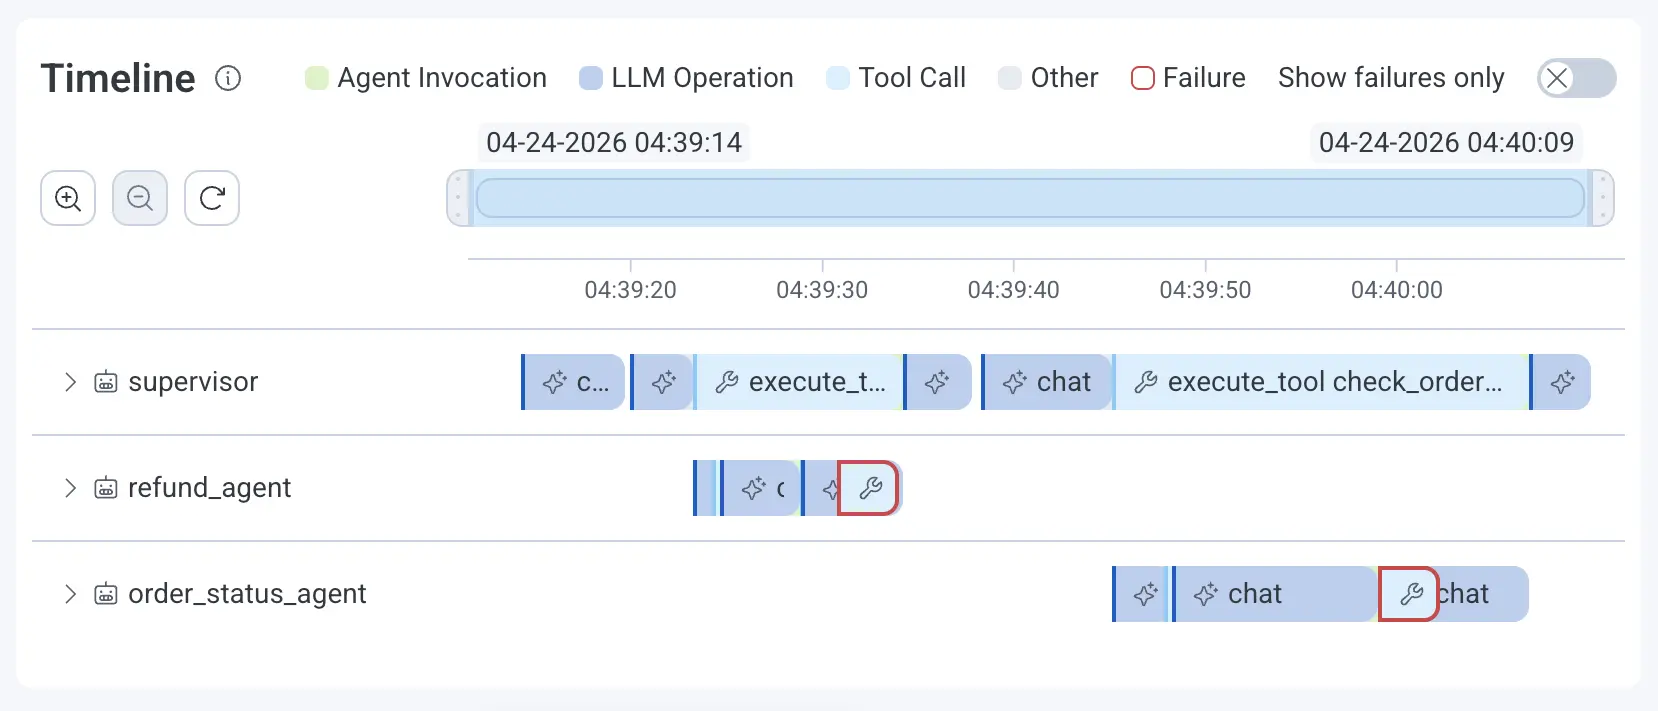
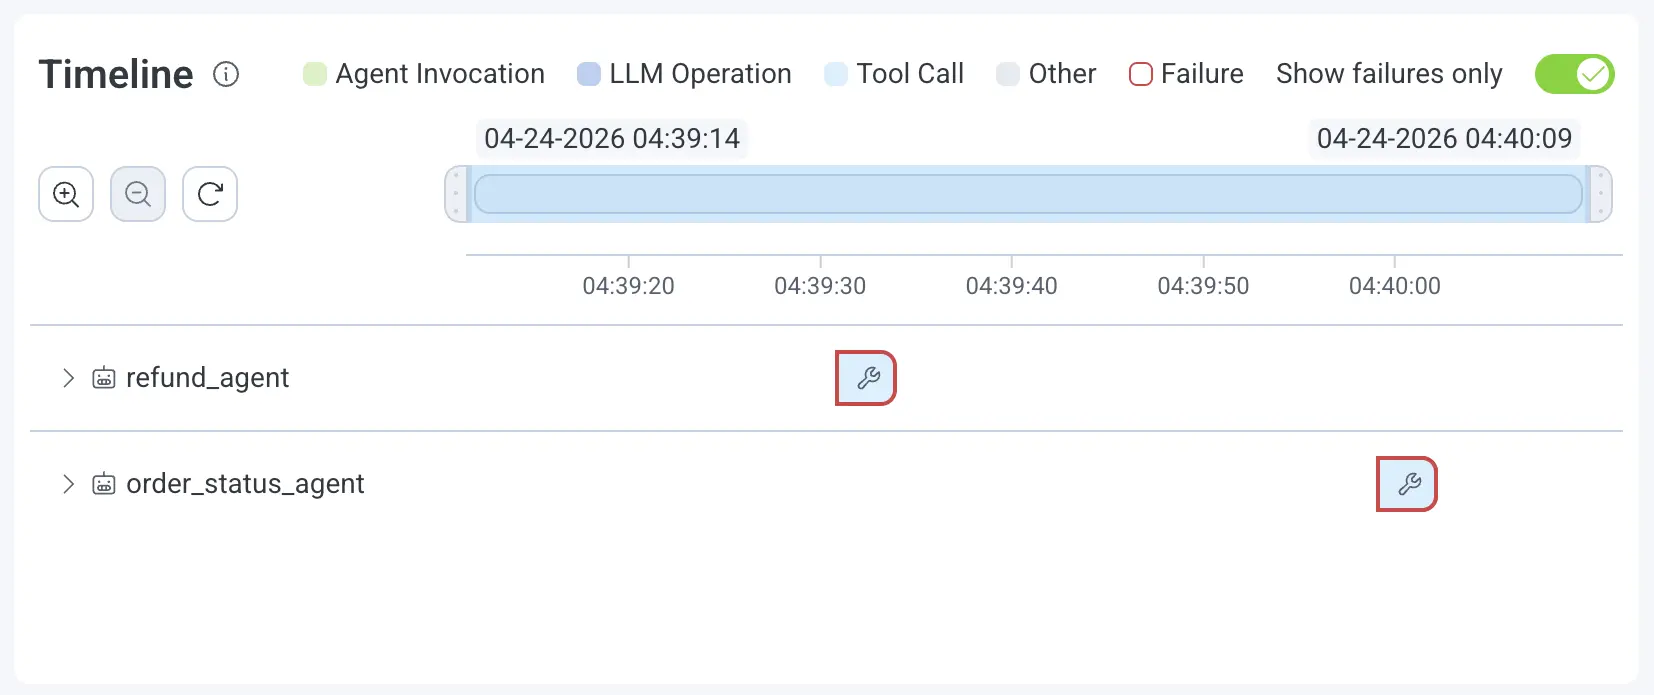
Failure-first navigation
Failed spans are highlighted inline. Toggle "Show Failures Only" to filter down to just what matters when an incident is moving fast.
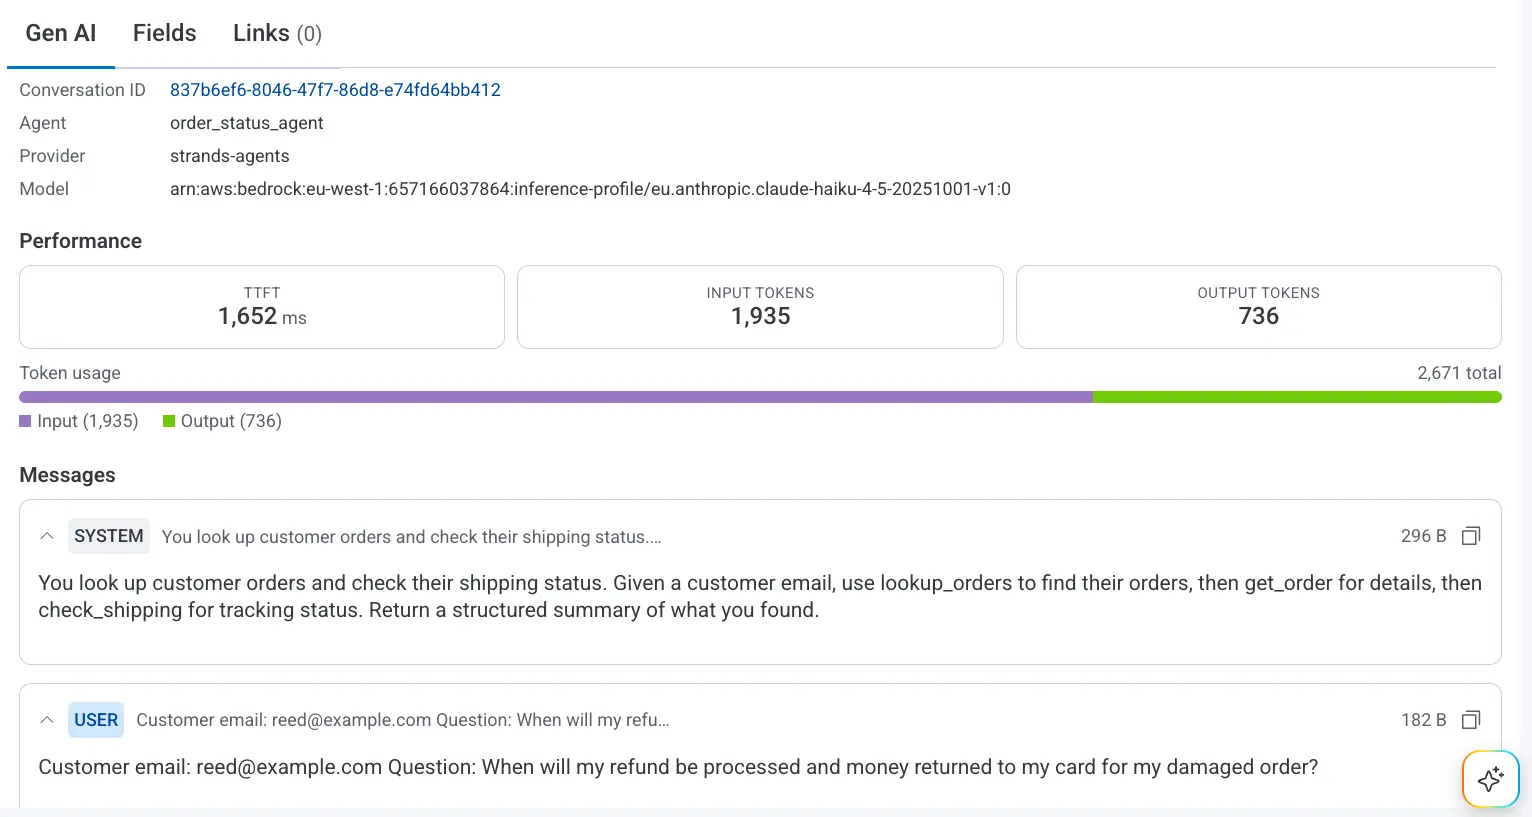
Gen AI panel
Click any AI span for full Gen AI detail: prompt, completion, tokens, model, tool name, error type. Quality signals you emit (eval scores, hallucination flags, reviewer labels, user feedback) attach as span attributes alongside cost and performance.
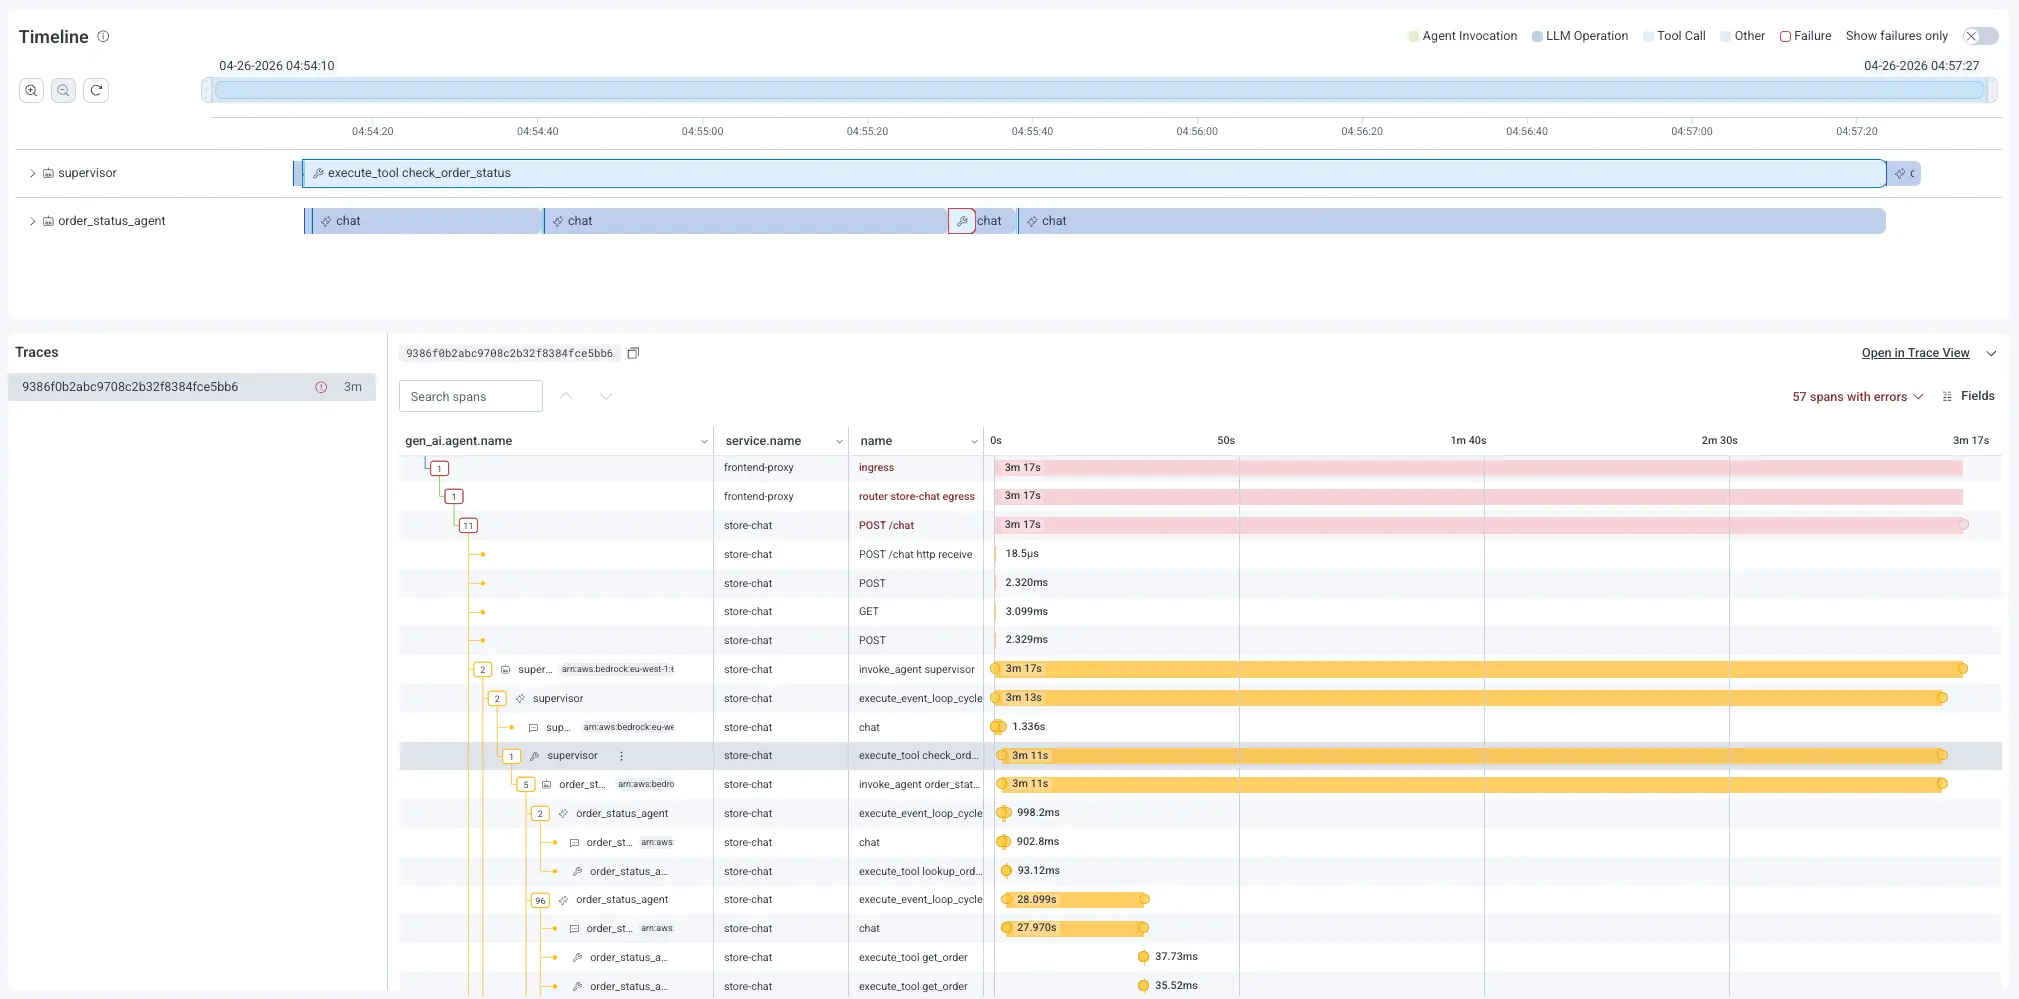
Full trace waterfall
Pivot from any Gen AI span into the full trace waterfall, where AI-layer behavior connects to backend root cause in one view. No tool-switching required.
When one conversation isn't enough
Sometimes, the trail leads beyond a single conversation. Pivot from Agent Timeline into Honeycomb Canvas, our multiplayer AI co-pilot for system-wide investigation, and ask the bigger question across your whole platform. One investigation, two modes, zero tool-switching.
See it in action
Get early access
Agent Timeline is now available in Early Access. If you're running AI agents in production and you're tired of flying without a flight recorder, we'd love to show you what it can do.
Already sending OpenTelemetry from your agent framework? Agent Timeline lights up automatically. New to instrumenting agents? Start with our Instrumentation Guide.