How Canvas Powers the AI Agent Development Feedback Loop
AI agents need a real feedback loop, not just reactive debugging. This post walks through how Honeycomb's Canvas powers each stage—instrumenting agents with OpenTelemetry, understanding a single run, finding the problems worth fixing, shipping the fix, and proving it worked—plus tips for getting the most out of Canvas.

By: Jodi Sloan
Canvas Is Now GA: AI-Guided Observability for Modern Teams
We’re thrilled to announce that Canvas is now Generally Available (GA) for all Honeycomb users.
Read More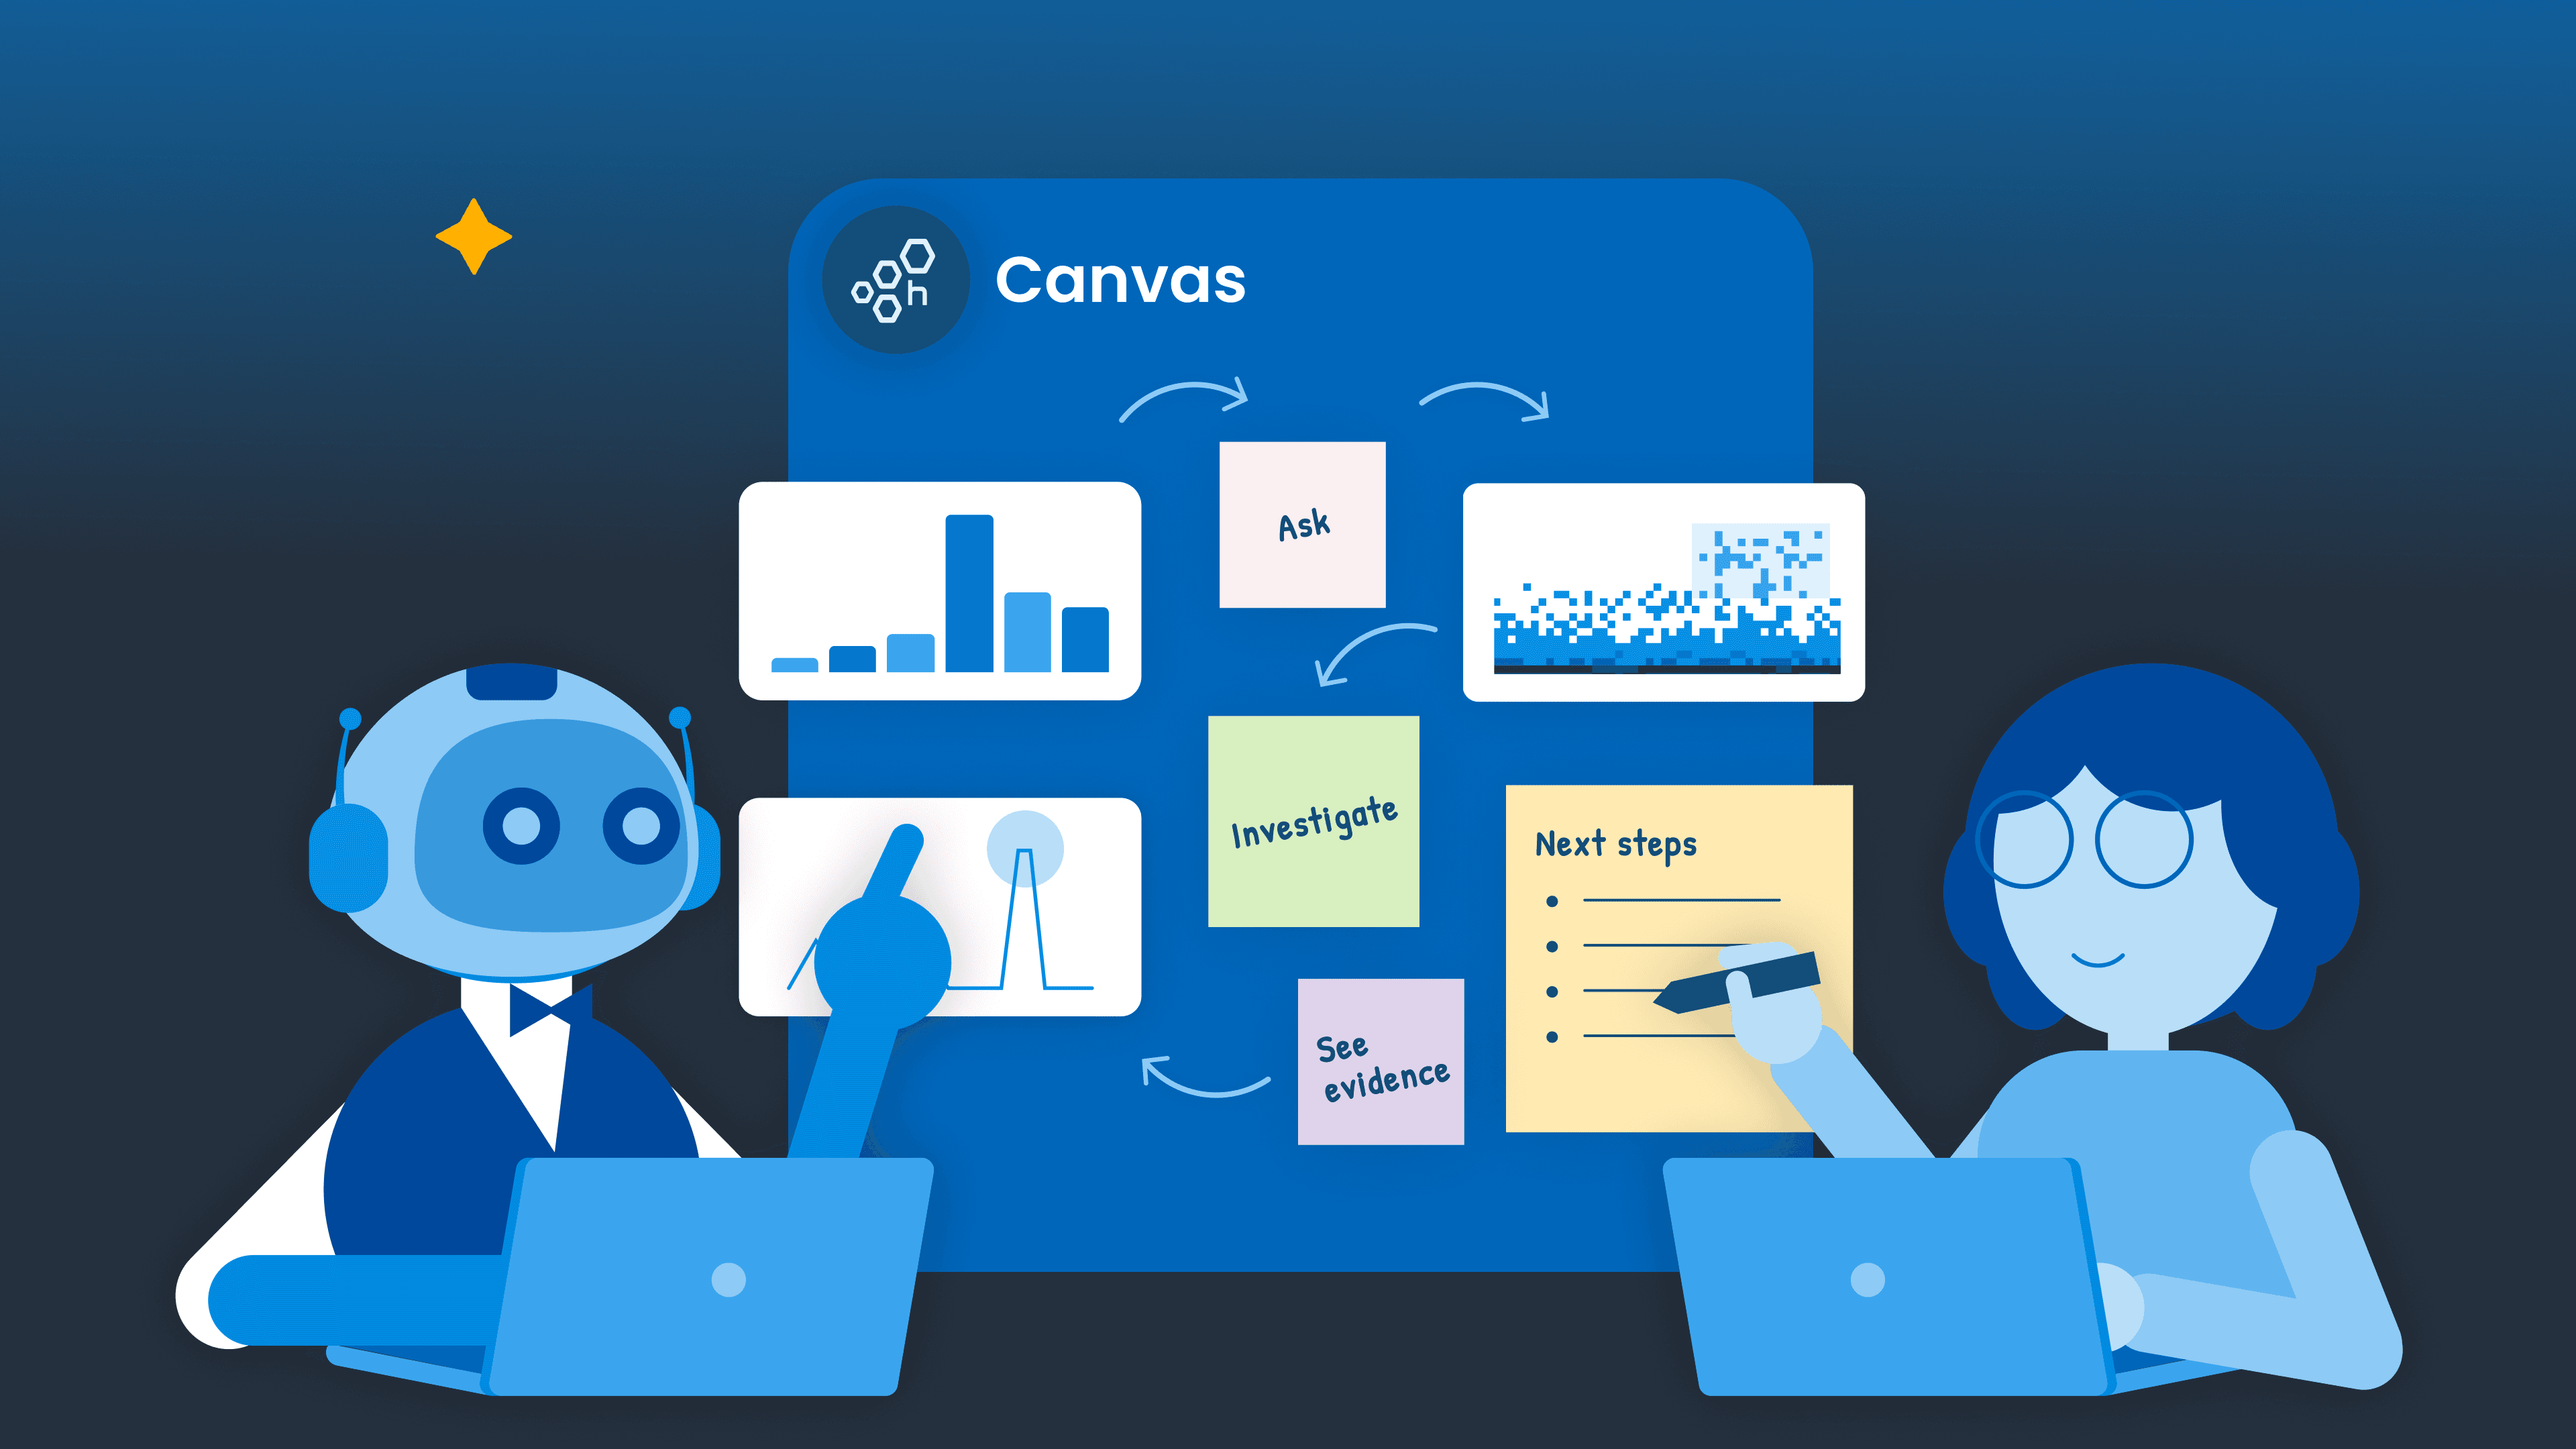
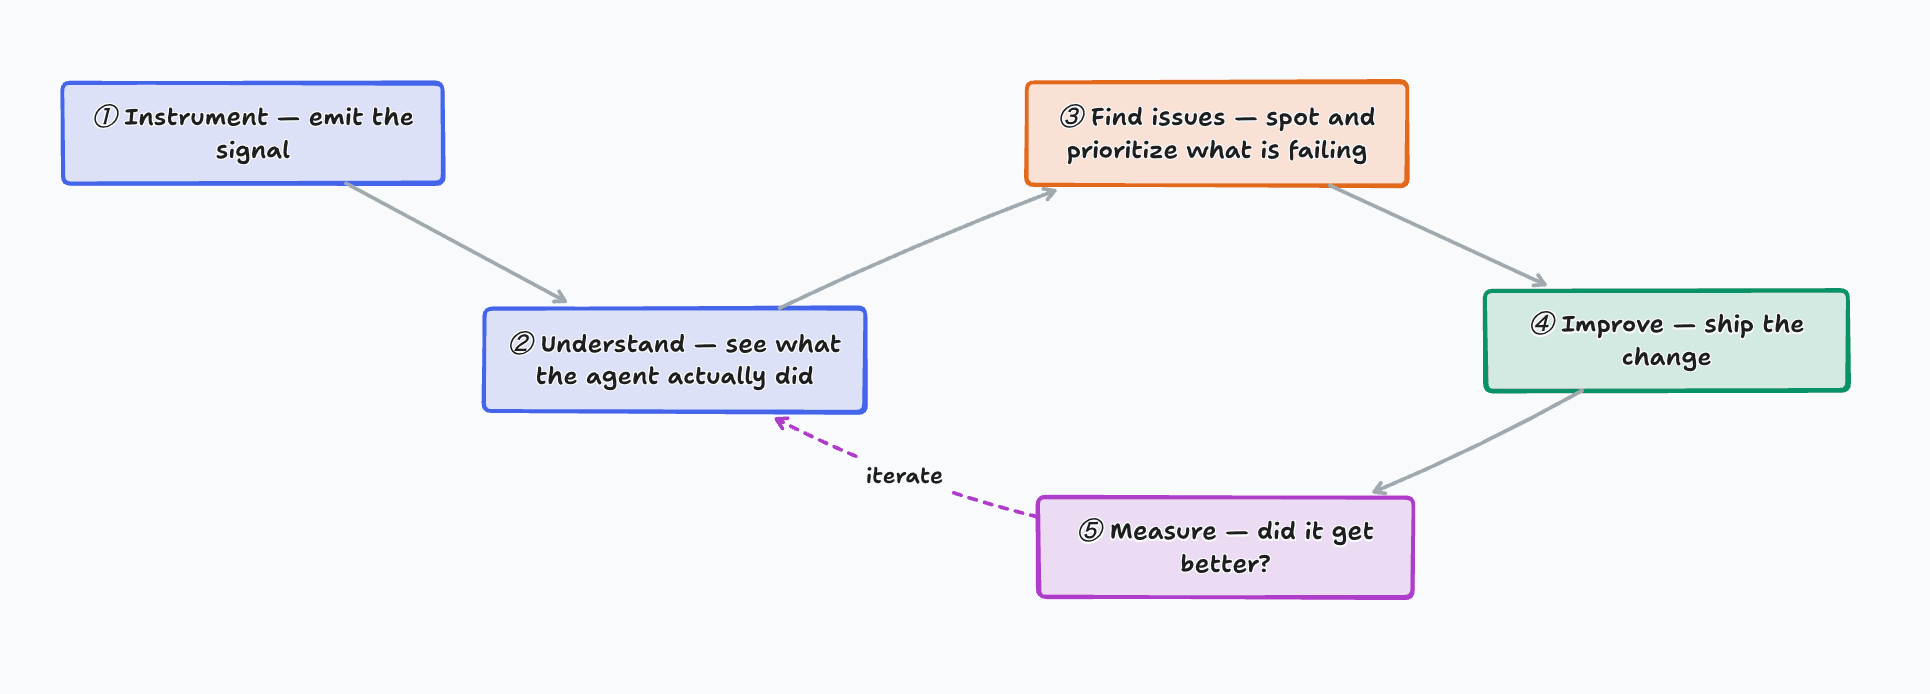
For teams building AI agents, the feedback loop should already be a familiar idea: watch how the agent behaves, find what needs improvement, ship a change, and measure the result. In theory, each turn builds on the last until the loop becomes a flywheel and your agent is getting more effective with each turn.
In practice, many of us are still in reaction mode. A user reports something strange, costs spike, or an eval score drops. Someone opens the logs and tries to reconstruct what happened with a grep and a prayer. The immediate question gets answered, maybe, but the next investigation starts from scratch.
A real feedback loop starts from questions, not just failures. How is the agent doing at its task? Where does it struggle? What drives its cost and latency? Did the last change help? The answers should guide iterative improvements: better instrumentation, sharper evals and test cases, prioritized fixes, and evidence those fixes worked.
The trouble is that every part of the loop tends to live somewhere different. Telemetry lives in Honeycomb, your source and deploy history are in GitHub, the work is tracked in Linear, while decisions and context disappear into Slack threads. Honeycomb's Canvas brings that context into one shared investigation: it's the workspace where you and your personal Honeycomb agent look at your production data together. It queries your telemetry, tests hypotheses, and finds patterns across thousands of runs, organizing evidence and findings on a shared, infinite canvas. With a growing list of integrations like GitHub, Linear, and Slack, it can connect those findings to the code that produced them, turn them into tickets or proposed changes, and return to the data to measure whether the change worked, closing the loop instead of leaving you with a diagnosis and a to-do list.
Canvas doesn't just help with one stage of the feedback loop; it orchestrates the whole thing: instrument, investigate, prioritize, improve, validate.
We know this because we used Canvas to build Canvas. While developing its investigation agent, we pointed Canvas at its own telemetry to find where the agent was underperforming, ranked issues by severity and frequency, turned them into Linear tickets and prompt changes, and compared results before and after. Most importantly, it has helped us identify issues before our users do.
In the rest of this post, we'll walk through that loop one stage at a time, starting with the telemetry that makes everything else possible.
A note on availability: Canvas' connectors, including GitHub and Linear, are currently in Beta, with general availability expected in fall 2026. See the beta program details for what that means.
Stage 1: Instrument your agent (so there's something to look at)
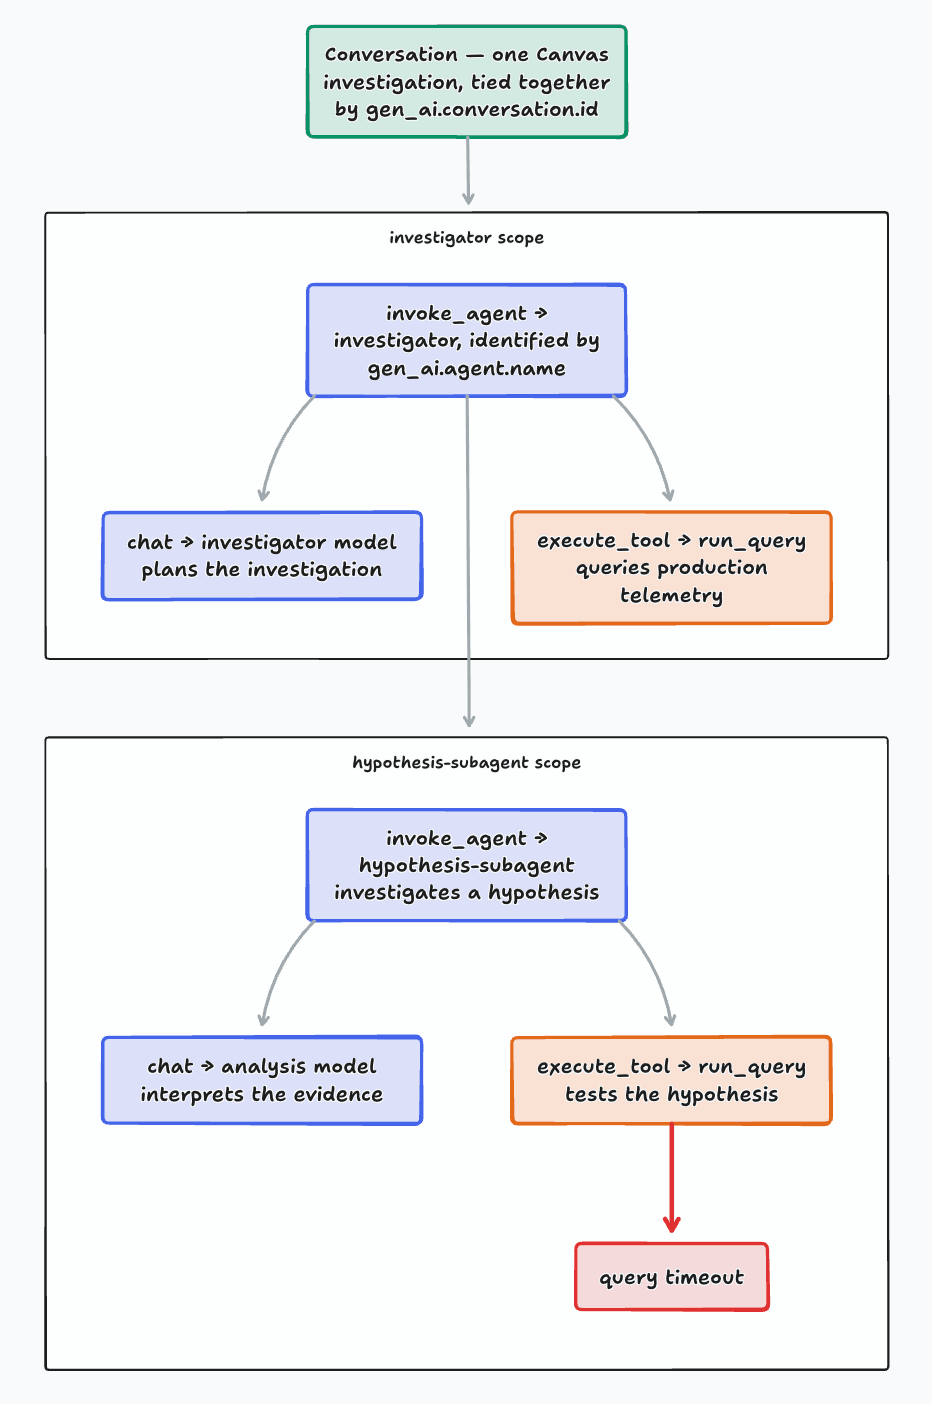
Before you can debug anything, your agent has to leave a trail. Telemetry is that trail: every model call, tool call, and handoff, with timings, tokens, and errors attached. Each step is a span; the spans from one request form a trace; and the traces from one full agent run share a conversation so you can read the whole thing as a single story. Without telemetry, you can't investigate. This is the one stage you can't skip.
Shared vocabulary: OpenTelemetry GenAI conventions
How does a tool know which spans are model calls versus tool calls? With naming standards, of course! OpenTelemetry (OTel) is a vendor-neutral way to emit telemetry, and its GenAI semantic conventions name the AI-specific pieces (conversations, agents, tools, tokens, prompts) all under a gen_ai.* prefix. Instrument to this standard and Honeycomb reads your data with no custom glue, and you stay portable if you add or switch backends later.
The three attributes that make Agent Timeline work
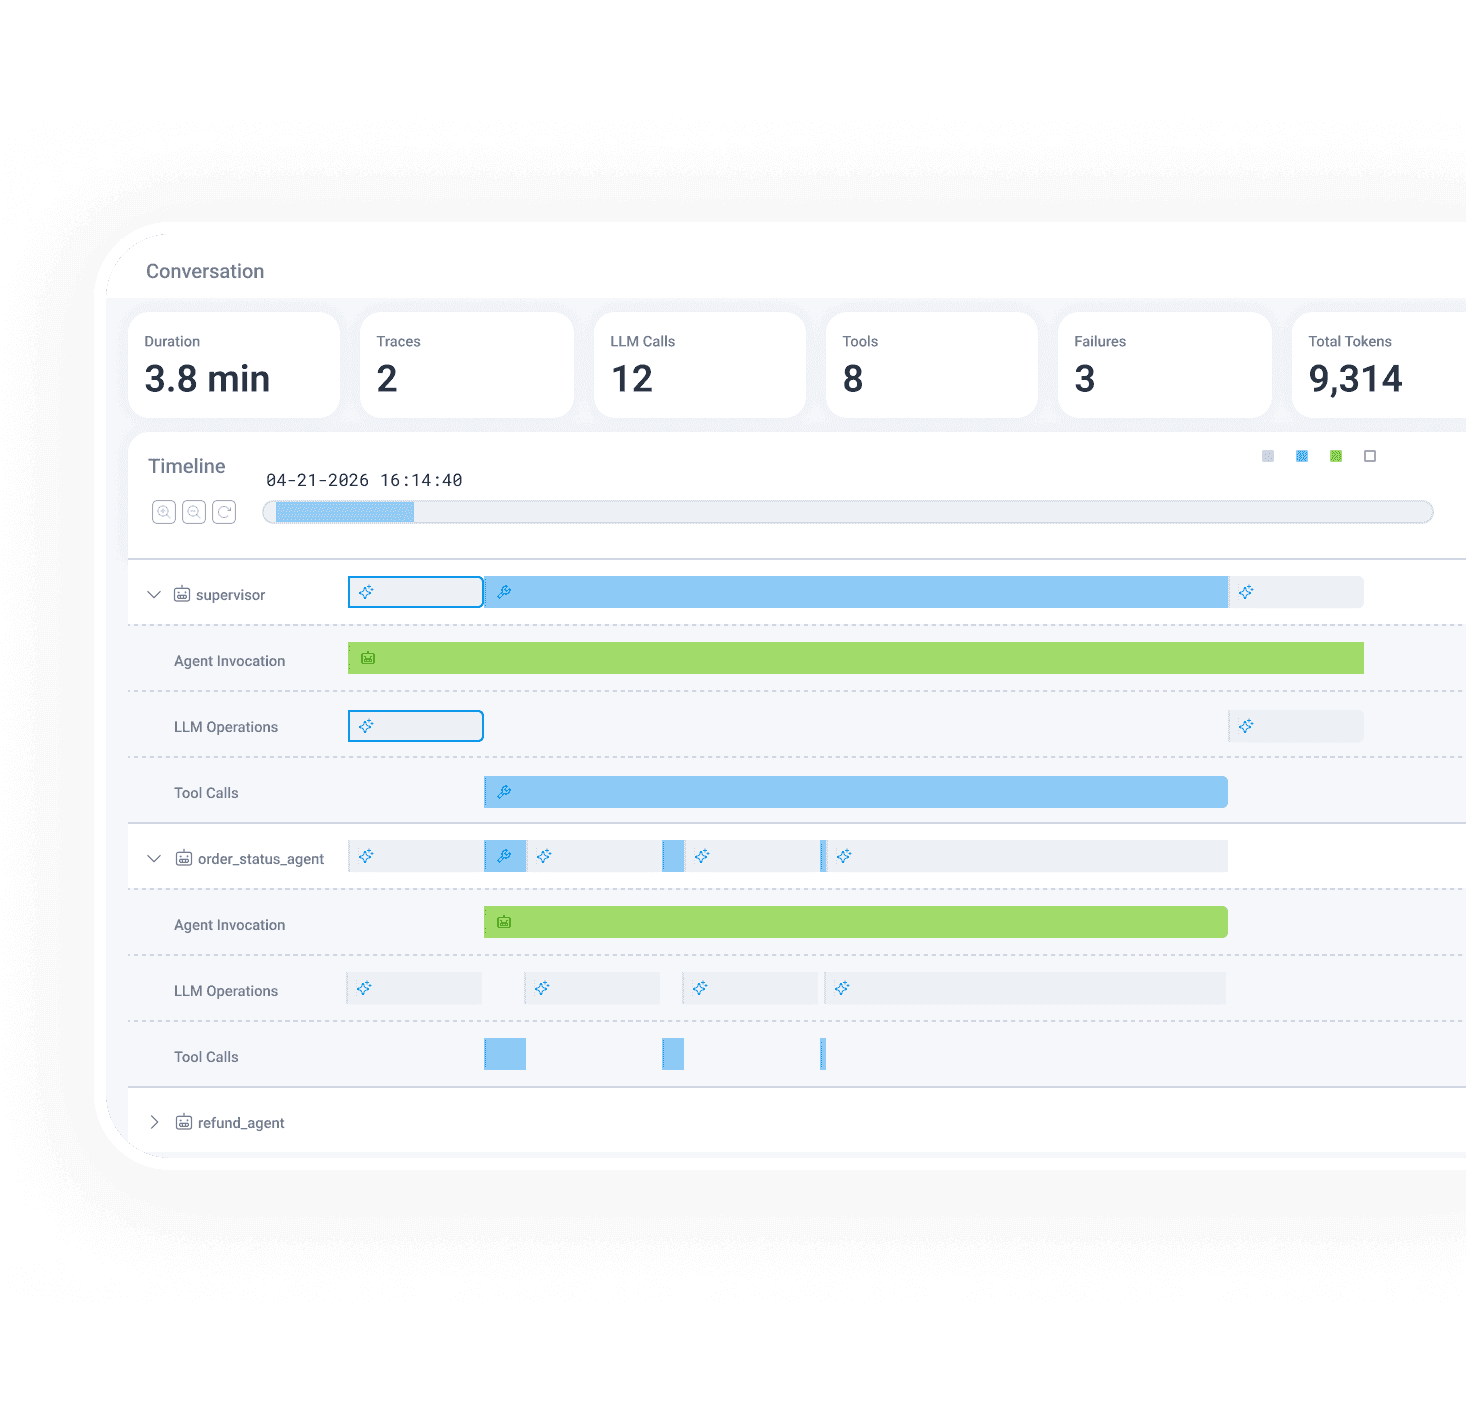
Honeycomb's Agent Timeline is the view that renders one agent conversation as a readable story. It needs just three attributes on your spans to light up; the Agent Timeline instrumentation docs cover the full setup:
gen_ai.conversation.id:a shared ID stamped on every span that belongs to the same run.gen_ai.agent.name:which agent produced this span. In a multi-agent system, this is what lets the timeline give each agent its own lane instead of one undifferentiated blob. Give every agent and sub-agent its own distinct name; anything unnamed shows up as "Unknown."gen_ai.operation.name:what kind of step this is: a model call (chat), a tool execution (execute_tool), one agent invoking another (invoke_agent), a retrieval step (retrieval), and so on.
Get those three flowing and Agent Timeline works. Everything else enriches the picture.
Then, enrich it
Those three make the timeline work, but a handful more make it far more useful: token counts (your cost and context-bloat signal), the model name and version that answered, the finish reason, and each tool's name, arguments, and result, where a lot of "the model is broken" bugs turn out to be "the tool returned garbage." Capturing the actual prompts and responses lets you read a conversation exactly as the model saw it; because these can be large or hold personal data, you can record them in full, as metadata only, or redact them in your Collector first. And if you score outputs for quality, attaching evaluation scores as span events makes quality something you can query and trend. For the complete walkthrough, our Agent Instrumentation Guide covers instrumenting an agent with OpenTelemetry end to end.
Let Canvas find your gaps
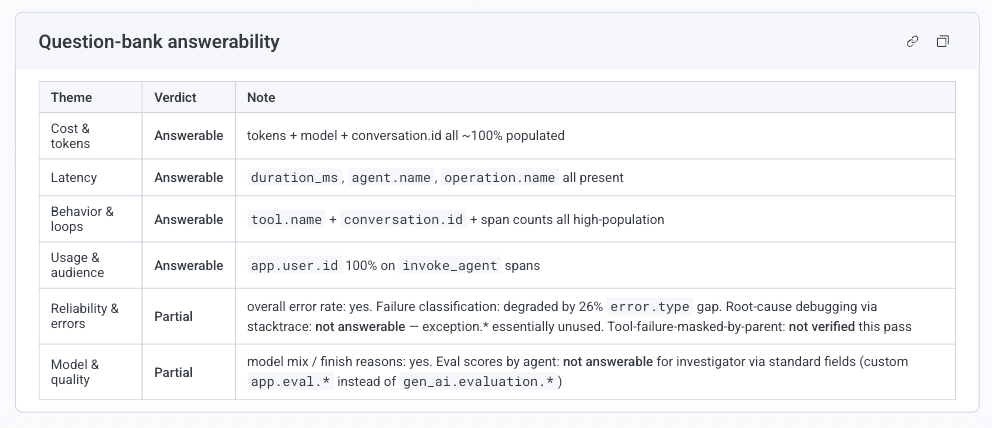
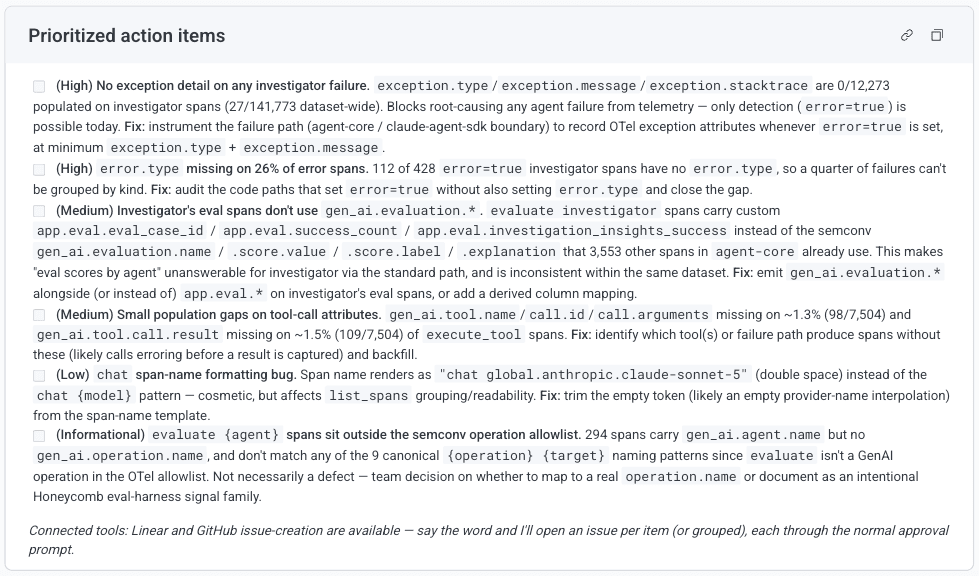
Canvas comes with a built-in skill that proactively audits your agent's telemetry in three ways.
- Evaluates adherence to OpenTelemetry's GenAI semantic conventions, identifying gaps or divergence
- Verifies telemetry meets the requirements from Honeycomb features such as Agent Timeline, GenAI panel, and cost accounting
- Builds a bank of common operational and business questions, then checks whether your telemetry can answer them.
This results in telemetry designed not only for debugging, but also for analyzing behavior, guiding improvements, measuring experiments, and demonstrating business value.
Simply open a Canvas and invoke the skill with your agent's name:
“/agent-instrumentation-audit audit the investigator agent”
For best results, enable the GitHub integration so Canvas can automate the fixes for you.
Stage 2: Understand what your agent did
With telemetry flowing, you can finally do the thing logs never let you: watch a single run play out step by step. Most investigations start here.
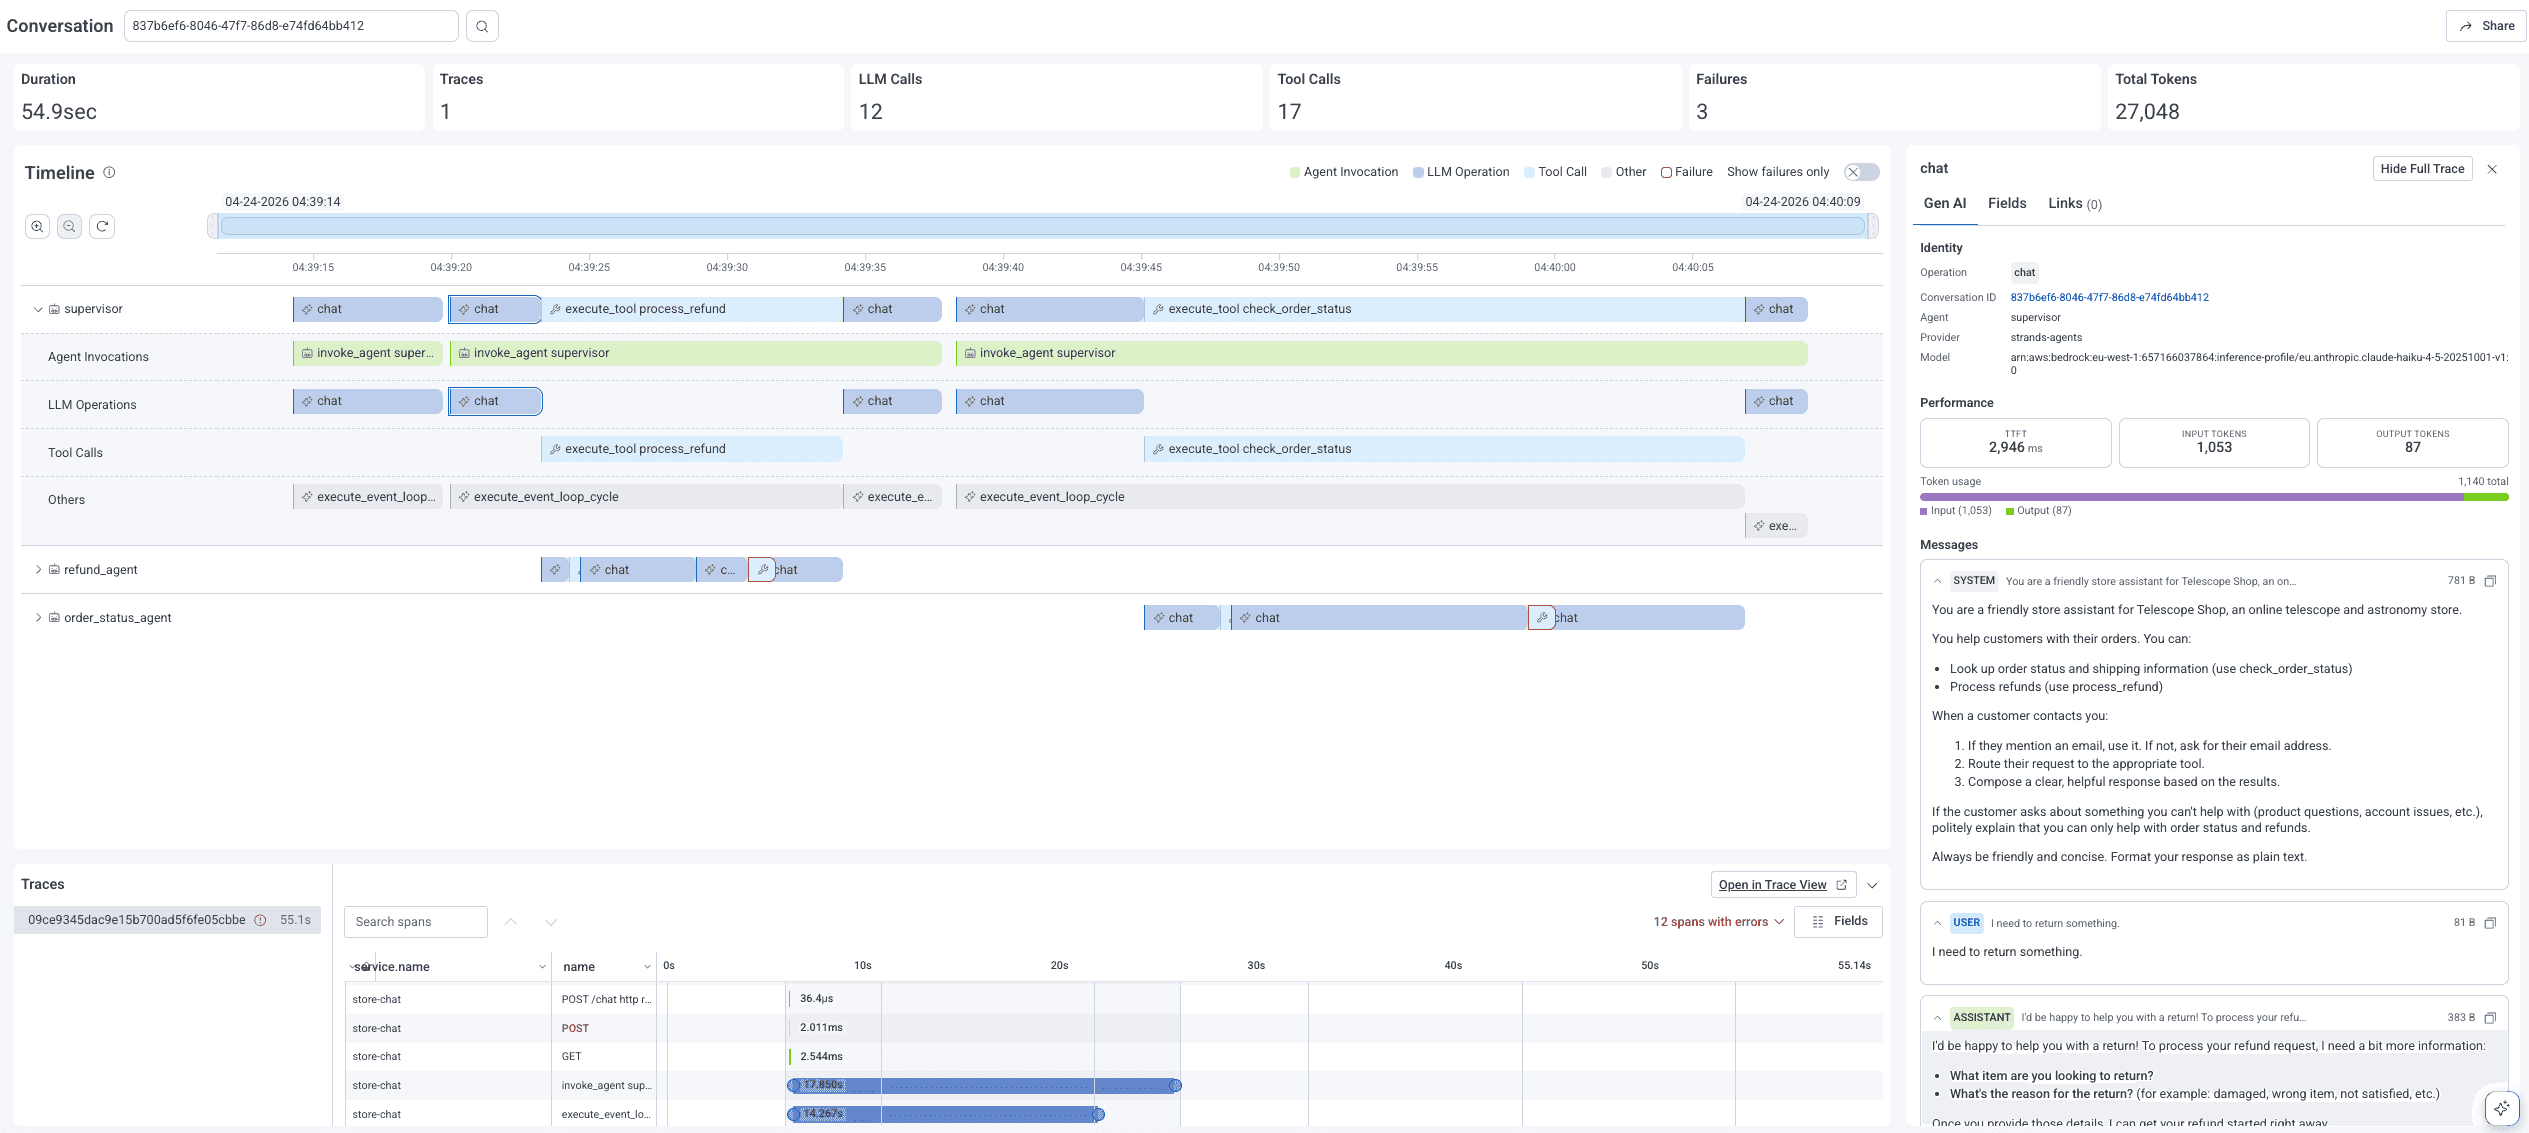
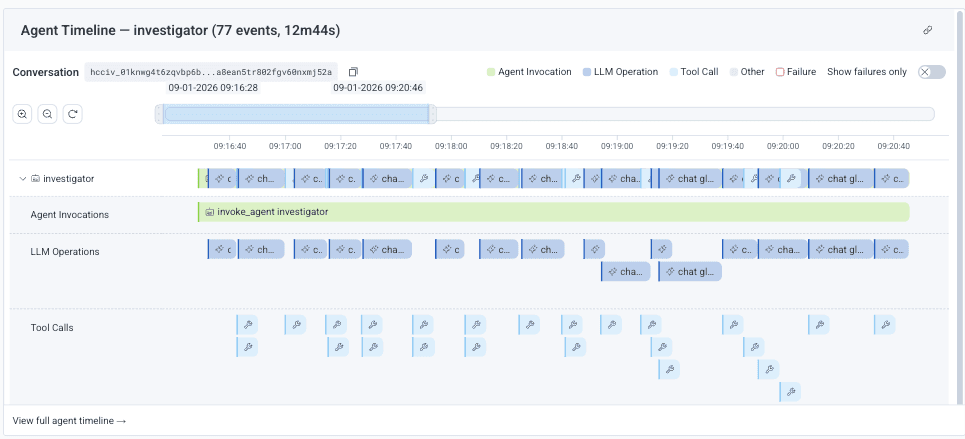
Open Agent Timeline and it reads top to bottom like a story. Click into any step and the GenAI panel shows what happened. This is the conversation as the model saw it, which is usually where the cause is hiding. And since these AI spans live in the same trace as your ordinary backend spans, the timeline keeps going past the model, into the database query or API call the tool made underneath.
You don't have to walk the timeline by hand. Canvas comes loaded with the skills and tools needed to query and understand agent sessions. Point Canvas at the conversation and ask:
“/conversation-investigation debug checkout agent conversation 7f3abde”
You can manually invoke the skill, or ask Canvas in plain language what you want to know about a session.
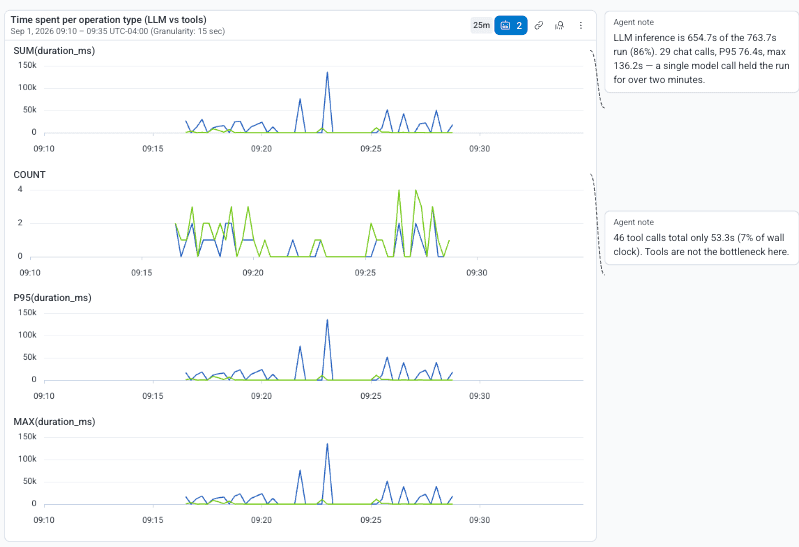
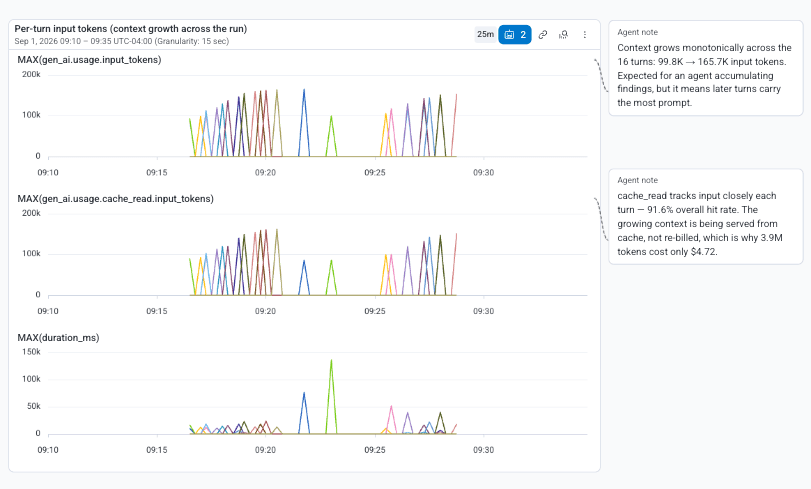
“Summarize the cost and latency for conversation 7f3abde on the checkout agent, broken down by operation and subagent. Identify the latency bottleneck and the reason for the excessive token usage.”
Canvas explores the session in depth, tests its hypotheses against the telemetry, and returns answers with links to the supporting queries. It can also drop the Agent Timeline onto the canvas with a deep link to open that conversation's full timeline whenever you want to inspect a step up close. Because this lives on a canvas instead of a chat thread, every human and agent can collaborate together in a shared workspace.
You can now read any single run and explain it. But one strange conversation is an anecdote. Next, let's zoom out: is this a one-off, or the visible tip of a pattern running through thousands of conversations?
Stage 3: Find the problems worth fixing
Zooming out means asking a different question: not "what happened in this run?" but "across everything my agent did this week, what keeps going wrong, and which of those is worth my time?" You can't read thousands of conversations one by one, and you shouldn't try.
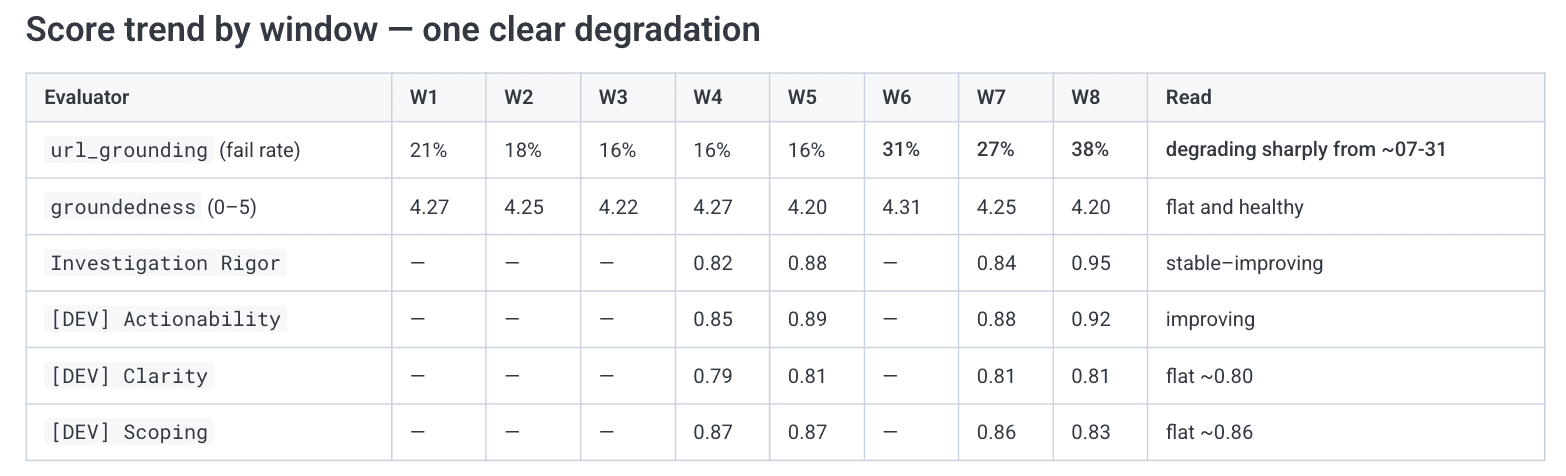
Start reading signals about conversations. Some, you may already emit; others are cheap to add: evaluation scores on your outputs, classifier labels like topic, complexity, or intent, and user feedback such as thumbs up/down. Point Canvas at those and it can find patterns across thousands of runs without anyone reading them one at a time.
Mostly, you just ask:
“Summarize our eval scores and find patterns in the low-scoring ones.”
“Pull the conversations with negative feedback and cluster the themes.”
“Group failures by question topic and complexity, then rank them by volume.”
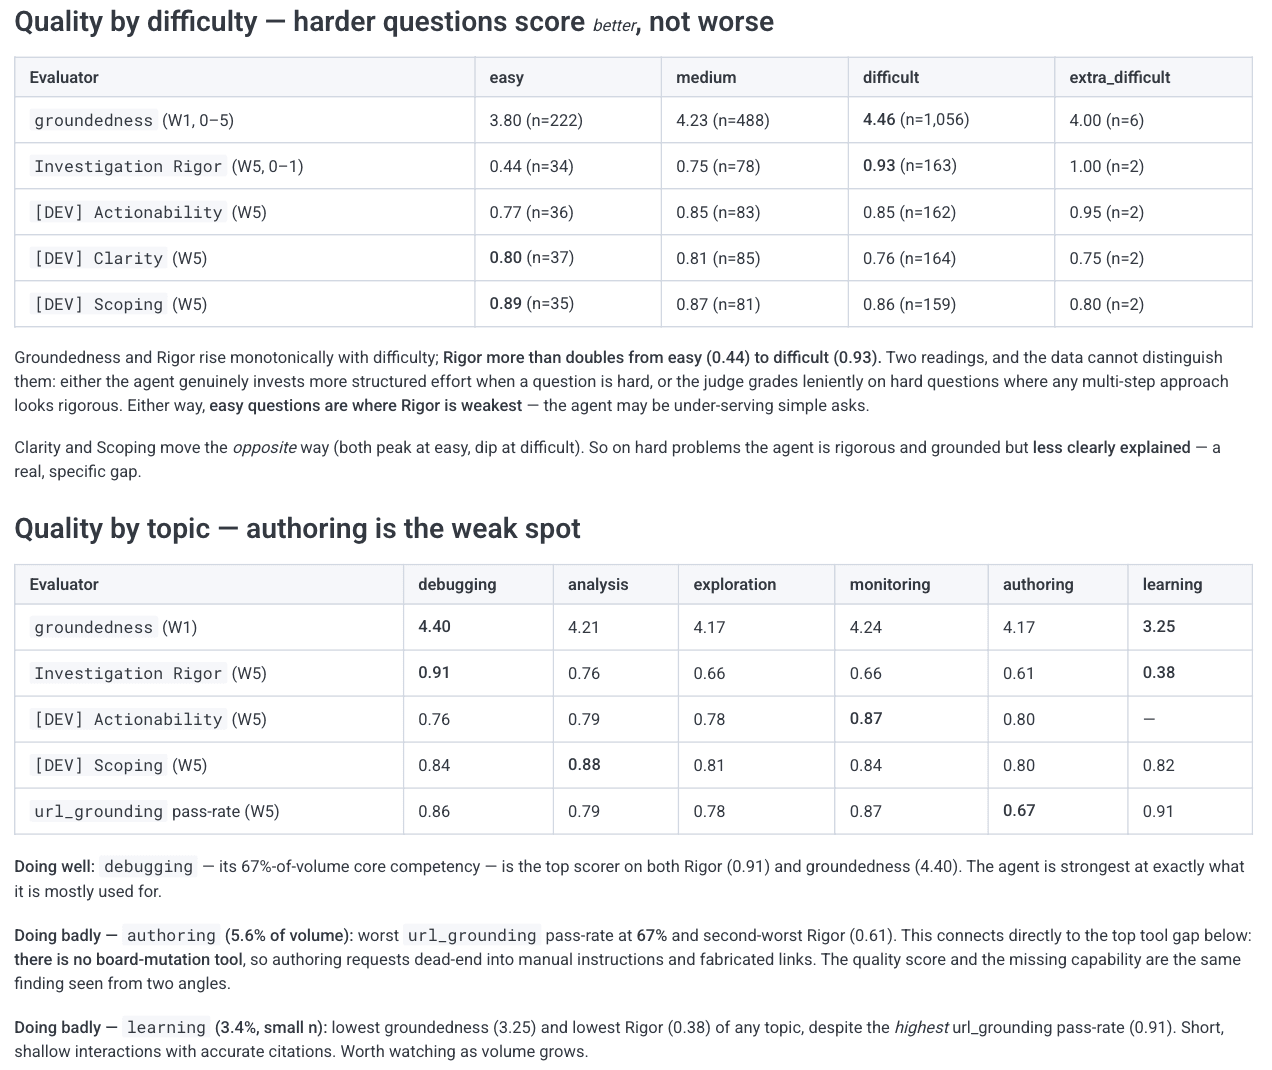
Two more questions worth asking of any agent in production: what is it costing, and why is it slow? Ask Canvas to rank your most expensive conversations by agent and operation, check whether prompt caching is paying off, or flag confusion loops that burn tokens without making progress; or point it at speed: the latency distribution, time to first token across agents, and which tool calls sit on the critical path.
“Show me this week's most expensive conversations ranked by total token usage, broken down by agent and operation, and tell me what's driving the cost in the top few.”
“Show me a distribution of time to first token across my agents, and flag the slowest paths. Pull a trace for one slow conversation and show me where the time goes.”
Canvas decides how to answer by running queries, sampling representative runs, or reaching for BubbleUp when a numeric attribute is the tell. You describe the pattern you're hunting; you don't need to know the mechanism. Under the hood, it can fan a big question out into parallel investigations then weigh them and rank the likeliest causes.
A dozen symptoms often decrease into two or three underlying causes, and one of those usually accounts for most of the pain. That ranking is what tells you where your next fix should go.
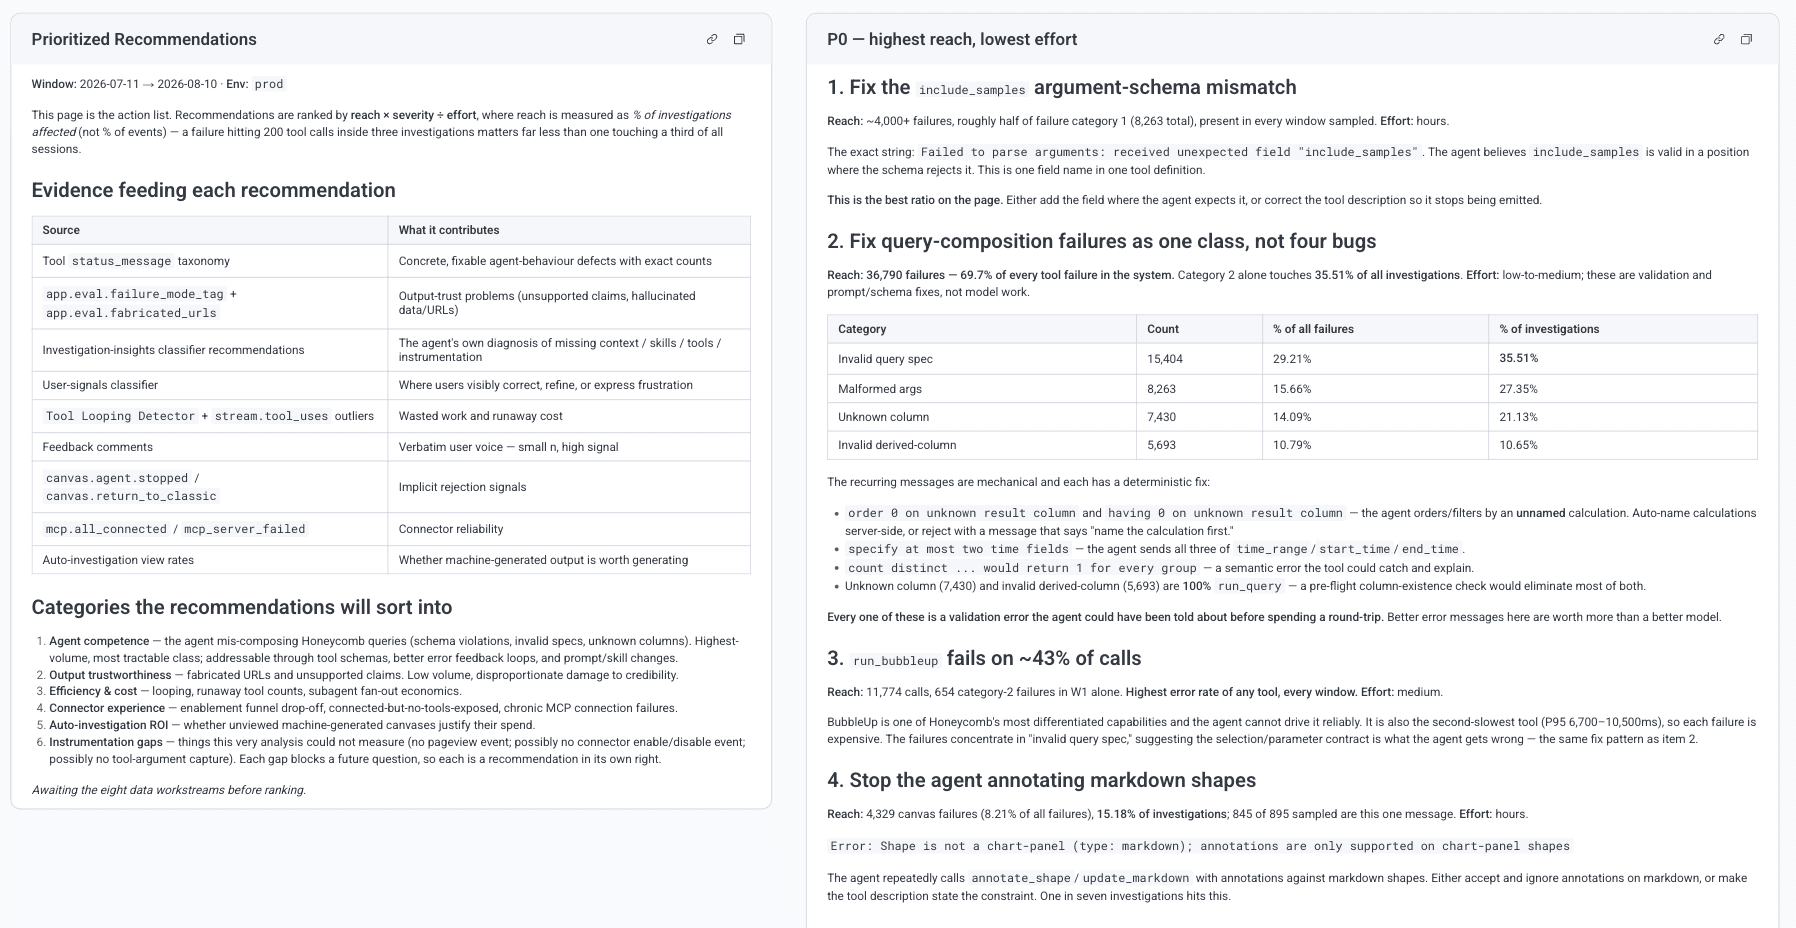
You go from "I'm debugging" to "I understand my agents' failure taxonomy." That taxonomy is what tells you where to invest next. Now it's time to turn those insights into action.
Stage 4: Ship the fix
Turning insight into action is the step most observability tools leave to you: they surface the problem, then hand you off to another tab to write the ticket and edit the code. Canvas stays in the loop, because it's wired into the tools where the fixing happens.
Fixes for an agent are rarely a one-line code patch. More often it's a prompt that needs rewording, a tool description that misdirects the model, a retrieval step pulling the wrong context, a missing guardrail, or a hard question that should route to a stronger model or specialized workflow. The failure mode you prioritized a moment ago usually points at one of these.
With the GitHub and Linear connectors enabled, Canvas can act on it from inside the investigation:
- Open a pull request.
- File a Linear ticket that captures the failure mode with its evidence.
- Correlate regressions with recently-shipped code changes.
Write actions always run through an approval step. Canvas drafts the change and shows you exactly what it will do, and nothing merges, ships, or gets filed until you approve it.
“Prioritize the observed failure modes by severity and frequency and open Linear tickets in the Checkout Agent project. Assign them a priority and mark their status: To do.”
“Draft a PR against honeycomb/checkout that rewords the return-policy prompt to fix the failure mode we just found, and open a Linear ticket linking the five worst conversations as evidence.”
Because the ticket and PR are born inside the investigation, they carry the context with them. The reviewer sees the failing conversations, and the change you just shipped becomes the thing you check next: did it work?
The last turn of the loop is proving it worked.
Stage 5: Prove it worked
With deterministic software, you fix a bug and it stays fixed, but agents don't give you that closure. The same change can help one kind of request and hurt another, and because outputs vary from run to run, "it looks better when I try it" isn't evidence. You need to compare the same signals, before and after, on real traffic.
This is where the version tag you set while instrumenting earns its keep. If your spans carry gen_ai.agent.version (or service.version), Canvas can line up the failure-mode rate, eval scores, cost, and latency for the old version against the new one—or one experiment variant against another—without anyone guessing from deploy timestamps.
“Compare the URL-hallucination failure rate and average accuracy score for the investigation agent before and after v2.5. Did the fix reduce the failures without dropping quality anywhere else?”
Canvas pulls both slices, charts them side by side, and tells you whether the number you were targeting moved—and whether anything else moved with it.
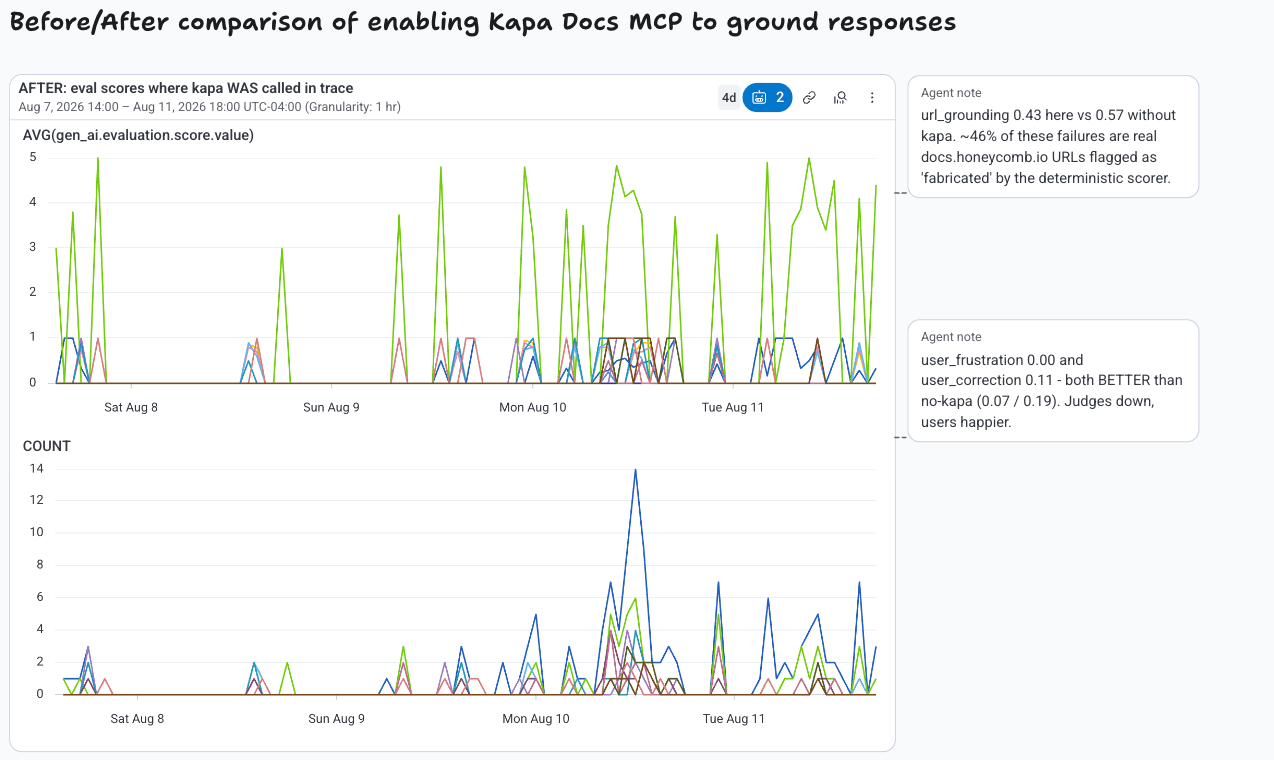
The riskiest changes are the ones that fix what you were looking at and break something you weren't, so measuring needs to include catching the slow regressions that never trip an alarm. Chart eval scores over time, and when a line bends, the GitHub connector lets Canvas read the PRs that shipped around that moment and point at the diff that most likely caused it.
Either way, you've closed a turn of the loop with evidence instead of hope: the fix worked or it didn't, and you already know to keep digging. And because the comparison, the scores, and your notes all stay on the canvas, the next person starts from a sharper baseline instead of a blank page.
Proving a fix once is one thing; keeping it proven is another. Two moves turn this one-time check into ongoing monitoring:
- Save the comparison as a board. Ask Canvas to promote the before/after view into a Honeycomb board and the snapshot becomes a living dashboard the team keeps watching instead of a one-off on an ephemeral canvas (creating a board is a write action, so it goes through the same approval step as a PR).
- Set a trigger, and let it investigate. Put a trigger on the metric that matters so a regression reaches you the moment it starts. Enable auto-investigation to open Canvas to a hypothesis, the supporting queries, and a first guess at the cause already waiting on the board.
Built to keep spinning
Canvas makes the whole loop feel like a single motion, and each turn feeds the next: the skills, boards, and triggers you build along the way move your team from debugging when someone complains to operating a system that watches itself and hands you findings and prioritized actions, getting smarter and faster with each turn.
It's the loop we run on our own agents to build Canvas. Open one and start turning.
Get the most out of Canvas
A few habits that make Canvas investigations even better:
- Draw on the canvas. Select shapes, circle regions on heatmaps, highlight clusters. It's faster and more precise than describing what you're looking at in text. If you see a latency spike in a specific time window, select it directly rather than typing the timestamps. The agent is aware of canvas contents and your current selections.
- Expand tool calls to verify reasoning. Canvas shows every query it runs and every result it gets back. Check that it queried the right dataset, time range, and filters. When the agent produces an unexpected conclusion, this is where you'll find the bad assumption.
- Steer mid-turn. You don't need to wait for the agent to finish or stop it before redirecting. Submit a new message and it adjusts course immediately. If you see it heading down the wrong path three steps into an investigation, just say so.
- Encode your expertise in Skills. Your team knows things Canvas doesn't: which services matter most, what your deploy cadence looks like, what capabilities your agent should have, new features and projects that may impact how the agent operates, what "normal" looks like for your agents. Write skills that capture this context. Canvas references them automatically, and they compound across every investigation and team member. Two are worth building early: one that tracks the projects and features currently in flight and one for launches, where you hand it the Linear project and GitHub repo for a change, ask what you should watch once it goes live, then have it confirm the instrumentation needed to answer those questions is in place before you roll out.
- Connect GitHub, Linear, and other connectors. GitHub gives the agent your source and deploy history, so it can tie a regression to the PR that shipped it, audit your instrumentation against the actual code, and propose concrete diffs. Linear gives it project and issue context, so it understands what you're already working on and can open new, well-scoped tickets straight from an investigation. Every source you connect is more context for the agent. The list is growing fast, with more integrations on the way.
- Write descriptive trigger descriptions. When auto-investigations fire, your trigger description becomes context for the Canvas agent. Don't just name the metric; include debugging instructions or specify a skill the agent should invoke. "Error rate > 5% on the routing agent. Check for deployment correlation first, then investigate tool failures by type" gives Canvas a head start over "error rate high."
- Tell Canvas how to arrange its findings. The default layout works, but you might want an executive summary at the top, a specific grouping, or a different visual emphasis. Just ask: "reorganize this into a summary section and a details section" or "put the cost charts side by side for comparison." Highlighting a region of the canvas and asking it to rearrange that section works too.
- Use Pages. Canvas can create multiple pages within an investigation, which is useful for organizing content by audience or concern. Ask for a "Summary and Actionable Takeaways" page alongside the detailed investigation, a page per hypothesis, or separate pages for different stakeholders.
- Build evals and datasets with Canvas. Ask Canvas to draft an eval and sample it against real production conversations to see how it holds up, or to pull a set of conversations for a regression or eval dataset. It turns the failures you find into the test cases that keep them from coming back.
- Collaborate live. Canvas is multiplayer! Share a canvas with teammates during an incident and everyone sees the same findings, in context, in real-time. Pin your own observations alongside the agent's.
- Use Canvas from your own workflow via MCP. You don't have to live in the Honeycomb UI. Enable the Honeycomb MCP server and Canvas' tools show up wherever you already work so you can kick off an investigation, pull findings, or drive Canvas without leaving the tab you're in.
- Use the feedback mechanisms. Hit the thumbs up/down icons and fill out the feedback survey when Canvas gives you a particularly good or bad response. This goes directly to our team and helps us improve Canvas for everyone. You can also ask the agent to provide us feedback.