Instrumenting AI Agents for the Agent Timeline: A Practical OpenTelemetry Guide
The LLM is rarely the root cause of agent failures. This technical guide shows how to instrument AI agents using OpenTelemetry's GenAI semantic conventions so they appear in Honeycomb's Agent Timeline—including tool calls, multi-agent handoffs, and framework-specific SDKs—so you can debug what actually went wrong.

By: Dan Juengst
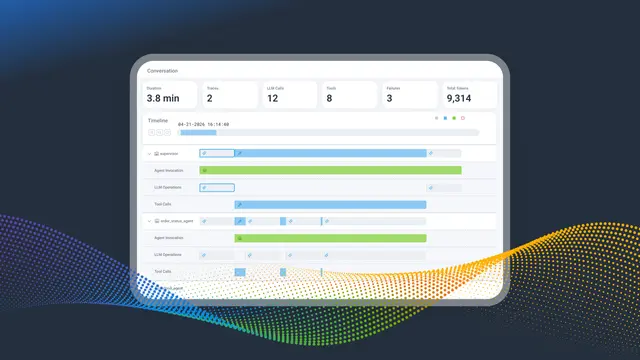
Agent Timeline: The Flight Recorder for Your AI Agents
Every LLM call, every tool invocation, every agent handoff, every downstream service span, in one conversation, in one view. Now in Early Access.
Read Now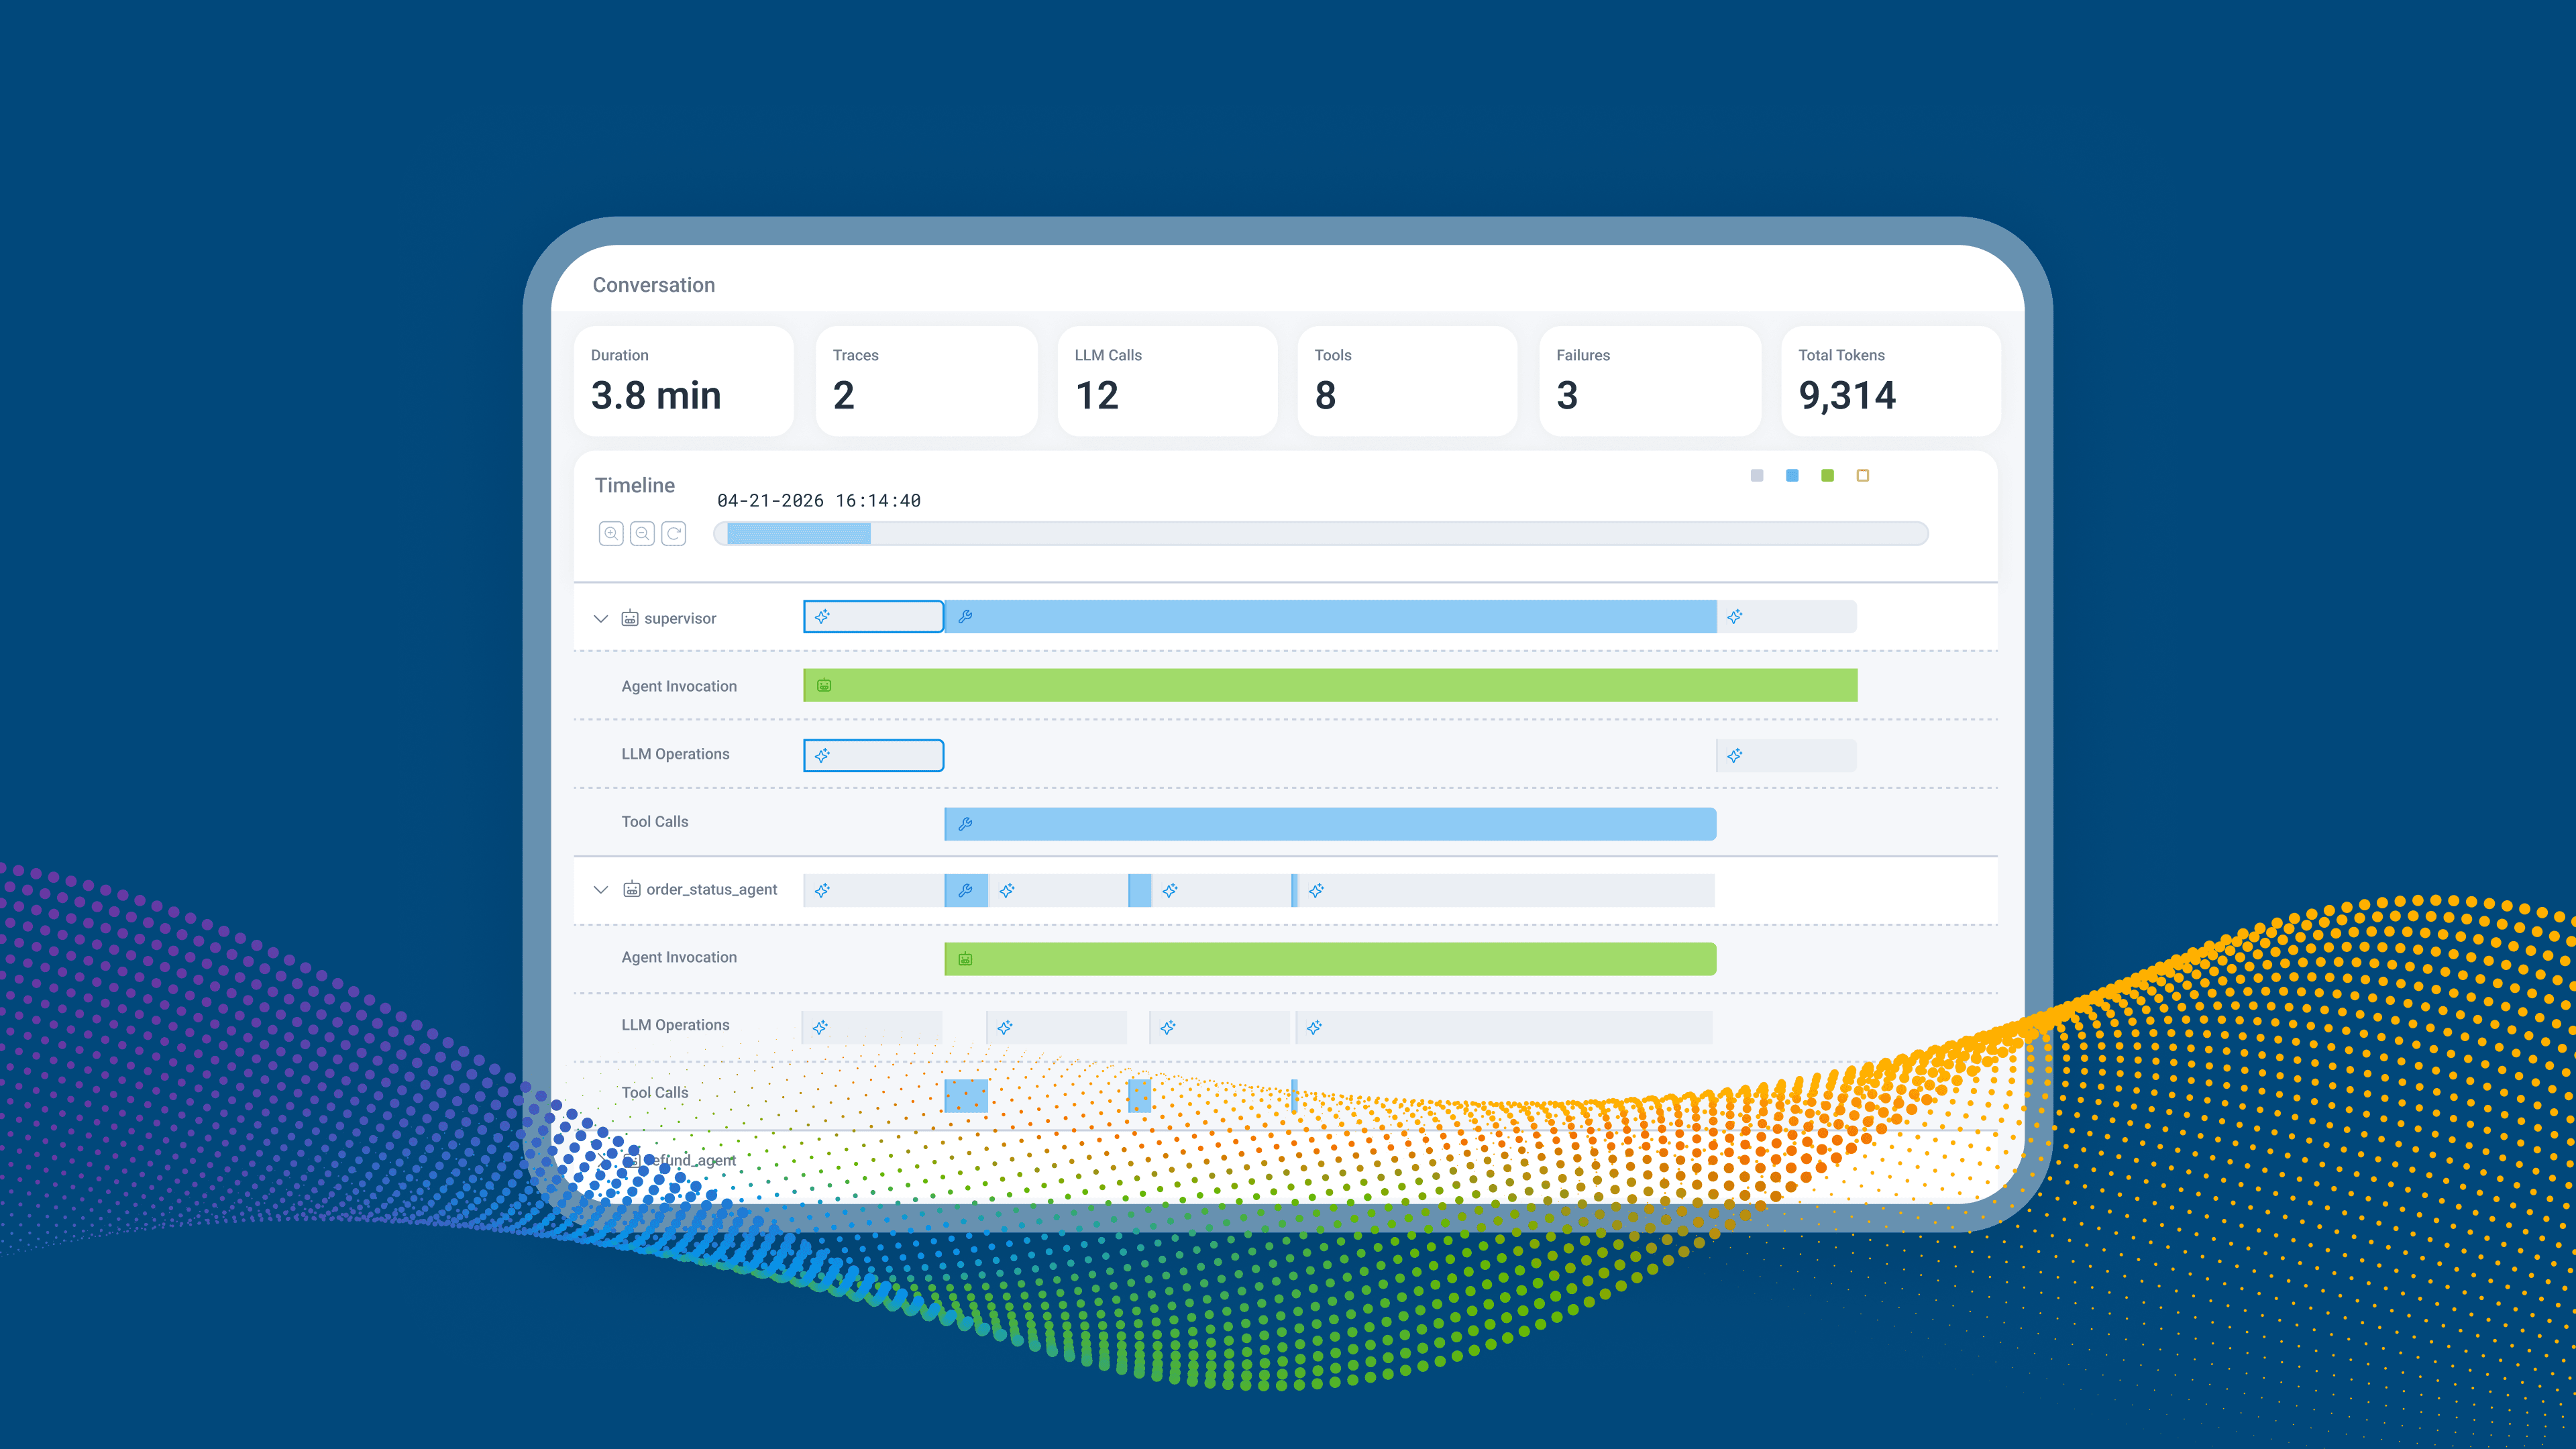
AI agents are nondeterministic, multi-step, and opaque. When one fails in production, "the model said something weird" is the cheapest, most useless line in your incident postmortem. To debug agents the way they actually run, you need telemetry that captures all of it, in order, with enough context to reconstruct what happened.
The OpenTelemetry GenAI Semantic Conventions give you a vendor-neutral way to do exactly that. Instrument your agent with the right attributes and Honeycomb's Agent Timeline renders the whole conversation: model calls, tool calls, agent handoffs, failures, and the downstream API and database work all of that triggered, bound together by a shared conversation ID.
Here's how to instrument your agents so they show up in the Timeline and become debuggable once they're there.
The three attributes you need to start
The Agent Timeline groups multiple traces and multiple agents into a single conversation view. To make that work, every span in your agent's execution chain needs three attributes:
One subtlety that matters: a "GenAI span" is not just an LLM call. It's any span anywhere in the execution chain triggered by an agent, including downstream database queries, third-party API calls, or background jobs that ran because the agent decided to call a tool. If a span exists because the agent did something, it should carry the conversation ID.
That's what makes the Timeline work end to end. Without the conversation ID propagating into your downstream system spans, you get the LLM-only view that dedicated AI observability tools stop at, except in production. But the root cause isn’t often the LLM.
Learn more about Honeycomb Intelligence
Connect with our experts today.
A minimum viable example
Here's manual instrumentation in Python using the OpenTelemetry SDK. This assumes you've already configured an OTLP exporter pointing at Honeycomb.
import json
import uuid
from opentelemetry import trace
from opentelemetry.trace import Status, StatusCode

tracer = trace.get_tracer("my-agent")

def run_agent(user_message: str):
    conversation_id = str(uuid.uuid4())

    with tracer.start_as_current_span("invoke_agent support_agent") as span:
        span.set_attribute("gen_ai.conversation.id", conversation_id)
        span.set_attribute("gen_ai.agent.name", "support_agent")
        span.set_attribute("gen_ai.operation.name", "invoke_agent")

        return call_llm(user_message, conversation_id)

def call_llm(message: str, conversation_id: str):
    with tracer.start_as_current_span("chat gpt-4o") as span:
        span.set_attribute("gen_ai.conversation.id", conversation_id)
        span.set_attribute("gen_ai.agent.name", "support_agent")
        span.set_attribute("gen_ai.operation.name", "chat")
        span.set_attribute("gen_ai.request.model", "gpt-4o")

        # ... actual LLM call ...

        span.set_attribute("gen_ai.response.model", "gpt-4o-2024-08-06")
        span.set_attribute("gen_ai.usage.input_tokens", 142)
        span.set_attribute("gen_ai.usage.output_tokens", 87)
return resultThread conversation_id through your call stack so every span, including downstream HTTP clients, database queries, and queue workers can attach it. That's how you get the full-stack picture rather than an LLM-only one.
Lighting up the rest of the Timeline UI
The attributes below are what make the Timeline genuinely actionable: token usage, model identification, tool call debugging, and failure detection.
Token usage
Set these on every chat or completion span:
gen_ai.usage.input_tokensgen_ai.usage.output_tokensgen_ai.usage.cache_read.input_tokensgen_ai.usage.cache_creation.input_tokens
Once they're queryable as high-cardinality attributes, you can correlate token spend with model, latency, conversation outcome, and user sentiment in a single query.
Model identification
gen_ai.request.model- what you asked forgen_ai.response.model- what you got
These often differ. You request gpt-4o and get a specific dated version like gpt-4o-2024-08-06. Capturing both is how you debug behavior changes after a silent provider-side model upgrade.
Tool calls
Tool calls are where most agentic failures live. Instrument every tool execution span like this:
with tracer.start_as_current_span(f"execute_tool {tool_name}") as span:
    span.set_attribute("gen_ai.conversation.id", conversation_id)
    span.set_attribute("gen_ai.agent.name", "support_agent")
    span.set_attribute("gen_ai.operation.name", "execute_tool")
    span.set_attribute("gen_ai.tool.name", tool_name)
    span.set_attribute("gen_ai.tool.call.id", tool_call_id)
    span.set_attribute("gen_ai.tool.call.arguments", json.dumps(args))

    try:
        result = execute(tool_name, args)
        span.set_attribute("gen_ai.tool.call.result", json.dumps(result))
        span.set_attribute("gen_ai.response.finish_reasons", json.dumps(["stop"]))
        return result
    except Exception as e:
        span.set_attribute("error.type", type(e).__name__)
        span.set_status(Status(StatusCode.ERROR, str(e)))
raiseIf a tool call fails, set error.type and propagate the error status to the parent span. The Timeline's "Show Failures Only" mode and the conversation-level failure count both rely on this signal. This is what turns failures into first-class navigation primitives instead of needles in a haystack. In addition, if the tool call can accept a propagated gen_ai.conversation.id and send OpenTelemetry spans, you can track exactly what happens within that tool call.
Prompts and responses (with PII caveat)
gen_ai.input.messages- full promptsgen_ai.output.messages- full responses
These make root-cause investigation dramatically faster because you can read what the agent was told and what it said. They also capture PII and sensitive data by default. Treat them like any other sensitive payload: redact at the application layer, scrub at the OpenTelemetry Collector with a processor, or restrict capture to non-production environments based on your data-classification rules.
Embeddings
On embedding spans, set gen_ai.request.model and gen_ai.usage.input_tokens.
Evaluation results
Attach gen_ai.evaluation.result events to GenAI operation spans for hallucination, bias, relevance, or any custom eval signal. This is what closes the loop between cost, latency, and quality. They are all queryable together as span data.
Multi-agent instrumentation
For multi-agent systems, two rules:
- Each agent gets its own
gen_ai.agent.name. This drives swim lanes and handoff visibility in the Timeline. Sub-agents use their own distinct names; they don't inherit from the parent. If the attribute is missing, the span shows up as "Unknown," which defeats the point. - The calling agent emits the
invoke_agentspan, not the agent being called. The called agent then emits its ownchat,execute_tool, and other spans under its owngen_ai.agent.name. This makes the handoff itself an explicit, queryable event in the trace.
# Orchestrator agent invoking a specialist agent
with tracer.start_as_current_span("invoke_agent billing_agent") as span:
    span.set_attribute("gen_ai.conversation.id", conversation_id)
    span.set_attribute("gen_ai.agent.name", "orchestrator")   # the caller
    span.set_attribute("gen_ai.operation.name", "invoke_agent")

    # billing_agent emits its own spans under
    # gen_ai.agent.name = "billing_agent"
return billing_agent.handle(query, conversation_id)Span naming conventions
Consistent span names matter because they are what the Timeline uses to group and render operations correctly:
Doing this with the SDKs you use
Manual instrumentation works for any agent, but in practice most teams build on a framework or vendor SDK. Here's how to think about each.
OpenAI Python SDK. The openai package doesn't emit GenAI semconv spans natively, but OpenTelemetry contrib auto-instrumentation packages exist that emit chat and embeddings spans with the right attributes out of the box. Drop the instrumentation in and you get LLM-layer telemetry for free. You still need to set gen_ai.conversation.id and gen_ai.agent.name yourself. Wrap LLM calls in a parent span you control, and the child spans the auto-instrumentation emits will inherit the conversation context.
Anthropic Python SDK. Auto-instrumentation exists in the OpenTelemetry contrib ecosystem; combine it with your own conversation-scoping span so the conversation ID is in scope when the SDK call fires.
LangChain and LangGraph. LangChain's callback system can be wired to OpenTelemetry through community packages. Auto-instrumentation gets you the LLM and tool spans, but you're still responsible for the conversation ID, the agent name (especially in multi-agent graphs where every node is a distinct agent), and propagating trace context into any custom tools or downstream services LangChain doesn't see.
The pattern across all of them is the same: let the framework instrumentation own the LLM-layer spans, and you own the agent-layer and conversation-layer attributes. Auto-instrumentation can't infer your conversation boundaries or your agent identity. That's a property of your application.
What you'll see when it works
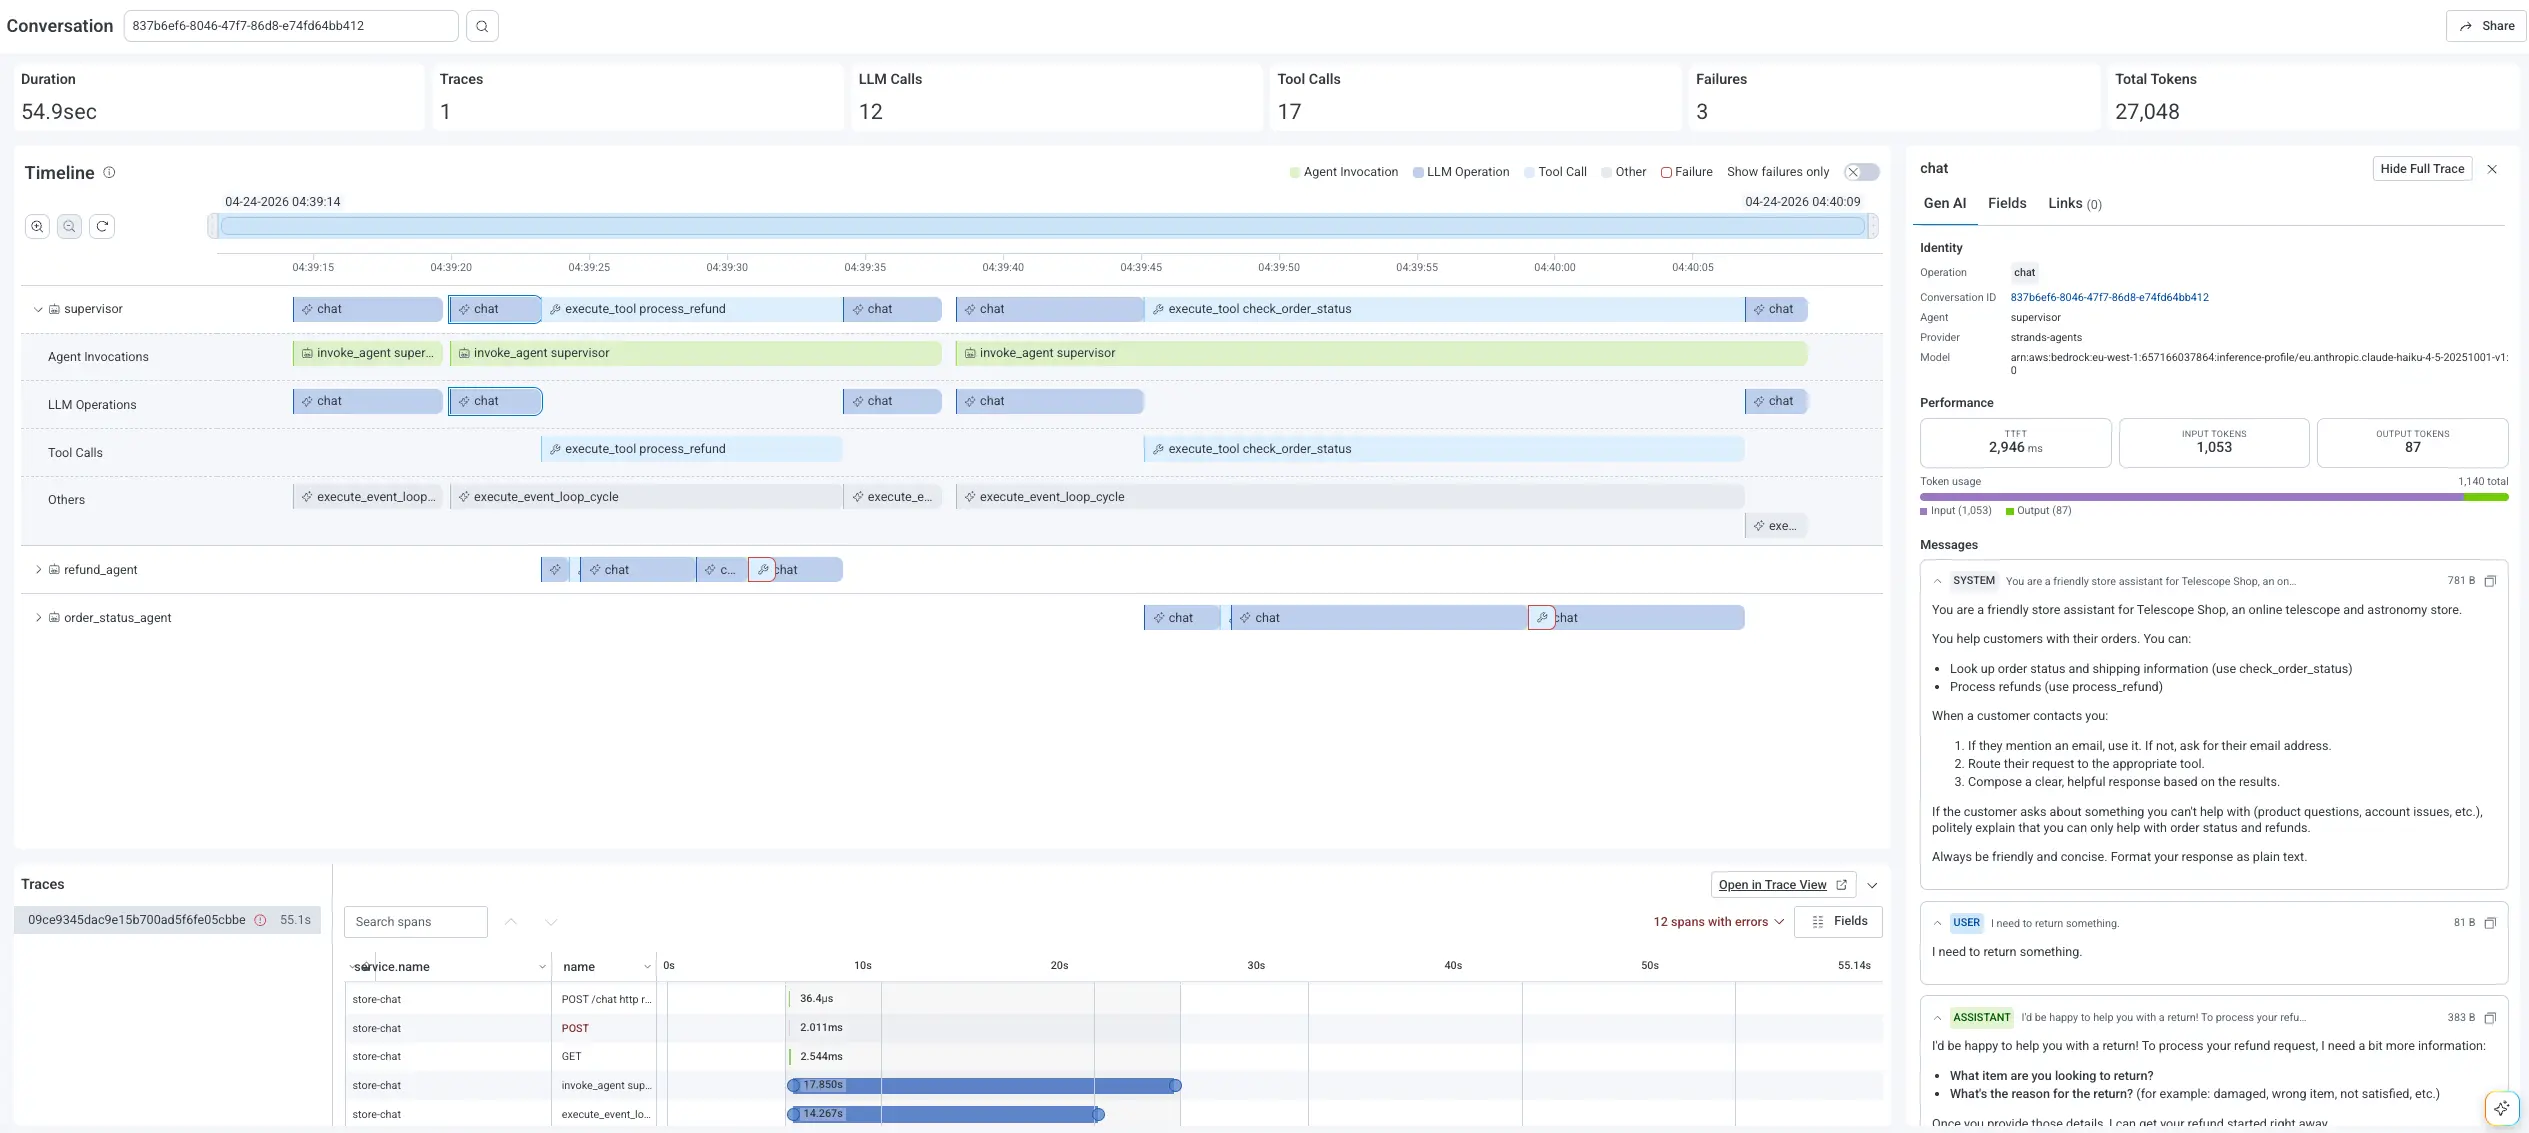
With these attributes flowing into Honeycomb, an Agent Timeline view of one conversation gives you:
- A conversation summary: total duration, model calls, tool calls, retries, agents involved, failure count
- Horizontal swim lanes per agent, with explicit handoffs between them
- Inline highlights on failing spans and a "Show Failures Only" filter
- A Gen AI panel showing prompts, responses, token usage, model name, and finish reasons
- The full trace waterfall including downstream API and database spans, pivotable into Canvas for system-wide investigation across many conversations
That's the difference between knowing an agent failed and understanding why. The model is rarely the root cause. Instrument the whole chain, including LLM calls, tool calls, handoffs, and the downstream system work, which points you in the right direction the next time something breaks.