Incident Report: Exercises, Cleanups, and Evacuations
On December 5th, 2025, we suffered a major outage in our EU region, with the last recovery steps for it extending until December 17th, 2025. For multiple hours, all of Honeycomb’s event ingestion endpoints were down. Most of the duration was spent in a degraded mode where only Activity Log data was impacted. A general timeline is available on our status page, but in this report, we’ll look at a broader analysis of what happened.

By: Fred Hebert
Investigating Mysterious Kafka Broker I/O When Using Confluent Tiered Storage
Earlier this year, we upgraded from Confluent Platform 7.0.10 to 7.6.0. While the upgrade went smoothly, there was one thing that was different from previous upgrades: due to changes in the metadata format for Confluent’s Tiered Storage feature, all of our tiered storage metadata files had to be converted to a newer format.
Read More
Every year, Honeycomb runs disaster recovery scenarios in multiple environments, including in production. Although each of our instances runs in a single region, on at least three Availability Zones (AZs), we have multiple plans for partial regional failures, and particularly, zonal failures. One of these tests was run on December 5th, and after its successful completion came its cleanup steps.
Because tolerating zonal failures creates and shifts workloads in new zones that are inherently imbalanced once the failure is over, some work is required to gradually shift workloads back in proper balance. During one of these steps, while following our runbook, we ended up purposefully destroying Kafka brokers. In all previous runs in pre-production environments, this step went fine. In production, however, it caused multiple topic partitions to go fully leaderless, which caused major problems at multiple levels:
- The topics we use to transmit all ingested events had multiple partitions that were damaged, some of which irreversibly so;
- The topics used by some of our consumer groups to track where they were at were partially damaged;
- Metadata topics used by Kafka and the Confluent addons we use (such as those used to manage tiered storage) were also partially damaged, with some partitions fully broken.
The first element in the list was our top priority: each Honeycomb team and environment is assigned multiple partitions, and while we can sustain some partitions becoming unavailable, if all partitions assigned to a team are unavailable, then we fail to ingest any data for them. But worse than that is the damage these partitions had received.
To be brief, Kafka maintains an internal set of offsets that are available to consumers for them to reliably consume data. Retriever, our query engine, takes these offsets and uses them in multiple places internally to track consistency of which events it has processed. If all Kafka brokers for a topic partition are lost, the ensuing leader election needs to be “dirty,” which can partially or completely roll back the offsets. This breaks all Retriever ingestion in the foreseeable future, possibly requiring to delete the environment and start again from scratch.
The early response then was split in two: find the teams and environments whose partition assignment needed to be moved (and impact communicated), and see if we could salvage the impacted partitions without offset/data loss.
Roughly one hour into the incident, the impacted customers were found. The Kafka recovery was a bit trickier: we couldn’t do any random leader election and had to salvage as much data as possible from the offsets that may still exist.
Through the alerting noise, we noticed that our ingest service, Shepherd, had entered a crashloop spiral more than an hour earlier due to increased memory buffering for events that were to be written on the broken partitions.
Various options to repair ingest for apps on broken partitions were considered, such as adding new ones to all datasets, booting Retrievers in the wrong partitions to create room, and so on. In the end, the impacted partitions were marked read-only on the producer side, which fixed ingest’s crashlooping. Reassignments were then run to bring everything back to normal for customers.
Later in the night, a list of leaderless Retriever partitions (all read-only) with their offsets was established. Roughly a third of the partitions were impacted, but a single one had complete data loss, roughly 2.5% of our cluster.
As the system was then relatively stable but far from solid, a plan for the night and checking back on Saturday was put in place. The Kafka autobalancer was turned off, and a manual reassignment plan to bring back some balance was put in place, left to run overnight.
Completing reassignments to fresh hosts, for tiered storage specifically, can sometimes take multiple hours of idle-looking time to scan S3 buckets for historical data before any transfer would show up at the network level. We found it concerning to see disk usage going up, but decided to wait.
Around midnight PT, one partition still showed no sign of recovery: the disk was filling too fast on the brokers for comfort, and so local retention was reduced on Kafka, aiming to use the S3 tiered storage for any longer retention need. A status update was posted, and the group disbanded for the night.
Weekend response
Early on Saturday morning, responders noticed that the Kafka balancing jobs did not progress, and disk usage hadn’t improved. Estimates showed we were losing 5% of disk capacity per hour, with only 30% free. To avoid running out of disk on brokers and potentially suffering major data loss that propagates to Retriever, plans were put in place to shut down all ingest at the ALB layer if we reached 95% usage. This left us five hours to figure out a way to free space.
At that point, the main reassignments were cancelled, and there was an attempt to move smaller partitions to free up space. Responders found out that two topics had broken topic partitions that could be relevant: _confluent-tier-state and __consumer_offsets. The theory was that since we were trying to move topics and their data to tiered storage, having these broken could prevent proper offloading and uploading of data.
The moment these were repaired, triggers about our SLO processing fired, complaining of ~18h of late data. Our SLO processing service had been unable to see new data had come in based on how it implemented its consumption, and repairing the metadata topics unblocked it. It started catching up.
After multiple efforts, at 7 a.m. PT, with 5.07% of disk storage free, ingest was turned off. Disk usage stabilized, but did not empty—which would have been our expectation if we were uploading older data to S3 and not replacing it with new ingest.
Honeycomb engineers decided to bring up new Kafka brokers, with new Retrievers, and create brand new partitions to send ingest to.
As this was being rolled out, an engineer came in and suggested we turn off tiered storage altogether to unstick the cleanup process and allow freeing disk space. This is something that had worked in 2021 during an old outage. We turned off tiered storage and disk space was instantly restored.
We reopened ingest, and customer impact ended then. Later in the day, as part of cleanup, the team stopped work to manually fix Retriever topic partitions that were fully damaged and truncated them, leaving them in read-only mode. This created a gap where older data was unavailable for querying as Retriever struggled with the offset reset, but it wasn’t lost and we would remediate this problem in the following days.
Second week response
Since Kafka was still in a rough but functional state, most of Monday’s response focused on two elements:
- Extending the retention of the Honeycomb MySQL readonly replica’s binlog, since Activity Log could no longer publish events to Kafka.
- Salvaging the damaged Kafka topic partition for Retriever.
The broken partition was fully offline. Being read-only, no traffic was being lost, but the historical data was not available for querying, although queries succeeded overall, just with partial results.
Regardless, a series of small tweaks and fixes were put in place to allow the Retriever nodes to idle live and let old data be queried despite “broken” offsets.
On Tuesday, work was done to try and bring back tiered storage; this first required deleting all the old S3 data, which took multiple hours. We did not manage to turn tiered storage back on.
In parallel, work was done to unfreeze builds that hadn’t moved since Friday. Activity Log repairs got delayed due to more urgent remediation efforts on Generally Available Honeycomb features, though data retention would be available until Friday. We attempted to repair their partitions on Wednesday. After failing to do dirty leader elections in Kafka, we decided to delete the topics involved and recreate them.
This is when things got weird. The delete operation timed out, and suddenly, none of our Kafka brokers could do anything administrative other than list topics. Describing, reassigning, or modifying them would just time out. The cluster was in a far worse state than expected, and responders on the call became uncomfortable.
To move past the feeling, we decided to split approaches: one lane to try and salvage the cluster with non-risky operations and ZooKeeper surgery, and one lane to plan a full evacuation of the cluster to a new one.
Managers and directors were called in to help align the rest of the organization on these efforts. Wednesday afternoon was spent preparing the evacuation efforts (described below) with the support of directors and engineering from all teams that would interact with Kafka either for operations, or through their product area.
Thursday involved the elaboration of multiple evacuation plans, and a division of work while Kafka SMEs kept trying to see what could safely be done about the cluster. Later in the day, even changes such as rebooting the Kafka controller host to shift its responsibility to another broker were seen as high-reward but high-risk, and because evacuation efforts could benefit from prolonged steady state, we tabled these efforts.
On Friday, we realized we wouldn’t be ready in time for Activity Log data to be salvaged in the MySQL binlog, which had a maximal storage time of seven days. Since the feature is still in beta and rushing to save more data through alternative replication means would drag people away from the Kafka evacuation, we chose to try a hail mary approach suggested by AWS support where we’d set up a new replica that was one week old from a snapshot, freeze it with manual replication, and hope that this would trigger AWS’ feature where stalled replication extends binlog retention to up to 30 days.
Evacuation
An evacuation would essentially ask that we consider the current Kafka cluster as no longer worth salvaging. A new Kafka cluster would be needed, with brand new topics and partitions, all empty with reset offsets. This, in turn, implies modifying or ensuring all of our software components can properly shift from the old to the new cluster without data loss, which would require deep code changes. For example, Retriever needed to be edited so that it was allowed to reset its offset tracking, something that would require changes in some of its internals and a lot of consideration for complicated scenarios.
This sort of effort would be expected to take weeks if not months in normal time, but the incoming holidays break and an already tired team made the deadline short. It was also unclear if the cluster, as it stood in its unmanageable state, would be up for long enough to complete the migration.
We therefore planned for five options presented summarily here, depending on how much of the preconditions we’d meet:
- The existing Kafka cluster dies at the current state of the world. We have a full outage and must recover from scratch. At least four to eight hours of hard downtime expected, higher ongoing costs.
- The existing Kafka cluster dies but we have managed to make Retriever able to handle offset resets; we can recover from scratch without leaving old partitions behind.
- The existing Kafka cluster dies while we were ready to migrate to a new cluster. We can reset it, but ingest would be down for one to two hours, querying estimated down for up to three to eight hours.
- We’re ready to migrate most things except some minor elements we haven’t had the time to prepare. Zero downtime for ingest, one hour downtime for primary querying and alerting, but may take anywhere between two to eight hours of work—and we were unsure what the impact would be on less critical services.
- Full migration as we’re ready. Similar to the previous option, but more testing has happened, we pick some slightly safer implementation details across all applications, and reduce uncertainty.
Roughly midday on Friday, the Storage team managed to make the offset reset mechanism work for Retriever. This made the first scenario no longer be a concern.
Our platform team had made good progress on the feature flags to switch readers and writers, and also made it possible to boot a second Kafka cluster without interfering with the other ones nor any other environments.
As we progressed through the work on Friday and firefought on some parallel events in the US, we thought we could ambitiously hit the 4th or 5th scenario on Monday afternoon, with a full dress rehearsal in one of our EU pre-prod clusters.
The dress rehearsal went well with people from more than half a dozen teams on the call. There was some friction around code changes and builds that needed ironing out, but the plan mostly worked fine and was completed within four hours.
Tuesday required some work to fix issues where domain names for a new Kafka clusters’ NLB wouldn’t fit AWS’ limits, but we managed to fix everything in time. The migration ran in two hours with no significant problem and up to one hour of delayed signal at most.
We cleaned up the older clusters, and caught up with bits of Activity Log in the EU region. As it turns out, the replica trick didn’t work. To minimize lost data, we booted an instance from Tuesday December 9th, and replicated from there. This kept data loss on the Activity Log from December 5th at ~6 p.m. ET to December 9th at ~6 p.m. ET, and the rest was saved.
Analysis
This incident was draining, described as “the worst incident of my career” by many. However, a great part of working for Honeycomb is how caring the organization is toward our incident response team. Frankly, it's at a level many of us hadn’t seen at prior companies.
Some engineers mentioned wanting to keep response sustainable, while others felt that it should have required faster escalation.
Coordination proved challenging. Before this happened, multiple senior engineers mentioned feeling like they automatically grabbed the lead when they entered the room, which they mentioned being something they need to think more about.
Communication with the public was challenging. We aren’t necessarily used to running such long events, and decided to be explicit about potential losses and pending recovery of Activity Log. While the situation was internally dire, the Activity Log is actually a beta feature; customers let us know that we were giving too much information about minor features.
Documentation fragmentation issues
Many of the elements in play for this outage were already known. Similar outages had been seen in recent years, with high level plans for workarounds, RFCs and migrations that would ease up on these conditions, and processes to run similar exercises safely. Ultimately, these documents’ existence was either unknown (outside of the people who were involved in writing and reviewing them), or inaccessible (blocked by ineffective search on some document systems). Interviews with members of staff revealed a frustration with our documentation situation, spread across multiple areas.
We see a need to better consolidate our information as we keep growing.
Bumpable roadmap effects
When you are given multiple competing tasks of high importance, the one with a deadline further out or a higher level of uncertainty is easier to defer than the one with a more urgent deadline or well-understood scope. This is often represented as the Eisenhower matrix:
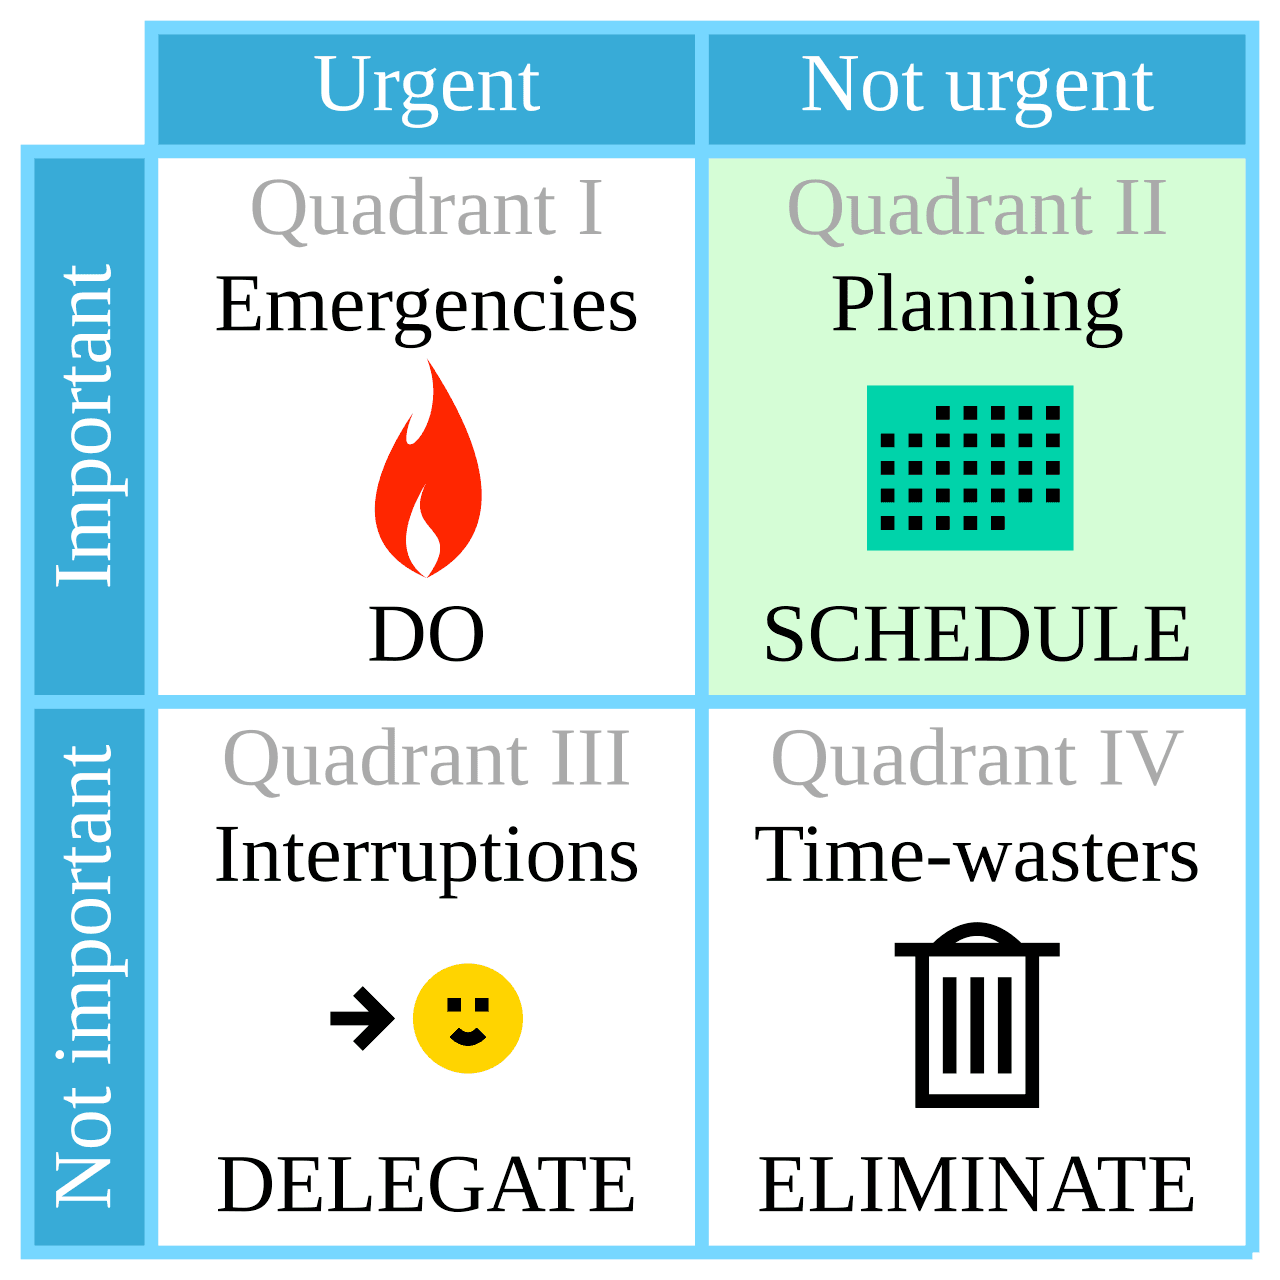
By Cmglee - Own work, CC BY-SA 4.0
When caught between a clear urgent project that has well-understood customer benefits, it becomes difficult to say no to it in favor of an internally controlled project whose benefits are going to be less obvious or more contextual.
This gets even muddier when you have to prioritize multiple projects from the same quadrant. It’s at these levels where we can see teams with agency in their own schedules adapt to pressures by deferring or prioritizing some projects without going back up to leadership to arbiter common issues of this type.
We could think of the bumpable mechanism as an extra dimension over that matrix: how much control and flexibility there is across competing projects, which makes it possible to reframe or reorder their respective urgency and importance.
In general, being flexible with deadlines is a good thing. It lets us reprioritize as new information becomes available and as we find we need to adjust our plans. However, it appears to be challenging for teams to avoid repeatedly deferring more flexible pieces of work that are locally controlled or have wider margins. This is a convenient and rational way to locally manage tradeoffs.
We cannot counter all bumping—it plays a useful role to our ability to adapt and adjust—but may want to seek ways of knowing when bumping can become a reflex more than a strategic tool.
Sociotechnical misalignment
A few years ago, Honeycomb was small enough that critical knowledge only existed within single engineers’ minds. We have since then taken measures to ensure all components have owners and that critical knowledge has multiple people behind it. While this helped, such measures need frequent adjusting.
Something interesting that came up in the incident is that many key interventions came from people who no longer own the components they helped with. People were able to help because they were here back when teams’ ownership was less well-defined, despite having since moved to different roles. That these people were all able to offer meaningful support is a strength of this organization. It also shows, however, that there is some drift or gap between the socio- and the -technical part of the system.
For example, in creating one team to manage one part of the system and assigning ownership of the other elements to another team, any existing coupling between these components does not vanish. So while both teams can grow a stronger expertise on their respective piece of software, the details get lost:
The challenge is that engineers need and often want to move to different work over time, both for growth and motivational reasons. Deep systems knowledge also has value, sometimes in very specific and infrequent situations. Both forces compete with each other, and compromises around quick training or leaving docs and runbooks do not fully replace thorough understanding, even if that’s only what teams have time for. This can be supported by good engineering practices, fighting tech debt, and solid observability to make it easier to get your bearings faster, but sometimes the business will, either implicitly or explicitly, accept the risk.
The principle is that the socio- parts (teams) may be more siloed than -technical parts. Isolating one without untangling the other will lead to drift, and drift to surprises. There is no easy fix for it, and incidents such as this one are great opportunities to bring some of that deep knowledge back, in a way that inherently feels practical to everyone involved.
Conclusion
In wanting to move past a simple explanation of “don’t destroy the Kafka cluster next time”, we have to look at a very large set of influences. This incident involved a long term response during a stressful situation, including planning, implementing, and executing a full Kafka evacuation in less than five business days. We could only accomplish this through a very rapid reorganization within Honeycomb.
We hope that this document provides a sufficient explanation behind how events unfolded for one of our biggest outages in recent memory. Documenting our response and some of its challenges can be of use for other organizations who may encounter similar situations.
An additional hope of ours is that by highlighting some of the key elements that we identified in our reviews and were in play within our broader organizational context, we can provide insights that can also help other organizations. We think the patterns uncovered do have the ability to carry meaning elsewhere.
Appendix I: Technical Explanations
This section aims to explain the mechanisms involved in a Kafka cluster. On their own, they are not considered explanations of why the outage happened, but contributors to how its events unfold.
We assume some familiarity with the concepts described in Confluent's Introduction to Kafka.
What are Kafka offsets?
On disk, Kafka will store data such that each message has an offset (a relative order since the start of the topic), a position (to skip around files more easily), a timestamp (to know when the data was written), and then the messages’ contents. These are put in a “log” on disk, broken down by topic and partition. Consumers can then ask to stream the log’s data, being handed the above data (including the offset and message).
In practice, consumers will generally ask for an offset bigger than the last one they had seen in the stream previously. If the log gets truncated (offsets reset at 0) consumers will often just start processing again from either the start or the end of the stream.
The timestamps can in theory be used to help make decisions, but are not accurate enough on their own to ensure ordering. Because clocks on computers are not reliable enough at a small enough granularity, it is possible for multiple messages to share the same timestamp, but not the same offsets.
Why do offsets matter to Retriever?
Generally, Kafka consumers know about the offsets, but they don’t necessarily store them long term, outside of knowing where you were at.
For example, every time you migrate a Kafka cluster (something kind of rare), offsets get reset and lost. To make that work in complex workloads, there are migration systems that will create topics that map the new cluster’s offsets to the old cluster’s offsets (or vice versa) in order to let consumers switch from one to the other transparently.
Overall, the expectation is that you use offsets to track where you’re at in a topic, and if the offsets reset, you can choose to either start from 0 again, or from the newest offset.
Retriever is one of these systems where each bit of data we consume from Kafka gets stored again into its own column format, both on disk and on S3. When doing this, Retriever also stores the last offset seen, once globally on its own, but also within each segment metadata file it has about any data it stores.
This is a safety mechanism that ensures Retriever never skips ahead or back in time when it shouldn’t, which could result in duplicated or missing events, which could in turn mess with investigations or alerting.
The problem then is that when the offsets reset on purpose (and not because of a bug), either due to a migration or a Kafka failure that required recreating topics or topic partitions, Retriever detects the unexpected values and refuses to process data to avoid corrupting its content.
This, in turn, means that Retriever goes down hard and becomes unavailable for querying or new updates. If this happens on one partition, marking it read-only makes the rest of the cluster handle its burdens. If this happens on all partitions, no traffic can make it out of Kafka and to Retriever.
If Retriever cannot process events within a few days (as configured by the Kafka cluster’s retention), then the messages are eventually pruned and the data is irreversibly lost.
Reducing Retriever’s dependence on offsets can either take one of two forms:
- make it process offsets and timestamps, such that if the offset goes back but timestamps are greater, we know the partition has reset; otherwise, follow offsets
- have Retriever able to reset the offset counts it tracks back to zero such that it will safely keep processing messages, but without overwriting old ones it has on disk or references in MySQL
Both represent a significant risk to implement, because any bug can irreversibly damage and corrupt data Retriever has stored. In this incident, the evacuation work ended up implementing the second solution as a one-time operation.
What is tiered storage?
Our system sees a lot of data. Tiered storage is a closed-source commercial feature of Confluent that lets Kafka split its storage into two tiers: a local one (hot) and a remote one on S3 (cold). New and fresh data that will be streamed to most live consumers is read from the hot storage, whereas older data (up to a few days old) is stored in S3.
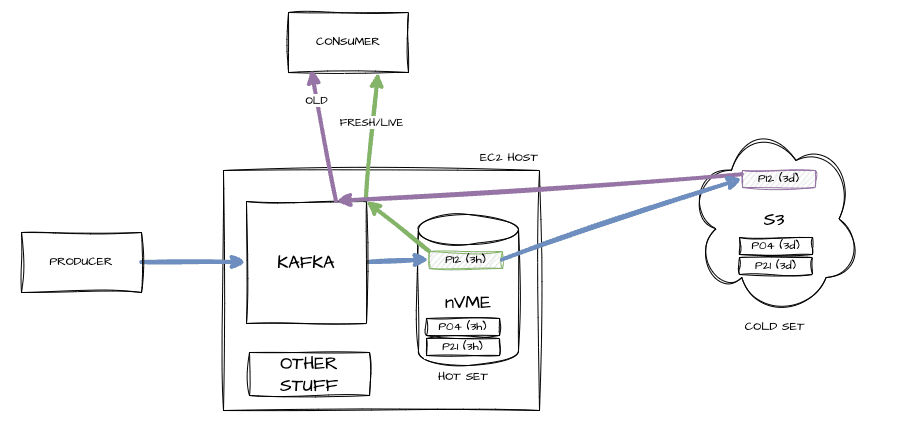
This lets us have fewer hosts with fast access for live streaming, and elastic (but slower) storage for occasionally recovering older data.
How did Kafka partitions break down?
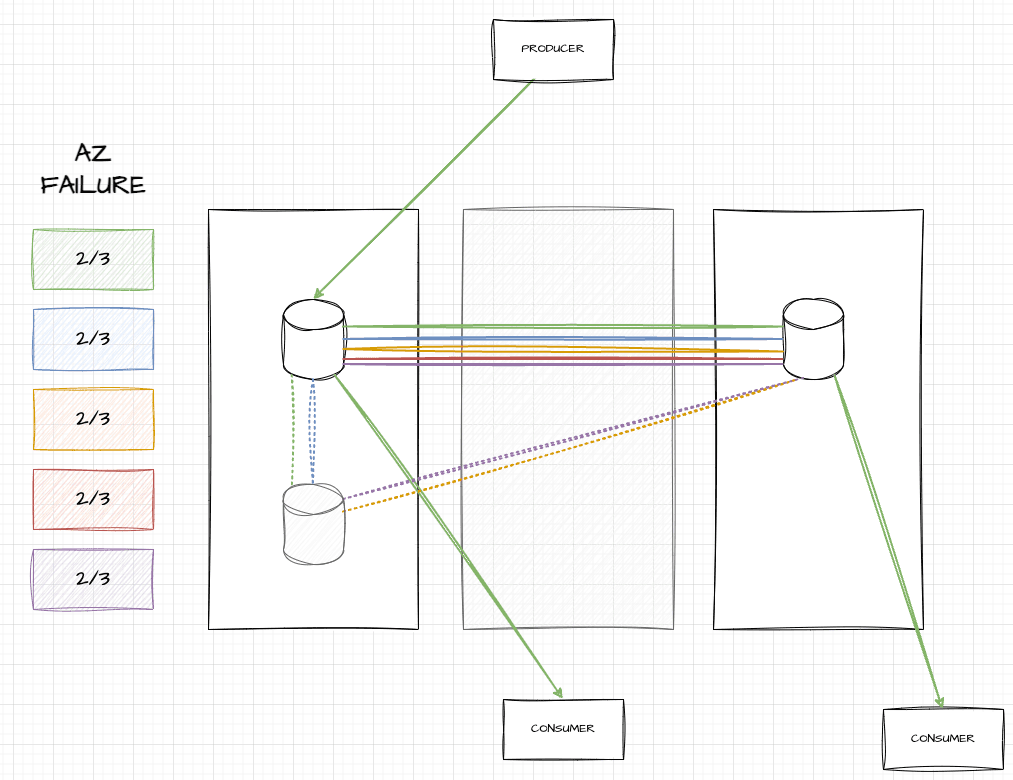
At a steady state, our Kafka clusters in production have various brokers, over three availability zones, with each topic partition replicated across one broker per availability zone (AZ). Here’s an example of what this looks like with six brokers:
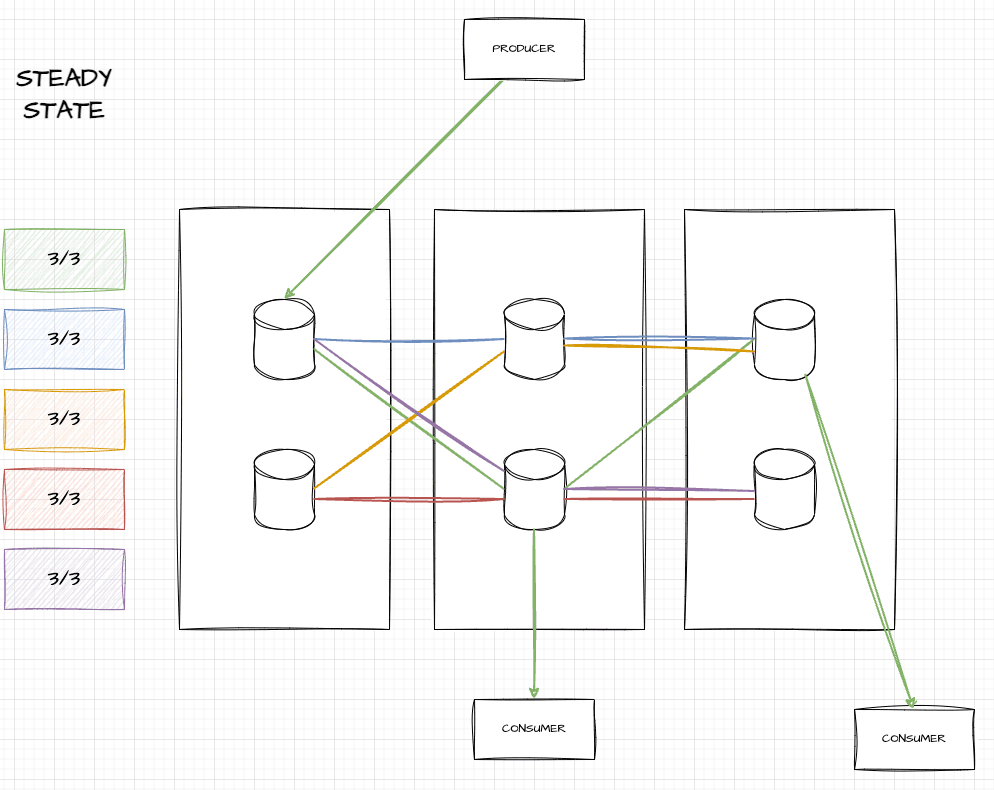
In this image, you can see five topic partitions (green, blue, yellow, red, and purple), each of which touch three brokers and span three AZs. If you’re a producer of the green topic, you write to the leader (in the leftmost AZ), but can consume from any of them.
When an AZ fails, all brokers in that AZ die and vanish. The auto-scaling group (ASG) in AWS detects that we only have four out of six nodes, and boots two new ones in functional AZs. Once they’re up, Kafka can start replicating data there:
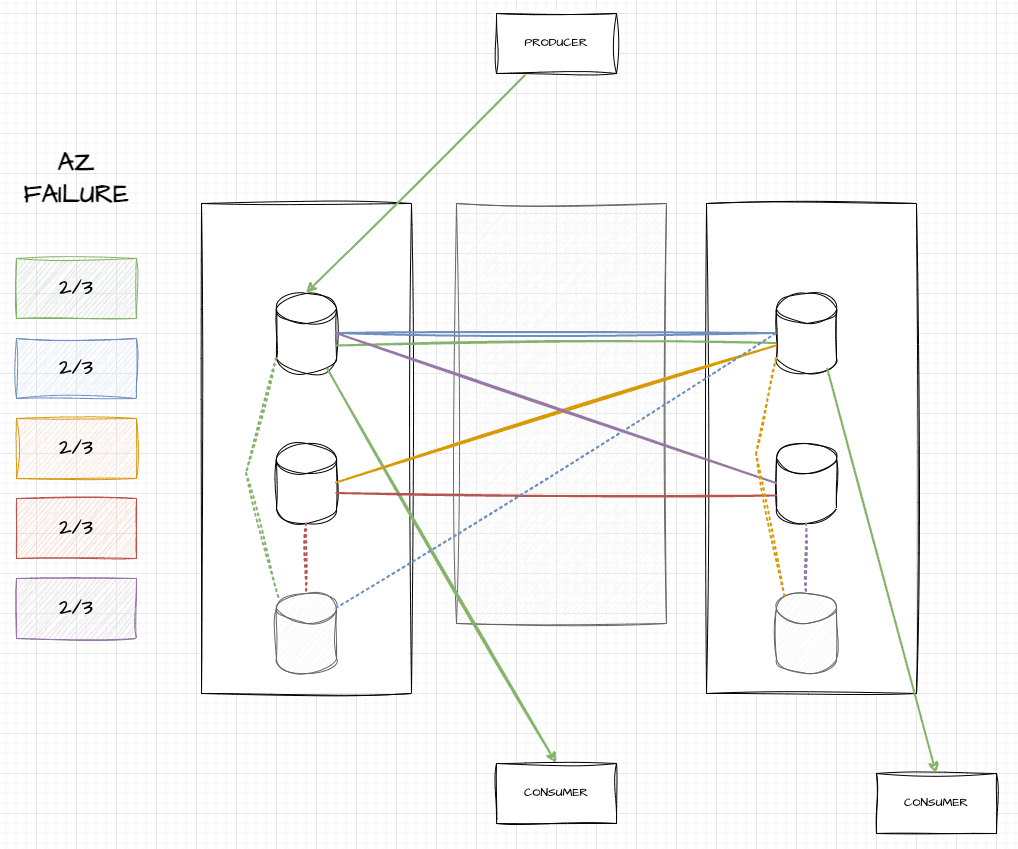
As seen here, two grayed out hosts have been added, and for a while, data will be replicated from in-sync replicas (ISRs) to those out of sync, represented by dotted lines. During that time, consumers can move to any ISR to get up-to-date data and be fine. These ISRs may be a bit more stressed, but overall, things stay up.
When we killed hosts in the cleanup, older brokers accidentally got killed. This can further reduce redundancy, but in some unlucky cases, may fully remove all brokers that owned a topic partition:
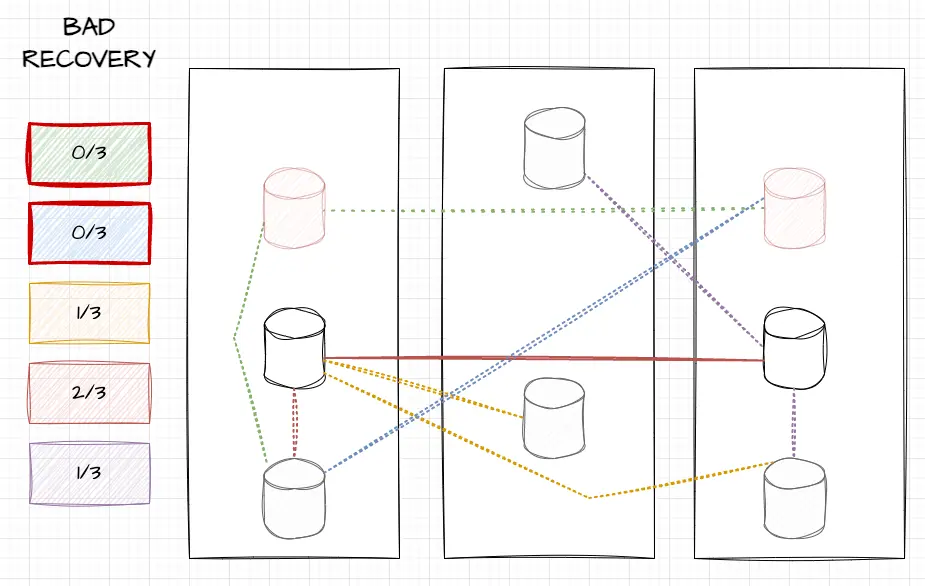
In this image, you can see that we killed the top two brokers (in pale red) which were in sync. Only two out of six old brokers remain, and only they have in sync data. You can see that topic partitions yellow and purple have only one healthy broker (middle-left for yellow, middle-right for purple), red was on both middle brokers and is fine, but green and blue were on neither of the remaining hosts.
In these cases, red and blue would find themselves leaderless. The only thing telling how much data they could find would be to know how far behind the new greyed out brokers were, and whether critical metadata had the time to be replicated.
Why did it only happen in prod?
The key lies in the topology of the clusters. While the production cluster has many nodes, our pre-production clusters in the EU only have fewer nodes, in a way that makes this far less likely.
Here’s an example with the smallest cluster possible, with only three nodes. When an AZ failure happens there, only one node gets killed, and once again, all topic partitions have two out of three brokers present:
The key difference happens because we only killed one host during the failure test. Since only one was killed during the test, only one needs to be killed as part of the clean up (either of the black-outlined nodes above). By killing a single broker, we hit a total of two, and it follows that no partition will go below a single broker left, which will remain a safe leader.
This means that so long as you start the AZ failure with a healthy cluster, it is difficult to break the cluster. We ran four tests in pre-production clusters, but since the issue was structurally unlikely to be reproduced there, the flaw remained hidden. On top of all the other risks of doing an AZ failover like this (database failovers, large amounts of connection interruptions across multiple services, etc.) and our frequent chaos engineering around Kafka, this made everything seem adequate on that front. With limited time and resources, other aspects of the exercise that seemed riskier were what drew the attention of people running it.
While running multiple tests in a cluster more similar to production might still not have caught the issue, the likelihood would have been much higher.