Optimizing the OpenTelemetry Python SDK for LLM Workloads
The performance impact of instrumentation on running applications should be minimized wherever possible, and this is what led to the investigation described in this article.

By: Alex Boten

The Director’s Guide to the Future of Observability: AI, OpenTelemetry, and Complex Systems
Read Now
Agentic workloads thrive with precision tooling. Just like developers, they need the rich context, high cardinality, and fast feedback loops that allow them to ask exploratory open-ended questions of their code. But instrumentation is costly, and from the dawn of software, developers have tried to do the most possible with the least amount of resources. The performance impact of instrumentation on running applications should be minimized wherever possible, and this is what led to the investigation described in this article.
Python has seen an increase in popularity in recent times with the proliferation of LLM libraries written in the language. The OpenTelemetry Python API and SDK packages have been around for quite some time, and they work well for many use cases. But we also heard from some of our users that the performance of the library has impacted their ability to use it. A few months ago, we started looking at ways we can help developers that are instrumenting workloads in Python get better performance out of their instrumentation.
Leverage AI-powered observability with Honeycomb Intelligence
Learn more about Honeycomb MCP, Canvas, and Anomaly Detection.
Setup
The benchmarked application is a web service that uses WSGI and requests instrumentation libraries. We used the system metrics instrumentation library to gather CPU and memory utilization. The signal we were most interested in benchmarking was tracing, so all traces were configured to be sent to an OpenTelemetry Collector running on the same host.
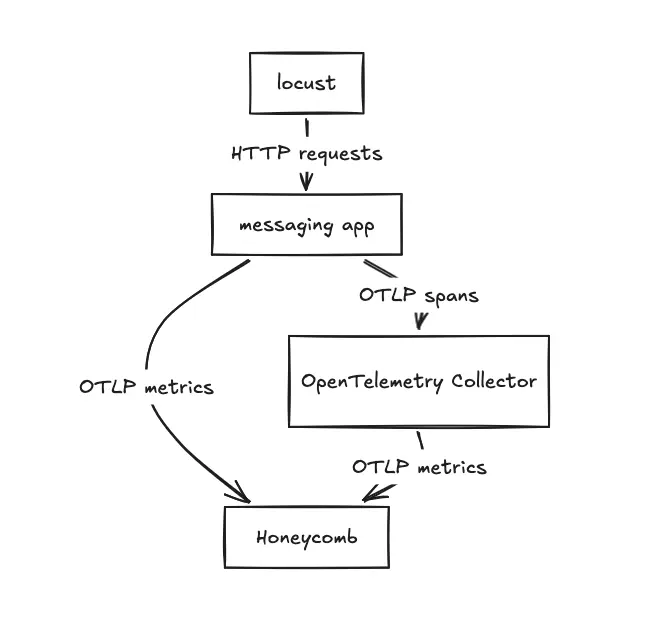
The source for the traffic is Locust, which also runs on the same host. Some things to consider:
- The application doesn't have to worry about storing batches of spans for a long period of time. The performance impact of this could be tested in a future test. A best practice is for applications to be configured to send their telemetry to a destination not too far away. For example, a sidecar or a destination on the same node.
- It would be better to have the source of the traffic be a different node. This would ensure the client was able to utilize the same resource against destinations instrumented with the different SDKs. The test as run in our setup was able to give us enough data to work with, so we didn’t go any further on this.
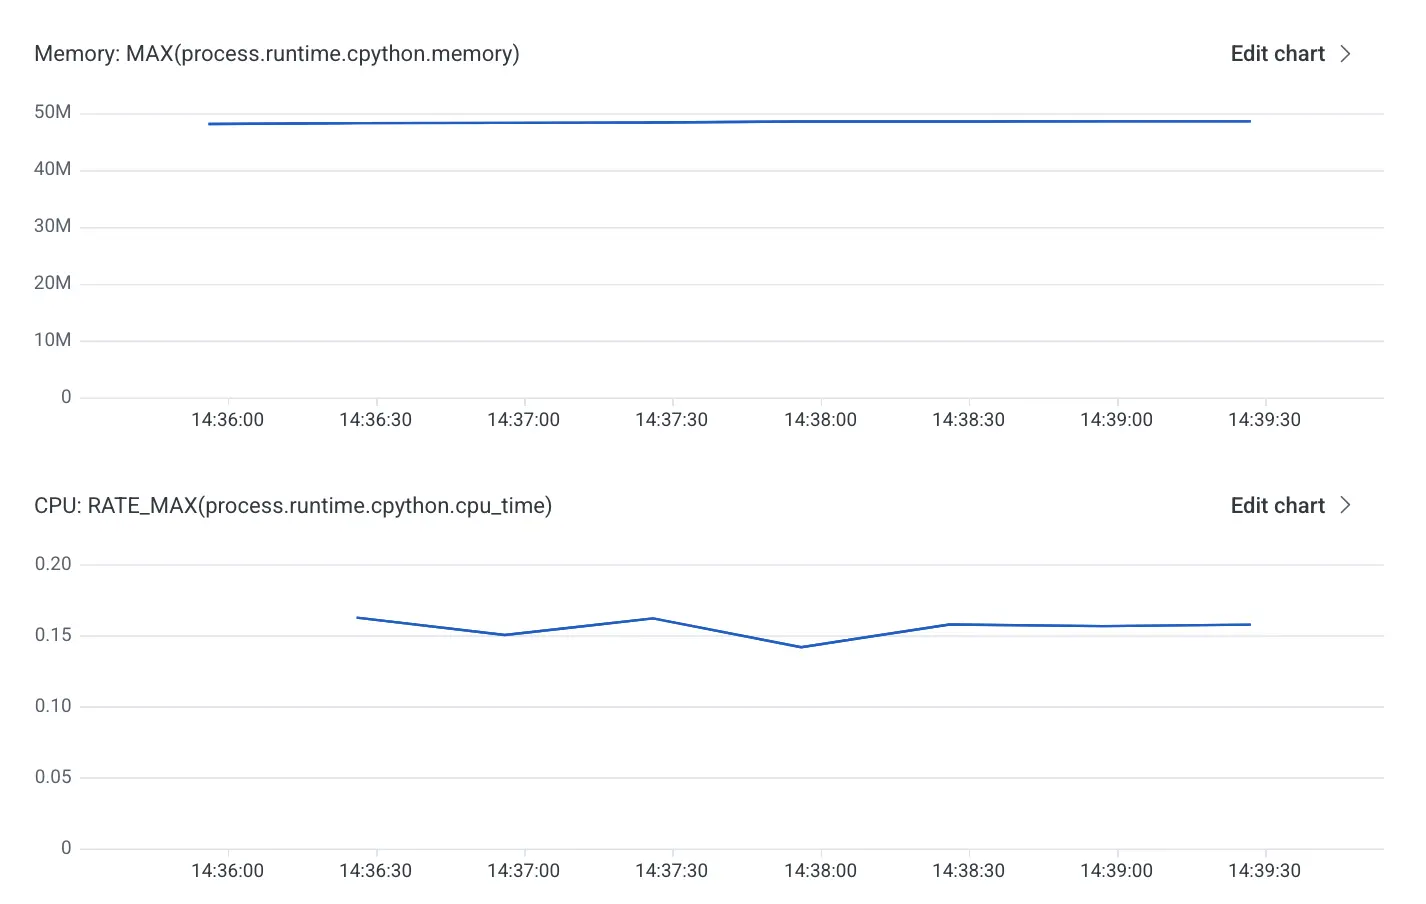
The performance analysis started by capturing a baseline for resident set size (RSS) memory and CPU:
With the baseline in place, we continued the investigation by taking a few different open source libraries available, including the OpenTelemetry SDK, and comparing the memory and CPU footprints. In the following image, the green line represents the performance of the OpenTelemetry SDK.
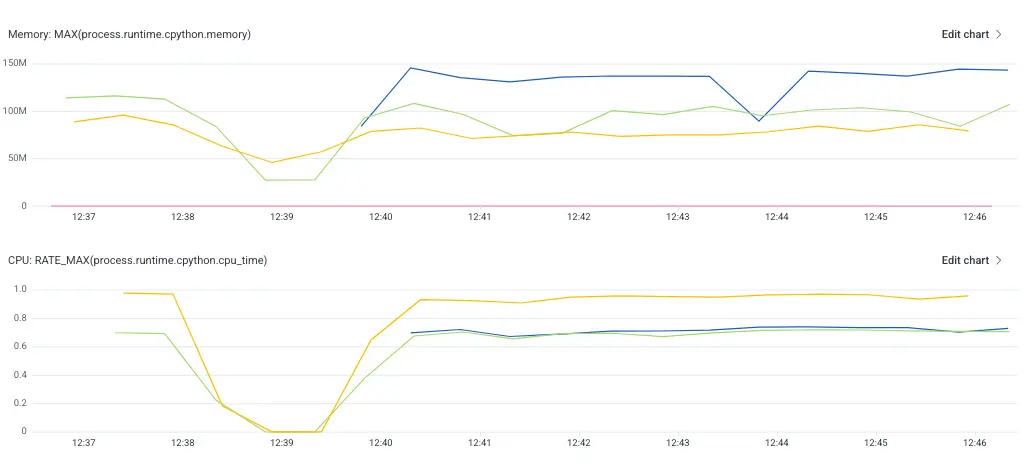
For the small application we tested, the OpenTelemetry SDK added roughly 50MB of memory, which nearly doubled its memory footprint. Compared to the other two libraries, it was performing better than some, worse than others. Could we do any better? Here, we’re going to spend a bit of time looking at a core feature of OpenTelemetry: the API and SDK separation.
API and SDKs
From the very beginning, the OpenTelemetry project has always wanted to have a clear delineation between the API and the SDK. Explaining this over the years has always been a struggle. Questions like these came up every single time:
- Can’t I just have one package that includes everything?
- If I can’t emit telemetry without the SDK, what’s the point of the API?
- Is this one of those good in theory but bad in practice deals?
The API defines the surface area that most users and library authors interact with to instrument code. The API on its own doesn’t produce any telemetry, and as per the specification, doesn’t have any impact on the performance of an application. This is because by default, the API is interacting with tracing, metrics, and logging providers that intentionally don’t do anything. This is what has allowed libraries to instrument code using OpenTelemetry without causing all their users to take on many additional dependencies or pay performance costs.
The SDK contains the batteries, it’s where the telemetry pipeline is configured. Once the SDK is installed and configured, the APIs that were interacting with no-op providers before, can use providers that know how to produce telemetry. This separation, aside from making it easier for developers instrumenting the code, also means that SDK implementations can be swapped out at very little cost. In the benchmarks done for this investigation, very little configuration was done to change the underlying SDKs. This feature is key for the next part.
C++ to the rescue
There are libraries in Python to allow applications to call out to other languages from within Python. In other words, code that is written in Python can leverage libraries written in C++ or Rust when the need arises. So we decided to take the OpenTelemetry C++ SDK implementation, wrap it via Pybind11, and test its performance.
The goal of this minimal implementation was wrapping start_span and start_as_current_span, which led to needing to wrap a few different Python types and methods. The main gotcha was addressing context propagation, which was mentioned in a few issues (open-telemetry/opentelemetry-python#2691, open-telemetry/community#734) opened in the OpenTelemetry organization.
In a few words, the problem with context propagation is that each language stores context through a mechanism that is idiomatic to the language. This object cannot easily be passed from one language to another, and to make matters worse, the context management is part of the Python API package. To solve this in our prototype, we use monkey patching the API calls, to always use the C++ implementation to store context information.
With those gotchas addressed, we were able to compare the performance of our application using the new SDK.
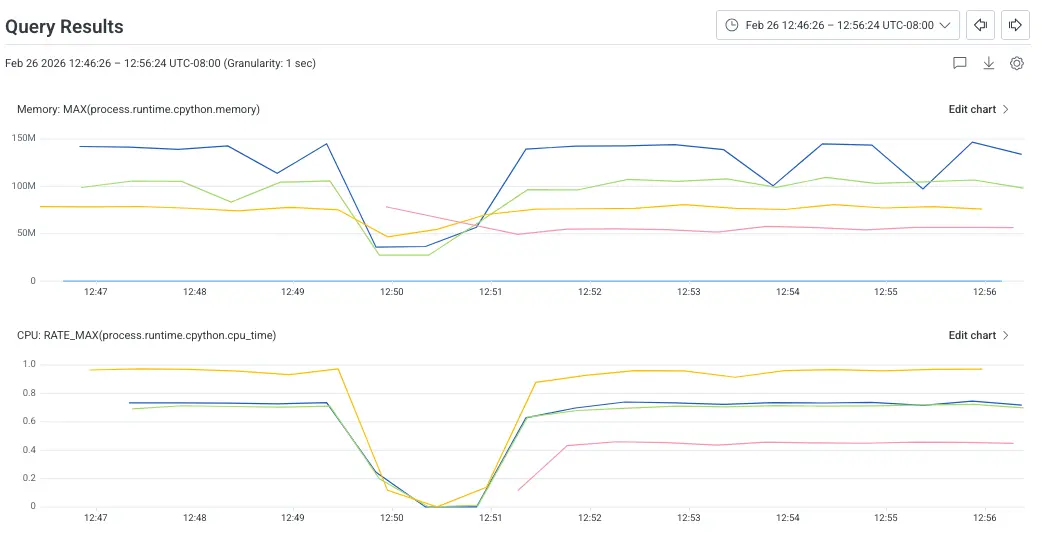
The initial results, the red line in the above image, are really exciting! Both the CPU and memory footprints are lower than all the other SDKs.
What’s next?
The existing implementation is still at the very early stages, but the code is available in a GitHub repository. Currently, it only supports the tracing signal and emits OTLP to a local Collector only. If you're thinking this would be useful to you and you'd like to help implement support for other signals, create an issue in the repository to let us know.