Shifting Metrics Right
The idea behind shifting things to the left, meaning to move certain actions to the start of the process rather than the end or the middle, is around increasing development efficiency by reducing rework or changes. We remove waste from the process by getting it right the first time.

By: Martin Thwaites
Metrics now generally available in Honeycomb
Join us for a live tour & Q&A session on Honeycomb Metrics. Ready to get hands-on? Honeycomb Metrics is already included in Enterprise subscriptions. Existing Free or Pro customers can request an Enterprise trial to try…
Learn More
In the shift left era where it feels like we’re pushing everything as far to the start of the SDLC as we can, it may seem counterintuitive to shift anything right. That is, however, exactly what I suggest when it comes to generating metrics. How far you go to the right of the SDLC is a much more nuanced question and is dependent on a lot of factors, and on what metrics you’re talking about.
If you’d just like to experiment with generating metrics in the Collector, try this prompt in your agent:
1. Reference the official OpenTelemetry HTTP semantic conventions for metrics: - Look up the stable HTTP server metric specifications at https://opentelemetry.io/docs/specs/semconv/http/http-metrics/ - Identify the required and recommended metrics for HTTP servers - Use the exact metric names, attributes, units, and descriptions defined in the semantic conventions
2. Generate these metrics using the signaltometrics connector: - Use sum metrics for counting requests - Use exponential_histogram for duration metrics (for more granular buckets than the standard explicit bucket boundaries) - Apply proper OTTL expressions to extract values from spans:
* Use Int(AdjustedCount()) for counting spans (accounts for sampling)
* Use Microseconds(end_time - start_time) for calculating durations
3. Include all standard HTTP semantic convention attributes as metric dimensions (http.request.method, http.response.status_code, url.scheme, etc.)Learn more about Honeycomb Metrics
Schedule your custom demo with one of our experts today.
Shifting right vs. shifting left
The idea behind shifting things to the left, meaning to move certain actions to the start of the process rather than the end or the middle, is around increasing development efficiency by reducing rework or changes. We remove waste from the process by getting it right the first time, which is facilitated by getting feedback quickly, which makes sense when we’re doing something that requires a lot of time and effort to change, like implementing functionality into your product. When a change can easily be made, it doesn’t make sense to frontload that work but rather move it to the end.
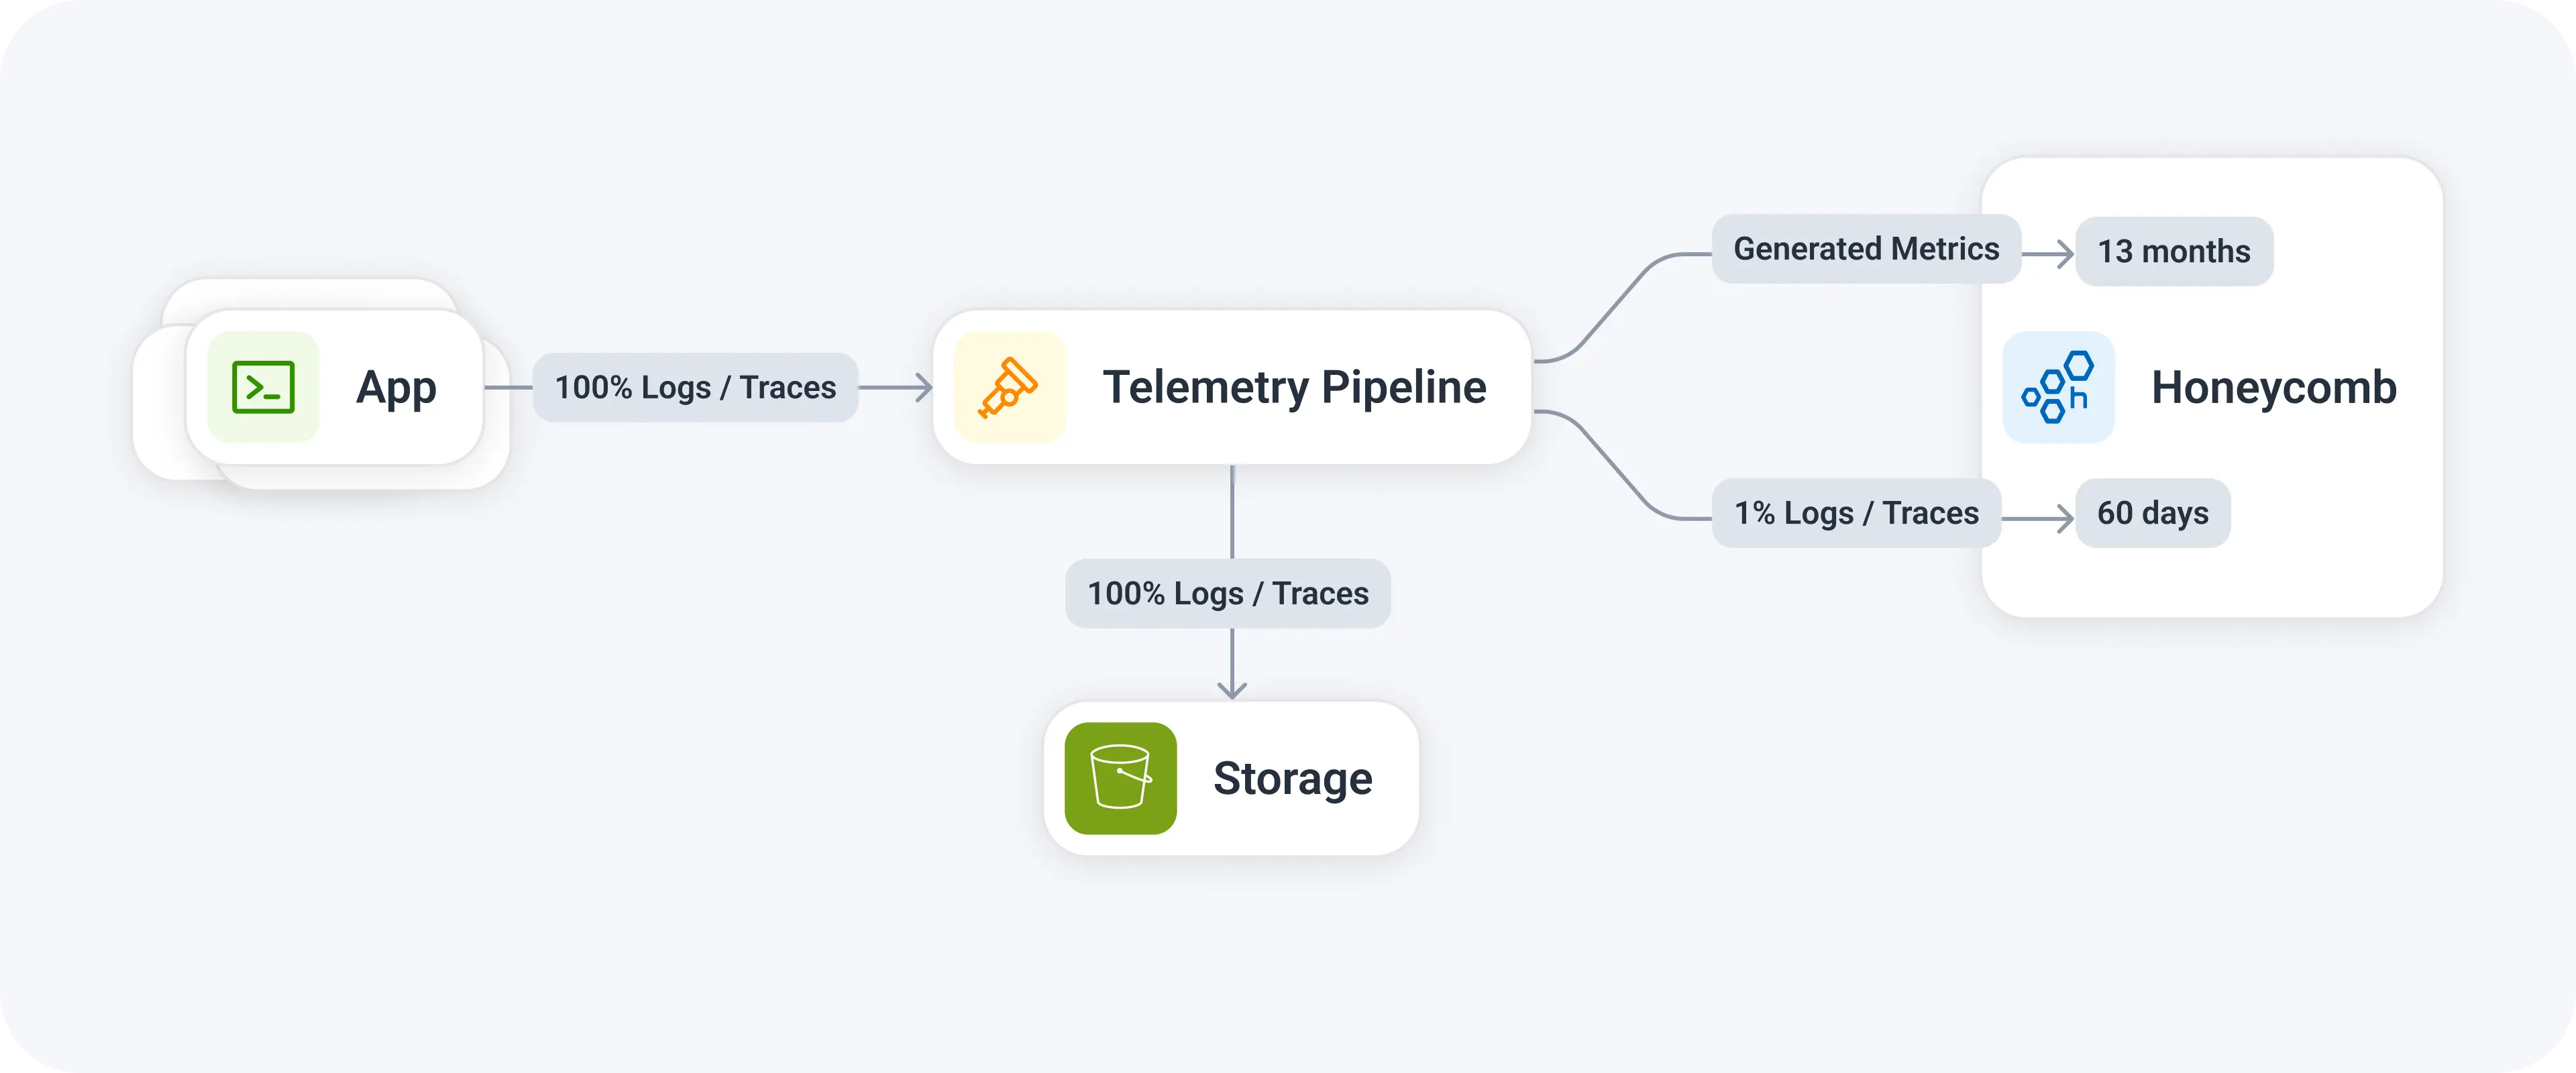
With metrics, we can generate the aggregation (metric) in lots of places in the telemetry pipeline where: in the application; later in the pipeline, like in the Collector; or in the backend platform. The decision on where to generate that aggregation is nuanced, as there are benefits and drawbacks to each.
Is it a metric, or a measurement?
Choosing which metrics to create is a subjective (and often contentious) topic. It’s important to make the distinction that a Metric is not a graph, it’s the underlying data type or storage of the data. You’re pre-generating data that is stored in a specific way so it can be queried later.
These “Metrics” are generally tied to questions we want to answer by getting some kind of measurement:
- What’s the average number of HTTP requests we get per hour?
- How many checkout requests are we getting per minute?
- How many product views did we get by product ID?
The question we need to answer is, are these Metrics, or just measurements? By this I mean, do we need that data to be pre-aggregated?
There is no doubt that these are valuable questions you will have of your production data, nor is there doubt that you’ll want to graph this data over time. The question is only where/how we generate those graphs and insights. If we focus on the measurements we want, we can separate that from the generation of those measurements and decide when is the best time to create that.
Accuracy is a myth
One of the big justifications I hear for generating pre-aggregated data inside applications is that data accuracy is lost due to sampled/filtered data inside the later stages of the pipeline. So if you go all the way to the right, such as generating the data in real-time in Honeycomb, trace sampling and query sampling means you get an inaccurate result. It is absolutely true that you’ll end up with a graph that is representative and not 100% accurate to traffic that was generated in the application, however, that’s totally fine when you’re looking at the data for operational purposes.
If you’re running tail sampling properly (using dynamic, adaptive sampling like Refinery does), then accuracy loss is likely so minimal that it will not impact the decisions you make. As an example, a customer of ours ran a comparison recently and their trace/log sampled metrics generated in Honeycomb in real-time was within 0.001% margin of the pre-aggregated data, and a fraction of the cost of the high-cardinality metrics that their team had been generating.
What makes this even more compelling is that metrics, as a pre-aggregation, require an element of “buffering” of the data inside the application so that a single, aggregated datapoint is output. This could be anything from 10 to 60 seconds. If the application crashes unexpectedly (and unhandled) during this window, you could lose those datapoints, and therefore your eventual data is both inaccurate and you’re likely unaware. By contrast, emitting raw log and trace data is normally done within a second, reducing the impact of lost data in the event of a crash.
Depending on the size of your system, the granularity of your metrics, and the type of application (serverless, monolith, ephemeral jobs), the accuracy of your graphs will be impacted no matter which approach you take.
Converting traces and logs to metrics
My advice is to generate the measurement data at the last responsible moment in your pipeline, where possible. This will generally be done by using an OpenTelemetry Collector. Whether this is via a sidecar, within your Kubernetes cluster as an agent/gateway, or within a centralized observability gateway, you’ll need the signaltometrics connector to do this.
This connector can take logs or spans then stream them through a generator to build whatever metrics you need. The config is fairly simple:
signaltometrics/http_server:
    spans:
      # HTTP Server Request Duration (required metric per semconv)
      - name: http.server.request.duration
        description: Duration of HTTP server requests
        unit: s
        exponential_histogram:
          count: Int(AdjustedCount())
          value: Seconds(end_time - start_time)
          max_size: 50
        attributes:
          - key: http.request.method
          - key: http.route
            optional: true
          // other attributes
        include_resource_attributes:
          - key: service.name
        conditions:
- span.kind == SPAN_KIND_SERVERBy doing this, you can generate exponential histograms instead of normal histograms, which provide even more granularity of the results when querying. In addition, if you’re sending these to us, you don’t pay extra for exponential histograms, so you get extra accuracy and resilience… for free!
Conclusion
Separating the idea of “things I need to measure” from “metrics I need to generate” is an important distinction that can unlock a ton of savings beyond turning on the default metrics in your applications. Moving the control of generating those metrics further down the pipeline allows you to get faster feedback on the data you generate.
It’s worth considering if you could generate your RED metrics during the pipeline, and think about whether you need those custom metrics for the number of orders. If you do, maybe do that in the Collector.
YMMV on all of these approaches. You need to consider them as different methodologies available to you.