The Honeycomb Beeline for Go v2 is…Go!
We’ve seen folks do amazing things using our Honeycomb Beelines–getting their apps instrumented in next-to-no time, expanding their observability, growing their understanding of what is happening in their code in production. Now, prepare to…

By: Ben Hartshorne
We’ve seen folks do amazing things using our Honeycomb Beelines–getting their apps instrumented in next-to-no time, expanding their observability, growing their understanding of what is happening in their code in production. Now, prepare to do more with improved tracing support! Some of what’s included with the new version (v0.2.2):
- Still easy to install and configure
- Add not just fields to an event but spans to a trace with our easy-to-use API
- Inter-process tracing Just Works™️
- Trace-Aware Sampling
- Facility to scrub data on the way out
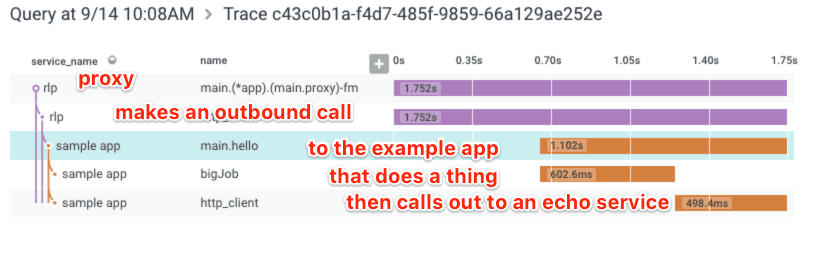
So many new features! But rather than going through them all, I want to walk through wiring up a small example that highlights the thing I’m most excited about: inter-process tracing. I had a rate limiting tarpitting proxy lying around, so I put it in front of one of the Beeline example apps just to see what would happen:
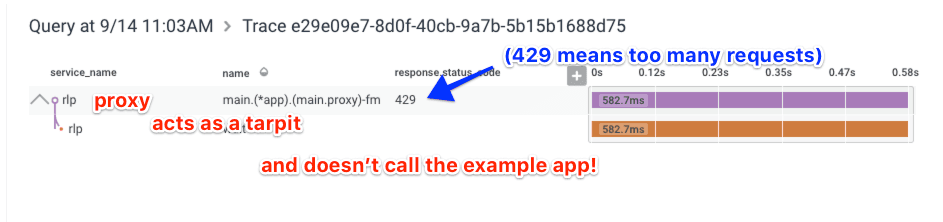
And then when you’ve exceeded your rate limit…
It worked!!!
Ok, let’s look at some actual code and what it took to do this with the Go Beeline.
There are basically four changes to the uninstrumented version of the rate limiting proxy:
- initialize the Beeline
- wrap the HTTP listener to capture incoming requests
- use a custom RoundTripper for outbound requests
- add custom fields sprinkled throughout the code replacing log lines
If you want to follow along, there are two repositories for the code we’re looking at: rate limiting proxy and one of the Beeline’s sample apps. Note that if you want to recreate this you’ll have to add your Honeycomb API key to the beeline Example manually, set STDOUT to false, and change it to listen on port 8090.
Initialization
The initialization in the rate limiting proxy is a little more than you see in most of our code examples. In the examples, we don’t suggest any particular method of managing the write key, but in the rate limiting proxy I pull it from the environment. If the env var is not set, the proxy will spit events to STDOUT instead. This is a useful setup for doing development, and it’s likely a production deploy will have something even more complicated.
wk := os.Getenv("HONEYCOMB_APIKEY")
var useStdout bool // defaults to false
if wk == "" {
        useStdout = true
}
// Initialize beeline. The only required field is WriteKey.
beeline.Init(beeline.Config{
        WriteKey:    wk,
        Dataset:     "beeline-example",
        ServiceName: "rlp",
        // In no writekey is configured, send the event to STDOUT instead of Honeycomb.
        STDOUT: useStdout,
})Incoming requests
It might seem like overkill to spend an entire section focusing on capturing incoming requests; it’s a one line change. However, if this app were more advanced, it would get more interesting. This app doesn’t use an HTTP router (just the standard net/HTTP HandleFunc) but depending on the HTTP router used (e.g. Gorilla, httprouter, Goji, etc.), there may be more work necessary to get the most valuable bits of information out. By wrapping the outermost invocation of the router, we get basic information about the requests coming in (client IP, URL, etc.) but that’s it. Wrapping inner handlers means the wrapper gets called after the router has done URL parsing and pulled out variables! If any of your routes have REST-style variables, wrapping after they have been parsed gets you those variables separated out of the URL. It’s fantastic for grouping (e.g. /fetch/123 and /fetch/124 should really both group to /fetch/:id), and wrapping further downstream gets you this. You can see more about this in the docs for each router wrapper (e.g. hnygorilla). But for now, the rate limiting proxy is simple enough that it doesn’t have any of that and getting a record of all incoming requests is no more than wrapping the only handler.
http.HandleFunc("/", hnynethttp.WrapHandlerFunc(a.proxy))The biggest thing that this wrapper does (in addition to catching all the useful attributes of an incoming request) is to create the structure to build a trace (IDs, mainly) and put in in the request’s context. In all functions downstream from this wrapper, we can get trace information back out of the context.
Outgoing requests
Capturing outbound requests is a little more interesting. The wrapping happens at the RoundTripper interface so we need to use a custom HTTP client instead of the default. Using a custom HTTP client is almost always a good idea anyway — the default has timeouts that are incompatible with a reliable service. Nathan Smith has a great article describing how this failure happens: Don’t use Go’s default HTTP client (in production).
In order to reuse connections, I initialize the HTTP client on startup then put it in the app struct so it can be reused for each outbound request. The only Beeline-related line to add into this block is the additional hnynethttp.WrapRoundTrip wrapper around the http.Transport.
// create a custom client that has sane timeouts and records outbound events
client := &http.Client{
        Timeout: time.Second * 10,
        Transport: hnynethttp.WrapRoundTripper(&http.Transport{
                Dial: (&net.Dialer{
                        Timeout: 5 * time.Second,
                }).Dial,
                TLSHandshakeTimeout: 6 * time.Second,
        }),
}

a := &app{
        client:      client,
        rateLimiter: make(map[string]*leakybucket.Bucket),
}Ok, now that the wrapper is in place, we will get a Honeycomb event for each outbound HTTP request. But we can do even better: The wrapper we put on the incoming request put a trace ID in the request’s context. By passing this same context through to the RoundTripper wrapper, we can connect the events for outbound requests to the request that generated that request and get them all visualized as one contiguous trace.
To attach the context to the outbound request, we need to create a request object, set its context, then exec that request. This is a little different from some of the convenience functions included in the http package (like Get()).
downstreamReq, err := http.NewRequest(req.Method,
                                      downstreamTarget+req.URL.String(), buf)
downstreamReq = downstreamReq.WithContext(req.Context())
resp, err := a.client.Do(downstreamReq)By creating a request object, we can set its context. Setting the context connects the trace. Finally, we use the stored client to execute the request.
The Honeycomb RoundTripper does one more thing: Given the context that has the trace information, it serializes that state and includes it as a header in the outbound request. This is what will let the downstream sample app get connected into the same trace.
Adding further context
At this point, we have a pretty good base. We have an event representing the incoming request, with all the default attributes. We have an event representing the outbound request, with a bunch of useful attributes. But we still want more: In the case where we bounce the request because it has exceeded its rate limit, there should be another span representing the amount of time it spent holding on to the connection (the tarpit behavior). Let’s add it!
if hitCapacity != nil {
    beeline.AddField(req.Context(), "error", "rate limit exceeded")
    ctx, span := beeline.StartSpan(req.Context(), "wait")
    defer span.Send()
    sleepTime := math.Abs(waitBaseTime + (rand.NormFloat64()*waitStdDev + waitRange))
beeline.AddField(ctx, "wait_time", sleepTime)In this block, first we add a field to the existing request event to indicate that the rate limit was hit. We then start a new span called “wait” and add a field to it indicating how long we’re going to spend waiting. That’s it! With that pair of lines (StartSpan and defer span.Send), we have another span in our trace. And actually, wait_time isn’t such a useful field to add here because all spans get a timer and this span isn’t doing anything but sleeping. The duration_ms field on the span will match wait_time almost exactly (it’ll be a little bit longer because of overhead).
Beyond that extra span to visualize time spent waiting, there are other random bits it would be nice to add in. When errors happen, it would be nice to have that reflected in the event. If the call to the downstream service failed, let’s include more information about why it failed. When we’re looking at this later, it’d be nice to know the difference between the downstream service timing out, not answering, or giving an errored response:
// call the downstream service
resp, err := a.client.Do(downstreamReq)
if err != nil {
    w.WriteHeader(http.StatusServiceUnavailable)
    io.WriteString(w, `{"error":"downstream target unavailable"}`)
    beeline.AddField(req.Context(), "error", err)
    beeline.AddField(req.Context(), "error_detail", "downstream target unavailable")
    return
}With this code, in addition to the 503 status code (aka Status Service Unavailable), we’ll get the error returned by the HTTP client, which may contain more information. (e.g. something like dial tcp 127.0.0.1:8090: i/o timeout)
Compare the full source
To help see all the changes necessary to the rate limiting proxy, I made a branch that has all the Beeline stuff removed. Here is the comparison in GitHub! The non-Beeline version had to have a few fmt.Print lines and a timer added to get at least the equivalent of an access log printed to STDOUT so we could see something about what was happening instead of just silence. Without Honeycomb to see into the operation of the app, an access log seems like the best option. Here’s what the uninstrumented version looks like while running (the 127.0.0.1 is the “remote” address; I was running curl against my laptop to generate this log.):
2018-09-15T08:25:50-07:00 127.0.0.1:49567 /hello/ 429 454.449419
2018-09-15T08:25:50-07:00 127.0.0.1:49573 /hello/ 429 570.478635
2018-09-15T08:25:50-07:00 127.0.0.1:49579 /hello/ 200 344.604710
2018-09-15T08:25:50-07:00 127.0.0.1:49570 /hello/ 429 697.303438
2018-09-15T08:25:50-07:00 127.0.0.1:49588 /hello/ 200 398.655236
2018-09-15T08:25:50-07:00 127.0.0.1:49589 /hello/ 200 424.107291
2018-09-15T08:25:50-07:00 127.0.0.1:49578 /hello/ 200 491.651590A note on upgrading
We have removed two function calls from the previous version of the Beeline. This makes the new version upgrade a breaking change. If you are using the ContextEvent or ContextWithEvent functions you must remove them before upgrading.
Putting it all together
This new version of the Go Beeline is as easy to use as the previous version, and now lets you add more spans and form traces of your entire app execution! It’s super easy to take each of these phases incrementally too – start by adding only the initialization and outermost HTTP listener wrapper, and then include more wrappers and fields as you need to.
Give it a try! And if you’re not yet using Honeycomb and want to start, head over to our signup page.
Want to know more?
Talk to our team to arrange a custom demo or for help finding the right plan.