What Is Application Performance Monitoring?
Application performance monitoring, also known as APM, represents the difference between code and running software. You need the measurements in order to manage performance.

By: Rox Williams
Every business is a software business. And by software, we don’t mean code—we mean running software serving customers in production. Those customers may be internal to the company, they may pay you money, or they may represent attention that increases ad revenue—either way, making them happy is your business. And your fast, reliable software makes them happy.
Application performance monitoring, also known as APM, represents the difference between code and running software. You need the measurements in order to manage performance. APM answers these questions:
- Is my application working?
- Is anybody using it?
- How long does it take?
- How many resources does it consume?
- And, if you’re lucky: How does each piece of software and infrastructure fit together to serve each customer?
What is APM?
Traditional monitoring started with infrastructure, making sure servers were up and healthy. APM brings this level of metric rigor to applications, recording uptime, requests received, statuses returned, latency, and resource usage for each running process.
With this information, we can:
- Prove we’re meeting SLAs.
- Notice when the app gets slower over time.
- And if you’re lucky, figure out why!
- Alert when error rates shoot up, and roll back broken changes.
Typically, APM includes performance metrics, error detection, and—this is the ‘if you’re lucky’ part—distributed traces.
How does APM work?
To bring you this useful information about the performance of your application, APM requires:
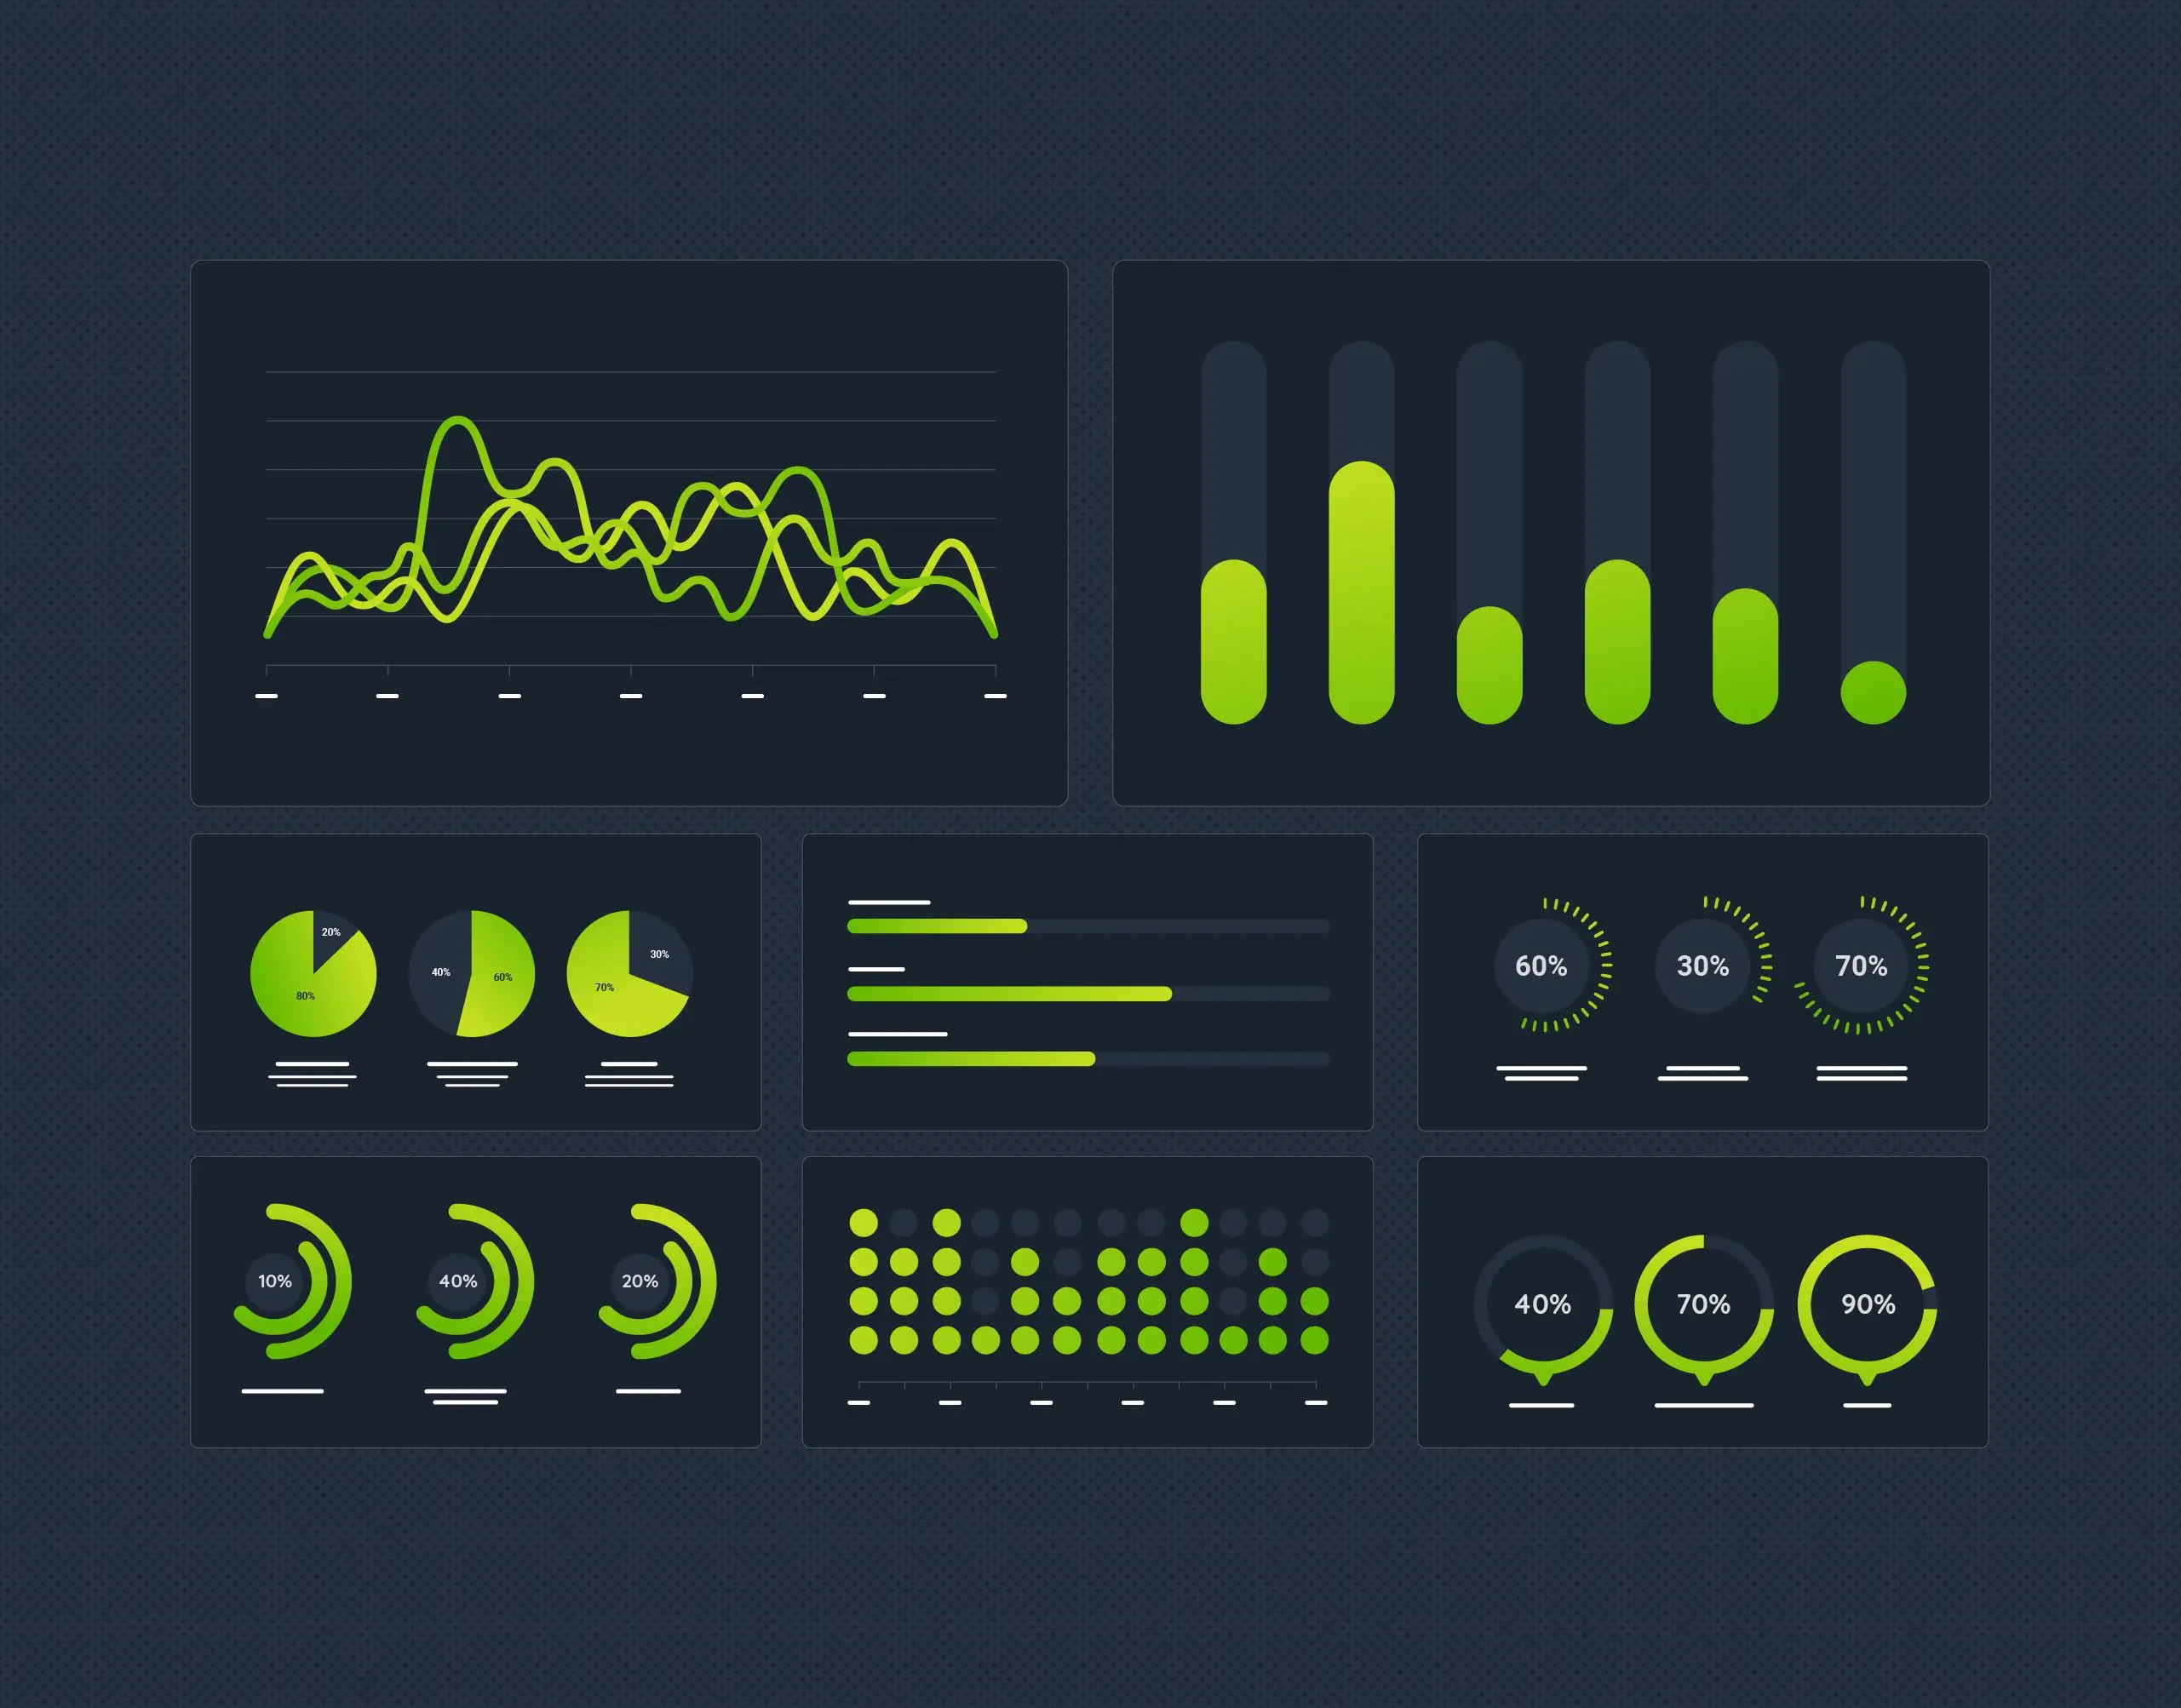
- A user interface that displays the data, usually as big numbers and graphs over time.
- A database to store this data.
- Code that emits this data (which is called telemetry).
This data can include time-series metrics, error events, and structured logs or trace spans. The data can have two sources: your application itself (as libraries compiled in, or as a runtime agent glommed on) or an agent running near your code that sniffs network traffic and server conditions. “Both” also works.
Some APM vendors offer all these components. Others let you use open-source standard tooling like OpenTelemetry for the parts in your applications and running in your infrastructure.
Benefits of APM
What does all this rigamarole get you?
In the short term, APM helps operations keep the software up. People can get alerted when it goes down. Depending on how much detail underlies the error messages and transaction tracing, it can be a tool to diagnose where problems are happening.
In ongoing application development, SREs and programmers can use APM to detect memory leaks, notice performance-critical parts of the code and improve them, and drill into exceptions that reveal a misunderstanding of how this shit ever works.
APM is an important input to business decisions. With enough granularity, it reveals which features are most useful to customers. It can show whether engagement with the software is growing or shrinking. And, it tells us when we need to put effort into scaling.
Limitations of APM
This is all very well at a high level. Every business has to worry about latency, error count, CPU, and memory. It gets trickier when you want to know something specific to your business.
If your software is multi-tenant with different configurations, volumes, and usage per tenant, then every customer experience might be different. You need that granularity. Time-series metrics become very expensive.
Error rates in general are easy to measure, but each specific error is its own problem. Most APMs use different data sources at these two scales: metrics for aggregates, and logs or traces for specifics. It is hard to move between these in ways that help you prioritize and quickly fix the most important errors.
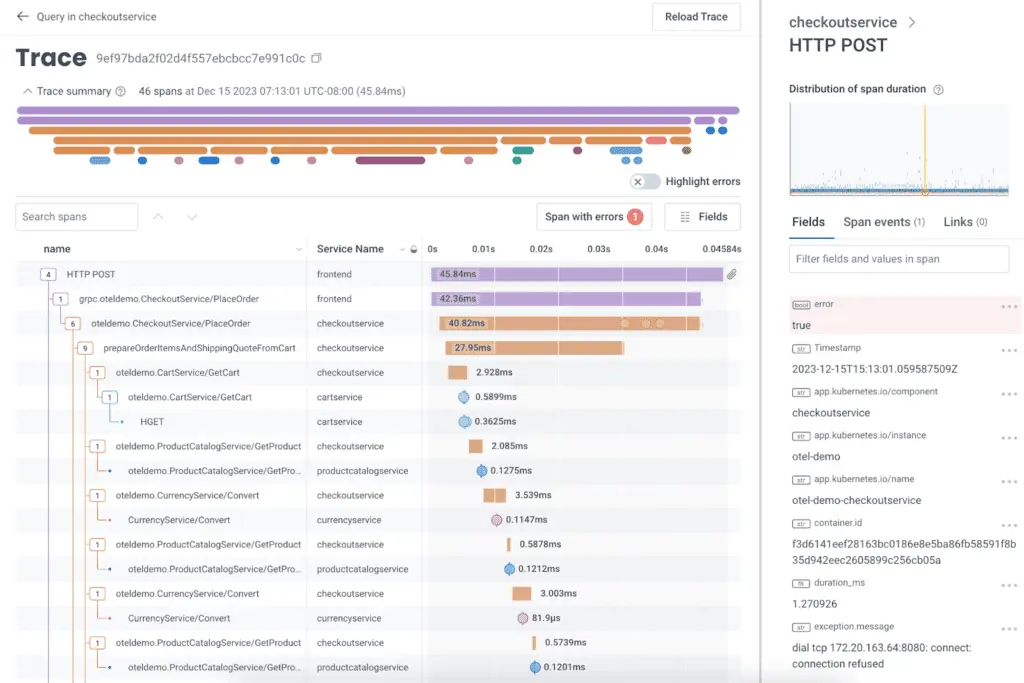
Distributed traces provide the best overview of the whole system. They can reveal the structure of connections between services. When these are generated through bolt-on tools, they’re limited in the detail they can provide. Those details typically live in logs, which are in a different tool and not tied together well.
Picture: aggregates in metrics (graph), rough distributed trace with some arrows, and a bunch of logs with lots of details (these are just squiggles). Highlight the high level; contextual view; and detailed view.
Hopping between these levels of detail is a challenge of APM.
Scaling is also a problem
Metrics scale very well—as long as you let them combine. But when you go to drill into a problem, all that combining backfires: the detail of which server, which Kubernetes deployment, which instance, etc. is lost. Tracking usage and error per customer is out.
Logs work very well in local development, and they’re OK in test environments with low volume. But once you get into serious production volumes, you don’t need to search anymore—you need analysis. The more logs you have, the harder it is to get useful info out of them. APM doesn’t even engage here.
Distributed traces scale extremely well for debugging and troubleshooting from local, to test, to production. This is because each request tells its connected story. However, getting the right level of detail in them doesn’t happen with external agents. You need business-specific fields, which you can add with custom code, either with vendor libraries or with OpenTelemetry.
In production, though, distributed traces can get expensive quickly—it’s too expensive to keep all of them. You either settle for a few exemplars, or hope your vendor works with you on configuring just the right sampling. In essence, the right APM vendor is one who helps you lower costs without compromising on the value you get.
The rise of observability
APM is one facet of observability. Observability is the property of systems that describes how well you can understand what is happening inside by looking at the telemetry they emit.
With only generic agents, you’re not gonna get better. But with a little customization, such as canonical logs or OpenTelemetry tracing, you can get exactly the information your business needs.
More advanced observability includes the ability to graph over fields like customer ID, and on quantities you didn’t expect to count. Maybe today the amount of the order makes a difference. Maybe tomorrow it will be the customer’s browser version.
Top observability tools do not attach a cost to this kind of information. And they can aggregate over this data in trace spans or structured logs, so that a single source of telemetry backs all the information displayed in APM. This accelerates incident resolution, and also development because software engineers can dig around in production data to understand the circumstances their code is called in.
Also, top observability tools don’t restrict who can see it via ‘per seat’ licenses. That lets observability have a wide impact on a business and culture: from product to customer support, VPs to operations, everyone can glean what they need from careful telemetry in your most valuable software.
Want to learn more about APM vs. observability? We got you covered.
Read our O’Reilly book, Observability Engineering
Get your free copy and learn the foundations of observability,
right from the experts.
APM tools and solutions
When implementing or replacing APM, consider:
- Short term: how long will it take to roll out?
- Medium/long term: how will it support business and operational decisions? How important is incident resolution speed? Do you have a team to support it?
- Long term: how will you improve it over time, and what will that cost? How will this information change the way your teams work?
Find a vendor
For the fastest rollout time, a vendor with their own custom agents may fit the bill. You’ll pay for this with lock-in, so beware first year discounts and plan on paying sticker price. You’ll also pay for customizations, so if your business is special in any way, the cost of metrics will be less predictable.
Alternately, build your own solution
If you have an observability team of at least five people, you can consider operating your own stack. You’ll pay for this in business focus, or else have no improvements ever.
Implement OpenTelemetry from the start
A balanced solution uses OpenTelemetry internally so that telemetry is in a standard format. Typically, a platform team helps get the right libraries installed, along with OpenTelemetry agents and pipeline. Then, choose a SaaS solution for database and UI. All the major vendors support OpenTelemetry data (to various degrees; do your research on this).
OpenTelemetry supports improvement over time, as you can add specific fields to traces and logs with a line of standard code. However, each SaaS vendor handles these custom fields differently.
Migrate to observability 2.0
To support a move from classic APM to top-notch observability, look for a pricing plan that encourages adding full information to telemetry. To keep costs down, look for one that will work with you on controlling volume while keeping all the information you need.
Finally, consider how your business can change and grow with the observability you achieve. Standard APM may be enough for now. Modern observability, however, will enable teams across your business to make data-informed decisions: product can tell how features are used; customer support can trace the triggers of errors; operations can optimize cloud costs; and software developers can be faster and better at their work.
APM best practices
Following these APM best practices helps ensure better control and scalability of software:
- Retain ownership of code that runs in your network by using OpenTelemetry instead of vendor-specific libraries.
- Plan for expansion. Custom fields get you the most value, and you don’t know how many of them will be important in the future.
- Emit structured logs with company-standard field names, for best analysis.
- Give everyone access. APM is about closing feedback loops between developers and their code; operators and their resource allocations; product and their feature decisions; and the whole business and customer value creation. Let it change how you do things.
The future of APM
Advances from APM into wider observability are driven by applications moving to the cloud and becoming more fine-grained (from microservices to serverless), and the need for developers to support (and therefore understand) more and more software. As we incorporate nondeterministic components into our software (like adding generative AI features), we need every more observability to keep it working the way we want.
Meanwhile, advances in automation and machine learning affect APM. Kubernetes takes care of a lot of operational tasks, like scaling up and down based on usage levels, and restarting applications that aren’t healthy. Artificial intelligence might take this further. But our business is always changing, supported by our software that also is always changing. No one understands where we are going like our people do. As APM incorporates more and more technology, the best result is not how smart it gets, but how smart it makes us.
For a modern observability solution like Honeycomb, APM is one expression of a deeper system property of observability. Having all the available context—no matter how detailed—on every structured log or (better) trace span, graphing all the metrics at any granularity on demand, and flying back and forth between aggregate and individual levels, because it all comes from a single datasource—this is the future of APM, compatible with the present and future of cloud-native, integrated, customer-beloved software.
Want to know more?
Talk to our team to arrange a custom demo or for help finding the right plan.