What Is Auto-Instrumentation?
Instrumenting your code generates telemetry that shows you how your system is performing, and whether your system is healthy.

By: Mike Goldsmith
The Director’s Guide to the Future of Observability: AI, OpenTelemetry, and Complex Systems
Download
In the past, we’ve written about what instrumentation is and the insights it provides. Instrumenting your code generates telemetry that shows you how your system is performing, and whether your system is healthy.
Like with most other companies, at Honeycomb we don’t write all of the code that runs in our systems. Instead, we rely on a wealth of both open-source and commercial enterprise software to do repetitive tasks, boost our productivity, and solve tough problems so that we can focus on writing applications that drive value for our business.
In this blog, I’ll dive into how you can instrument code—even if it was written by someone else—using OpenTelemetry, and I’ll show you how to mix automatic and custom (also known as manual) instrumentation.
Read our O’Reilly book, Observability Engineering
Get your free copy and learn the foundations of observability,
right from the experts.
Instrumenting someone else’s code
Working with someone else’s code is where auto-instrumentation steps in to save the day. Auto-instrumentation works slightly differently within each language, but the general idea is that it attaches hooks into popular tools and frameworks and “watches” for certain functions to be called. When they’re called, the instrumentation automatically starts and completes trace spans on behalf of your application.
Spans created by auto-instrumentation are essentially the same as any other span created manually. They share the same trace ID as any other child spans created manually, and together, they all form a complete trace. Automatically created spans are also passed along the same tracing export pipeline as spans created manually and are all sent to your trace visualizer of choice.
Enough words, time for some pretty graphs!
The trace visualization below is for a simple Java web application that responds with a “hello world” message. In the app code, a manual span is created to trace what happens inside the hello endpoint.
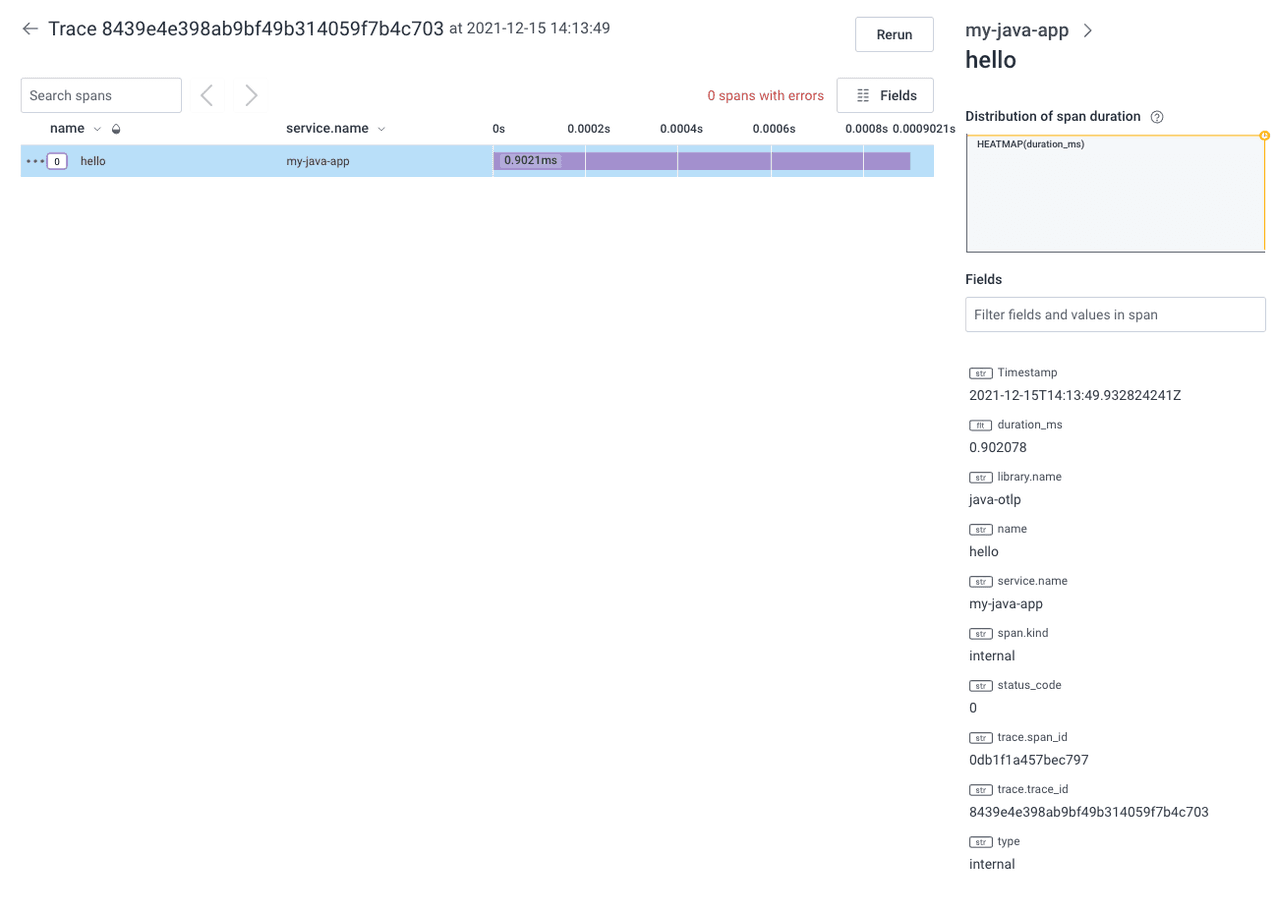
The above waterfall trace visualization shows one single manually created span.
In the next trace below, I have enabled auto-instrumentation for the same simple web application. The trace now has two extra automatic spans. The first span is added automatically by the HTTP web server (Tomcat), the second is added automatically by the MVC framework (Spring), and the third is our original manual span. The two additional automatic spans include useful information about what was happening in the application’s runtime such as the HTTP response code sent back to the client and which controller handled our request.
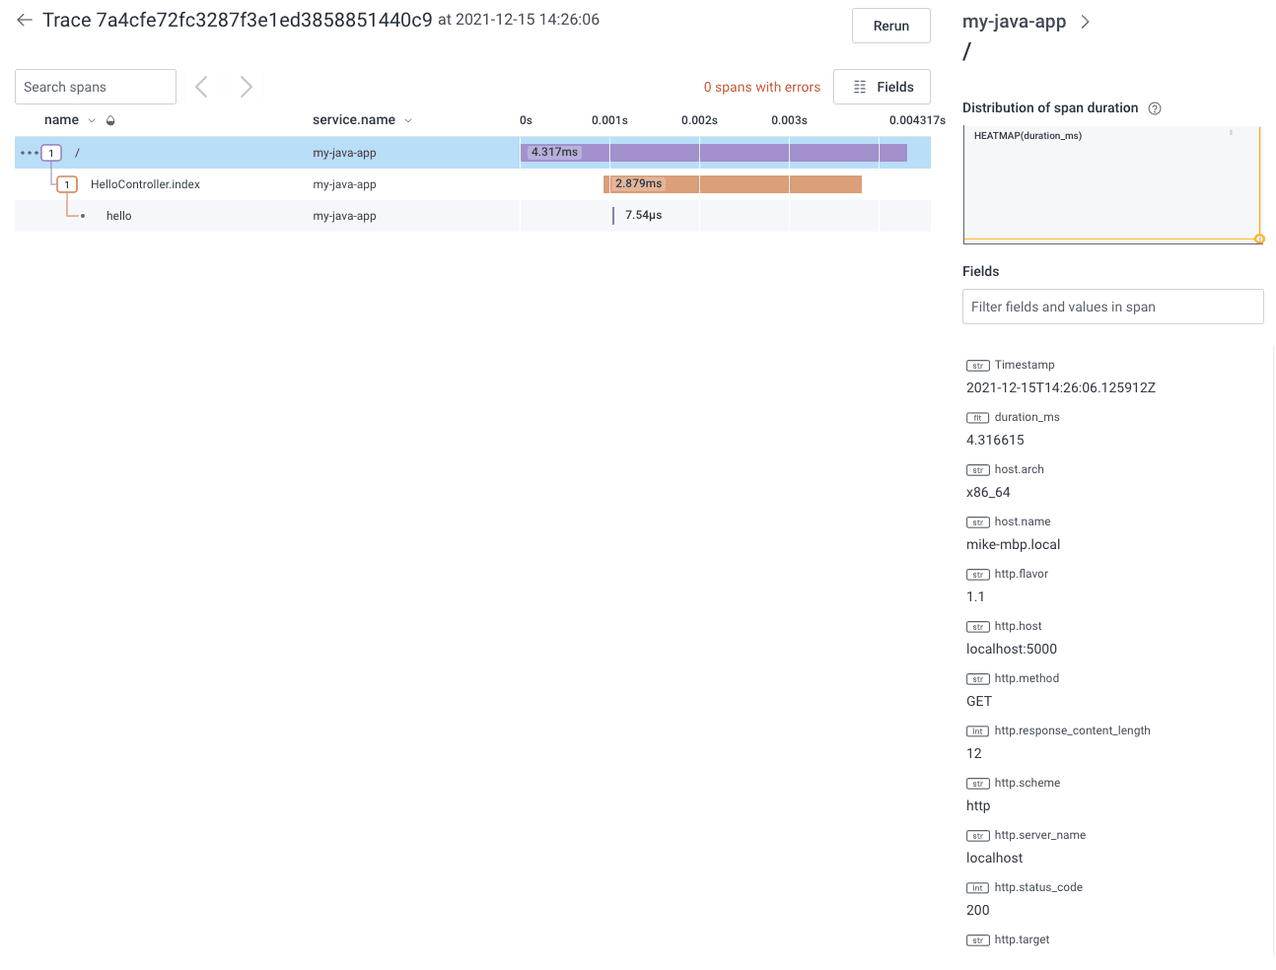
This next trace visualization shows the original single manually created span, but also includes two new spans that were automatically generated.
As you can see above, the auto-instrumented application provides far more insight into what is happening in your application by showing you what happened in the underlying components that your application utilizes, even if you did not write that code yourself.
Enabling auto-instrumentation
Enabling auto-instrumentation is typically a straightforward process that involves setting some environment variables (or via another configuration format) and running your application through the auto-instrumentation tooling.
For example with Java, you can use the OpenTelemetry Java Agent to run your application. The Java agent is loaded with all the additional instrumentation and configures the hooks into your application that create spans for the supported Java tools and frameworks it understands.
To use the Java agent to run an application, you need to first download the Java Agent jar, then provide the path to your application as a parameter. The example below is a basic illustration on how you could configure the Java agent to run an application using system properties and send its telemetry to Honeycomb for visualization:
java -javaagent:path/to/opentelemetry-javaagent.jar \
    -Dotel.resource.attributes=service.name=my-service-name \
    -Dotel.exporter.otlp.endpoint=https://api.honeycomb.io \
    -Dotel.exporter.otlp.headers=x-honeycomb-team=my-api-key,x-honeycomb-dataset=my-dataset
-jar myapp.jarMixing custom instrumentation and auto-instrumentation
Congratulations, you’ve taken the first step into the wild world of auto-instrumenting your application. While that’s an important first step, auto-instrumentation only gets you so far. Auto-instrumentation generates telemetry for underlying runtime components, but it cannot see inside your custom application logic to understand what’s going on or why it’s important.
Auto-instrumentation helps you understand the context surrounding your application, but to see how that connects inside the application code you wrote, you need to both enrich spans with additional attributes and create new spans.
Enriching spans means adding attributes to the current span (even ones created by auto-instrumentation) to capture useful information. A good example of this might be adding a userID to a span to understand which users are calling a particular endpoint. Another example is recording whether a cache hits, true, or misses, false. You don’t need to worry about pruning or limiting the number of details; just add it to the current span as attributes!
Honeycomb encourages you to send ultra-wide events with all the attributes you need: one span with very few attributes counts against your usage the same as one event with thousands of attributes. You may not need that data right now, but it might be useful someday. So go nuts and add in as many attributes as you think could be useful.
You can also create new spans as your application calls other parts of the system or to track what happens when a specific piece of code is called. For example, a web application may create a span when making a database call to encapsulate when the call is made and enrich it with the query parameters.
Auto-instrumentation is a fantastic first step to see how your application interacts with tools and frameworks you use, but on its own, it doesn’t give a complete view. For instance, which user made this request? What application logic triggered this call? What conditions was your code expecting to see when this request was made? All of that information can be useful later when trying to debug unexpected performance in your code.
Mixing in auto-instrumentation that tells you what underlying components are doing alongside custom instrumentation that tells you about specific conditions that are important for the code you wrote, provides a rich and colorful picture of what the entirety of your application is doing.
OpenTelemetry and auto-instrumentation
OpenTelemetry is a vendor-neutral, open-source project committed to providing instrumentation for popular tools and frameworks for each supported language. You can learn more about what’s available for the languages that you’re interested in on their Registry. (P.S. You can filter by language).
If you find a framework or tool that you use or even maintain and would like to see instrumentation for it, you can always create issues or pull requests to add it for the SDK you would like to see it available for.
Honeycomb is committed to supporting OpenTelemetry.
Getting started with OpenTelemetry
OpenTelemetry provides official SDKs and auto-instrumentation packages for all major languages. These vendor-neutral tools automatically generate telemetry for popular frameworks while allowing full control over configuration.
Auto-instrumentation by language
- Java: OpenTelemetry Java Instrumentation
- .NET: OpenTelemetry .NET Instrumentation
- Node.js: OpenTelemetry Node.js
- Python: OpenTelemetry Python
- Go: OpenTelemetry Go Instrumentation
Sending data to Honeycomb
Configure the OTLP exporter to send telemetry to Honeycomb's endpoint (https://api.honeycomb.io) with your API key via the x-honeycomb-team header and dataset via x-honeycomb-dataset. See Honeycomb's OpenTelemetry documentation for detailed setup guides.
Learn more
Interested in trying out instrumentation or OpenTelemetry, and seeing how they can help you surface issues and debug faster? Sign up for a free Honeycomb account to try it out for yourself. Or, if you still have questions, book office hours with one of our Developer Advocates—we’re here to help you on your observability journey.
Editor's Note: This article was updated in February 2026 to reference the official OpenTelemetry SDKs. Honeycomb previously maintained OpenTelemetry distribution packages but now recommends using the official implementations.
Want to know more?
Talk to our team to arrange a custom demo or for help finding the right plan.