How tastytrade Moved a Data Center and Solved Challenges Along the Way
The brokerage migrated its entire production infrastructure while running full trading operations using Honeycomb to find hidden issues in the gaps between old and new.
Week-long investigations became 5-minute Slack conversations
Critical issues caught before customer impact
tastytrade is an options, futures, and stock trading brokerage built by traders. Their platform is available on iOS, Android, and web.
Financial services / brokerage
Observability, Distributed Tracing, OpenTelemetry, Infrastructure Migration, BubbleUp

By: Rox Williams
The stakes
tastytrade is a brokerage. Every morning when the market opens, the platform absorbs a three to five times surge in traffic within seconds. That ‘thundering herd effect’ is the daily norm, and it’s when things go wrong. A slow order, a dropped connection, a missed execution window: the costs are immediate and real.
The company runs its own data centers and fiber infrastructure, with facilities in Chicago and New York. When something needs to change, there’s no cloud provider to lean on. Brian Chamberlain, Staff Software Engineer at tastytrade, put it plainly at Honeycomb’s O11yDay NYC: “If there’s any latency or downtime, it can get expensive very fast.”
Why they moved their data center
Essentially, the old data center ran out of space. Space and power were maxed out, and tastytrade needed to grow. They found a new facility in Aurora, Illinois, just outside Chicago, at a third of the cost and twice the space.
While they were at it, they modernized everything below the application layer. Chef, VMs, and bash scripts gave way to a container-based system running Nomad on bare metal. The applications didn’t change; they all talk through an API, so from the platform’s perspective, the data center migration was invisible. The overhaul happened entirely at the infrastructure layer.
The plan: keep the old data center running, stand up the new one in parallel, and gradually move production traffic from one to the other while watching every metric, trace, and log along the way.
What they needed from observability
Running two data centers simultaneously meant two streams of telemetry for every service. tastytrade needed to tag telemetry by data center (Chicago vs. Aurora) and then slice, filter, and compare them side by side across the full stack. Without that, distinguishing a real regression from normal variance would have been guesswork.
They used Honeycomb alongside Grafana and Elasticsearch. For the specific work of comparison and investigation during the migration, Honeycomb was the tool that let them ask questions the others couldn’t answer. “With Honeycomb, it’s like an electron microscope. We could actually see the latency between the two data centers in milliseconds and say, okay, we shifted the right way,” said Brian.
The monsters in the gaps
Every migration hits surprises. Brian called his “monsters,” and he found five of them. Each pointed to a blind spot their observability helped them catch, diagnose, or close.
The database that had to go for a drive. After a weekend database promotion to Aurora, Honeycomb’s heatmaps showed latency moving in the right direction. Then, the market opened on Monday. Heatmaps that normally showed tight, consistent query performance went fuzzy: outliers spreading in a pattern that said “something is wrong, but not everything.” The fix was physical—they put the old database in a car and drove it to the new data center overnight.
Identical hardware that wasn’t identical. New Aurora hardware, same model and firmware across the board. The infrastructure team was confident. The telemetry disagreed. Once Brian added hardware identifiers to the telemetry, one box stood out. They pulled it, found a ‘performance mode’ setting that wasn’t enabled by default. Even on a $20,000 server, turbo mode doesn’t come on out of the box.
A DNS truncation problem hiding in plain sight. When tastytrade cut 100% of traffic over to the new data center, nginx started returning 502s (gateway timeout error). UDP queries to DNS have a byte limit; with enough containers registered, the list was getting truncated. One flag in the nginx config, one routing change to Consul, problem eliminated.
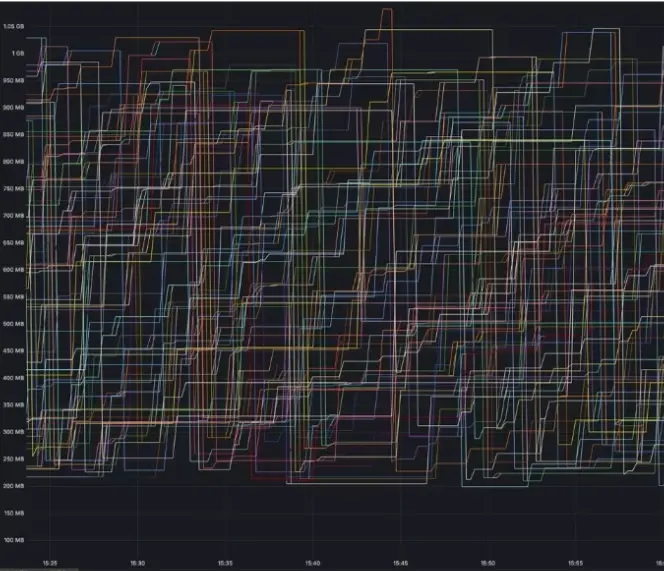
A memory chart that looked like abstract art. A critical Ruby service showed every web worker spiking, dying, and respawning hundreds of times per minute. BubbleUp surfaced the answer in seconds: a Java team had changed an API version header. What would have been a week-long investigation became a five-minute Slack conversation.
The telemetry that was the problem. The auth service fell over at a certain request rate with a calm CPU and no obvious cause. Stack trace analysis found Raindrops, a Ruby saturation library. On bare metal with hundreds of Docker containers, every container was hammering the same Linux kernel interface simultaneously. Removing Raindrops fixed it.
The bigger pattern
Across all five issues or “monsters”, the blind spots came down to missing context. Adding that context didn’t require a major overhaul; it required thinking about what fields would matter when things went wrong before they went wrong. “If you can identify a way to tag it and filter and compare, that’s all you need to do,” said Brian.
The second pattern: look at telemetry continuously, not just during incidents. One issue went undetected until someone happened to look at traces while investigating something else. The telemetry was there; nobody had checked it after the bad deploy.
tastytrade also used Claude to bridge gaps between observability systems. Where Honeycomb, Grafana, and Prometheus each held different slices of data, Brian used Claude to write Python scripts that pulled from all three, normalized the output, and generated comparison reports across market open windows.
Where they landed
tastytrade powered down the old data center in February 2026. Every service is instrumented with OpenTelemetry, tagged with hardware and data center metadata, and visible in Honeycomb across the full trace from request to database call.
Everything they built for the migration—the tagging strategy, the comparison workflows, the cross-team context enrichment—is now how tastytrade operates. Any technical change gets the same treatment: tag, filter, compare.
The monsters are still out there. The difference is that now tastytrade can see them coming.
With Honeycomb, it’s like an electron microscope. We could actually see the latency between the two data centers in milliseconds and say, okay, we shifted the right way.
Brian Chamberlain
Staff Software Engineer
Advice from Brian Chamberlain, Staff Software Engineer
- Tag everything you can. Hardware identifiers, data center labels, service names, API versions—any context you add to telemetry pays off in ways you can’t predict. The field that saves you is usually the one someone almost didn’t bother with.
- Look at telemetry after every deploy, not just when things break. The fastest way to catch a problem is right after it’s introduced, while you still know exactly what changed.
- Rich data beats pretty dashboards. Aggregates can tell you something is wrong, but they can’t tell you why. High-cardinality data is what lets you ask the question you didn’t know you needed to ask.
- Make observability a team sport. The BubbleUp diagnosis that saved a week only worked because a different team had enriched their telemetry. Context from one team can unlock an investigation in another.
Want to learn more?
Talk to our team about how we're helping organizations build the operational foundation for AI development success.