
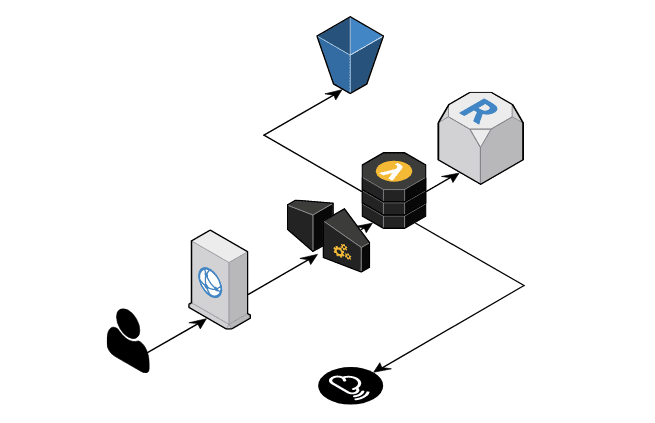
Nic Wise at Tend Health recently wrote a series of blog posts exploring how they moved away from logs and metrics, toward adopting observability with Honeycomb. In that series, he shares lessons learned as they got their NodeJS app instrumented in an AWS environment making use of CloudFront, API Gateway, Lambda, and a few other services.
Tend is a New Zealand-based healthcare platform launching in 2020. With the opportunity of a near-greenfield project to work with, Nic shared his experiences learning Honeycomb that you might find useful.
Getting started
Nic used the Node Beeline integration and set up some middleware to get data into Honeycomb from dev, but encountered some snags with his lambda code waiting on API calls to Honeycomb’s ingest service. In order to solve that, he needed to better understand Honeycomb’s data model. He very clearly phrases his take on using events:
You can almost think of an event as a log line – something happened and I want to know about it – but it’s also a data structure, so you can add any other context you want to it.
Once Nic updated his mental model of working with structured events, “around 90% of the metrics [he’d previously] created had no purpose anymore.” He changed his existing log lines and metrics to dump that data into the Beeline’s spans as context, deleting a bunch of code in the process.
Working with traces and AWS Lambda
Nic also encountered some missing spans because of how his codebase was using `async`/`await`:
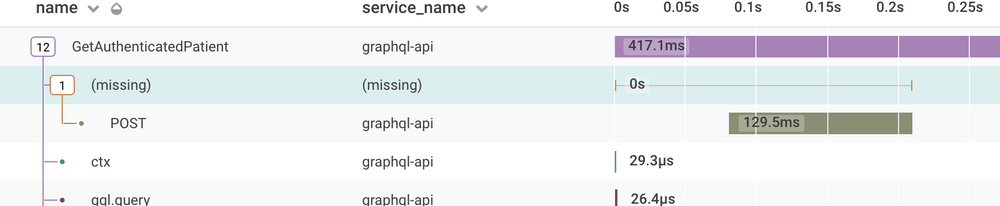
It can be tricky to debug missing parts of a trace, but I can promise when you solve it you’ll have learned that part of the code like the back of your hand.
That’s the thing about instrumentation and observability tooling: the point isn’t for the tools to think for you, it’s to help you better reason about your code and your systems. Auto-instrumentation is great for getting started but the most important parts of your code are unique to your app because they’re unique to your business. That means you’ll benefit the most from some adding custom instrumentation on top of auto-instrumentation, and it’s why Honeycomb makes the most sense as a developer tool.
Nic got advice from Honeycomb’s Pollinators community Slack on how to fix the issue with Lambda blocking on API calls. This involved dropping down into `Libhoney`, the event handler library used by the Beeline SDK, and redirecting his events to emit to stdout. From there, Cloudwatch Logs and Honeycomb’s agent Lambda integration send his data along to Honeycomb asynchronously.
Once he got that working, Nic encountered a scenario where he was seeing separate traces for an asynchronous call to the Twilio API, which he wanted to combine into a single trace alongside the caller. By updating his code to pass along the trace ID and parent span ID, he was able to combine them:
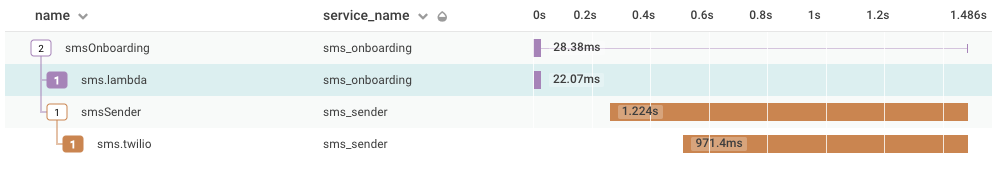
Nic’s scenario is common among teams using Lambda, but his post clearly explores that with a straightforward example.
Read Nic’s entire series plus his follow-up post to get the full story along with code samples:
- Honeycomb 1 – The Beginning
- Honeycomb 2 – What are all these new terms?
- Honeycomb 3 – Breaking the API dependency
- Propagating the Honeycomb context between Lambda calls
Learn more about how metrics work in Honeycomb and how you can eliminate the majority of them by using structured events: download Getting Started with Honeycomb Metrics.