Discord Bot Part 2: More Observability
This guest blog post from Chris Gardner is part two of his series on using Honeycomb while developing his Discord bot. It was originally posted on his personal blog. I’ve recently started working on…

By: Guest Blogger

This guest blog post from Chris Gardner is part two of his series on using Honeycomb while developing his Discord bot. It was originally posted on his personal blog.
I’ve recently started working on a new project to build a Discord bot in Go, mostly as a way to learn more Go but also so I can use it to manage various things in Azure and potentially elsewhere. I figured it’d be useful to document some of this project to give some insights as to what I’ve done and why. Next up is the bot itself and how I integrated it into Honeycomb to get some visibility on how different commands are running.
In the 4 months or so since the last post, I’ve made some good progress on the bot itself. I have a variety of commands set up (some of them even useful ones) and have it linked to a few servers I’m on with various folks. But a big problem with bots is that it’s not clear what’s going on when people are using them; it’s running in a container in Azure so I could log out to stdout and go trawling through the logs if someone tells me there’s a problem with it—but that’ll only give me part of the information I need (and only if I decided to log it) and it doesn’t cover all the non-problem times where I might be curious about what people are using the bot for or how long things take, etc. So what’s the solution to this problem?
Observability
A lot has been said about observability, so if you’re interested, then read up on it, but the core concept is (or should be): “Observability is a measure of how well internal states of a system can be inferred from knowledge of its external outputs.” But why does this matter for a simple Discord bot? Because it’s with observability tools like Honeycomb and Lightstep that we can take all the telemetry that my bot (or any other system) is outputting and answer all the weird and wonderful questions we might have about it, both now and in future, hopefully without needing to ship new code to do so.
If I want to see which commands are taking the longest, then that’s easy enough to do as all my commands output their duration as part of the telemetry they send. If I want to find which users are sending the most commands, then that’s also easy enough. If I was doing this with a traditional logging tool, then I’d have to hope I was logging these fields out in a way that’s searchable by the tool—that’s possible in many of the common scenarios like number of commands per user, but duration per command might be more difficult if you’re not actively tracking it and instead need to rely on the built-in timestamping of the tool and some maths (which the tool might or might not support). This logging approach can break down as soon as you’re logging multiple logs per command and not linking them together in some way (a unique ID of some sort).
How to make the bot observable?
Now that we know why we want to make use of observability tools, the big question becomes how do we do that? Since I’m integrating with Honeycomb as my observability tool of choice, I decided to have a look at their Beelines, which support quite a few languages and are all open source. These provide a great starting point for auto-instrumentation and give you a lot of value out of the box for very little effort, providing an easy way to get your data into Honeycomb and add a whole bunch of common fields to the events they send. The downside for this project, however, is that these all focus on web APIs and similar request/response systems, but since the bot is using websockets, this isn’t directly supported, though the flow of data is similar. So I wrote my own library for it wrapping some of the functionality in Libhoney and the Go Beeline.
I took a lot of inspiration from what the Beeline does for normal HTTP requests and started with just creating a trace for each message coming in, as that is the closest approximation of an HTTP request we have in the bot. Should I decide to expand the bot to handle other triggers, like reactions being added to messages or users joining a server, then I may need to revisit this, but it gives me a good starting point. As part of this initial trace creation I also add in a bunch of fields that might be useful in future, such as the author username, server ID, and more. As it’s building on top of the Honeycomb trace library, I also get a few things from that too, such as duration, and can make use of the existing methods for creating new spans and adding fields so I don’t have to reimplement that myself.
From here, I just pass around the context instance I’ve created for the message and it’ll ensure that any future spans are added to this trace and any fields I add are all included, either on the span or the top-level trace (there’s still a bug to work out there). This means I can use it for things like checking for feature flags, where I’ll wrap the process of calling out to Optimizely for which feature flags a user has enabled. Now I can see how long this takes, who has what flags enabled, and query based on that information, too. Since I’m using feature flagging as both a way to hide new commands from users while I test them and as a way to do permissions without needing to be a server admin, this gives me some useful flexibility in how I track their usage.
What does this look like?
Seeing the code for how I’ve implemented this is all well and good, but what does this actually give me in practice?
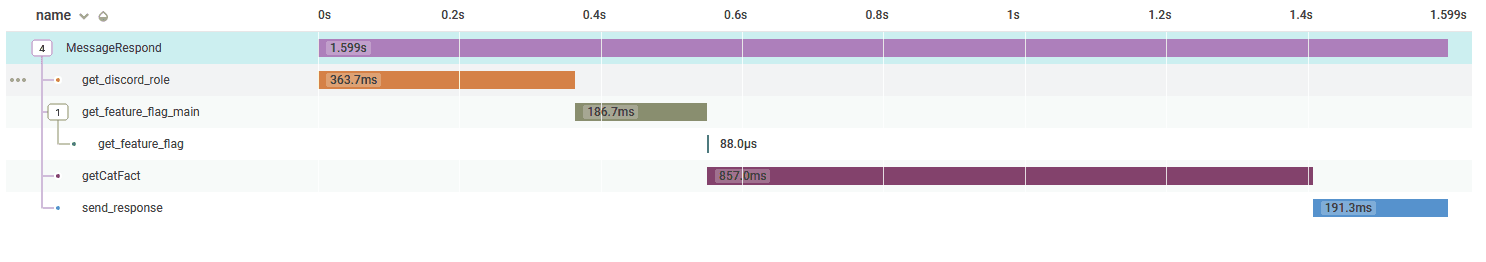
On a per-command basis, we get some nice traces showing how long each step of the command processing took, with the bulk being in the getCatFact span (my naming could be standardized a bit) but since it’s calling an external API that seems reasonable.
We can look at a more general overview of all the requests with that command type and display them as a heatmap and also a line graph showing P95 duration:
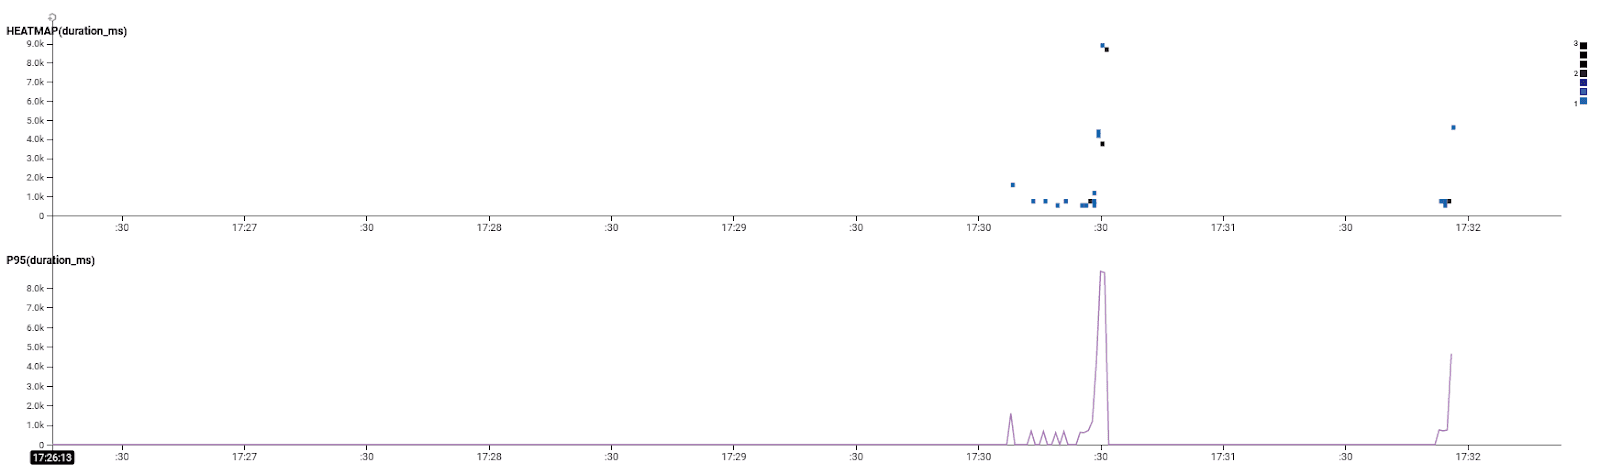
And this shows that the majority of requests were completing in under 5s but a few were around the 8s mark. If we dig into one of those traces (by simply clicking on the little box for it or finding one in the trace view below the graph), we can see the following:
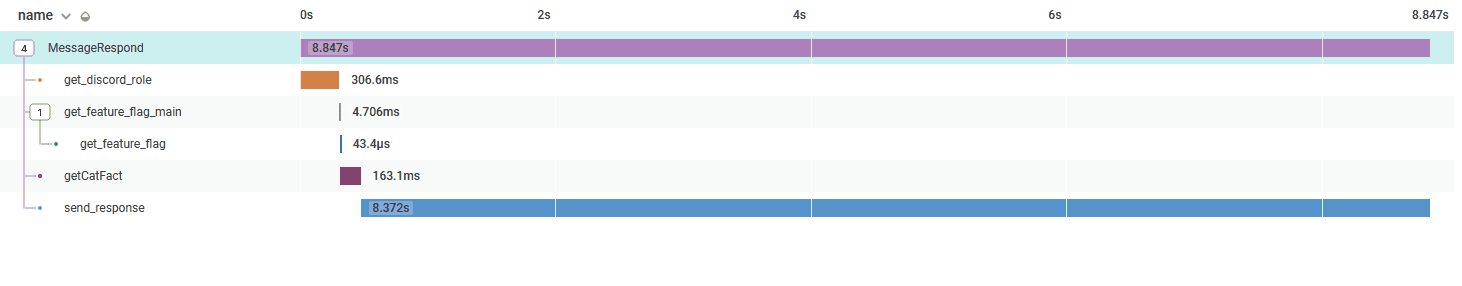
Which reveals that it’s not the external API call that’s being slow (that’s faster than the earlier trace) but the response to Discord that is slow. I know in this case I was sending quite a few of these commands to the bot so perhaps there was some rate limiting happening from Discord. Sadly, I don’t have any instrumentation into the Discord library I’m using so I can’t track that as easily. All of this was possible because I’ve got a field in each of these traces that records which command has been run. I can also look at the different spans and see what other fields I have there (and query on all of them), such as these on the send_response span:
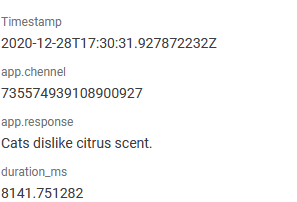
So I can see what was actually sent back by the bot—in this case a random cat fact—and this comes in very handy when debugging new commands. If you’re not getting anything back in Discord after issuing a command, you can go look up the trace in Honeycomb and see what could be going on. If the app.response field is empty, then Discord will drop the message and you can start looking up the trace to see if anything pops up. I also ensure any errors that are returned by any of the commands are added to the root trace so that it’s easy to find them when something obvious goes wrong.
We can also zoom way out and see things beyond just a single command:
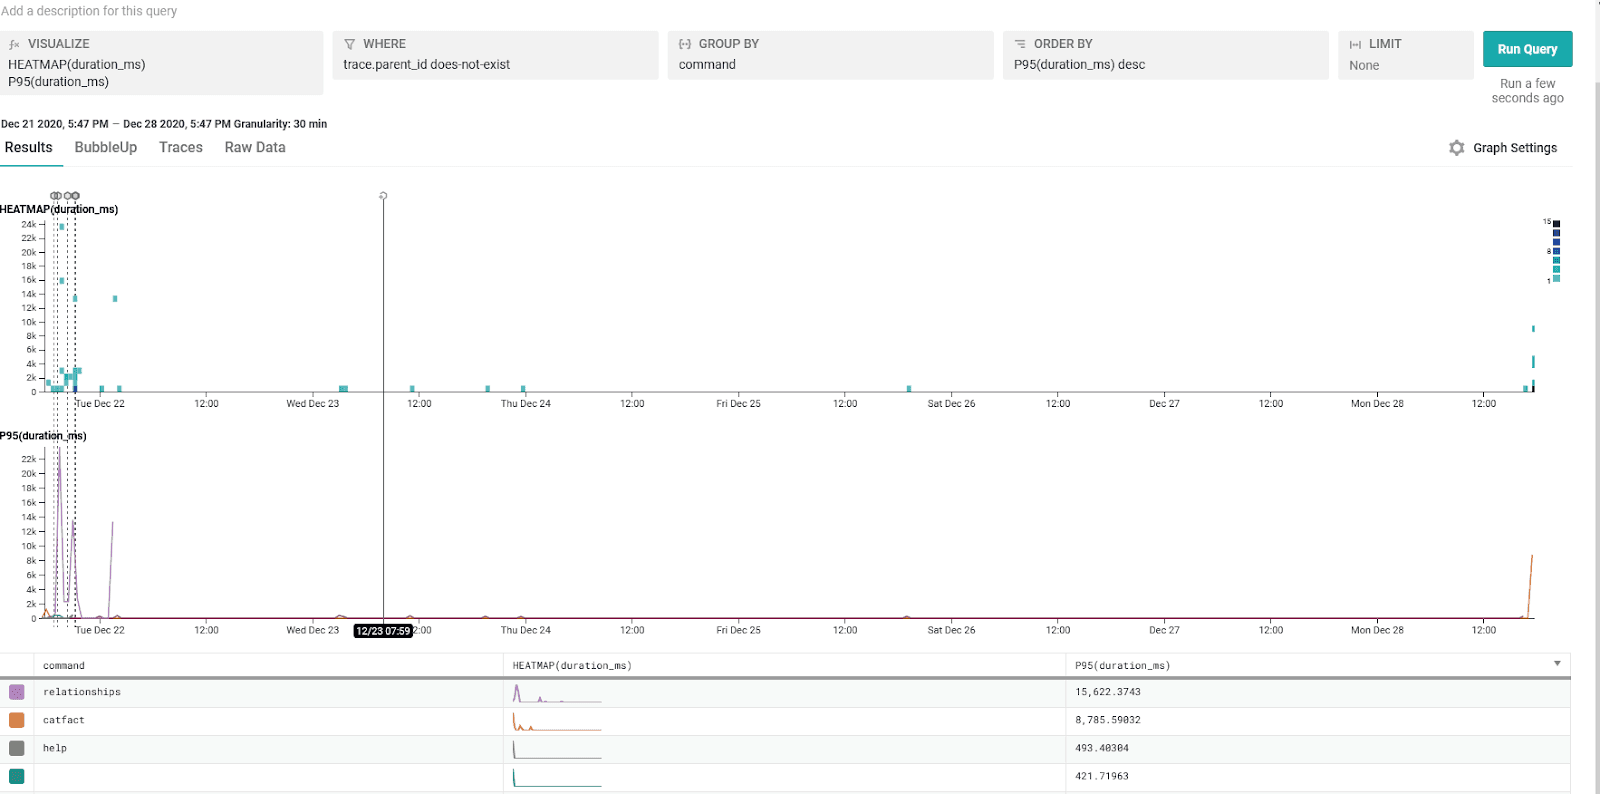
From here we can see all the requests in the last 7 days both as a heatmap and P95 duration, grouping by command. This can give a really quick overview of which commands are the slowest and you can spot any obvious outliers on the heatmap. The dotted lines are deployment markers, so whenever my CD pipeline runs, it’ll update Honeycomb with a timestamp and version number so if things start to look different (in an unexpected way) after that marker then it’s a good sign something in that release needs investigating further. Seeing the slowest commands there, we can decide if anything needs investigating, too—the relationships command in this case appears to be pretty slow at about 15s for it’s P95 duration but I know it’s running in Azure Functions so the slowness there is in cold start time.
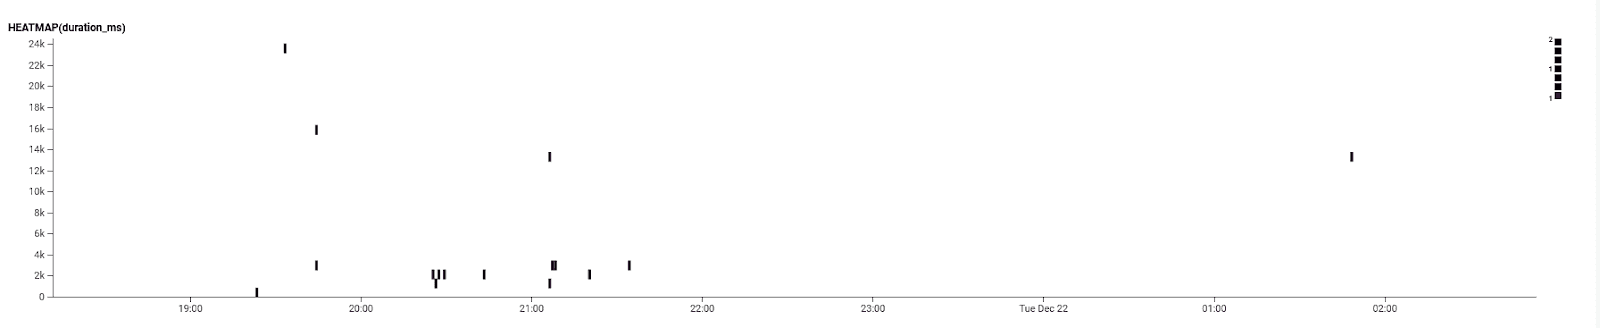
Digging further into the data for that command, we can see this heatmap around a busy time. We can see there are a few outliers in the 10s+ range but many of them close together are under 4s, which also points towards cold start for Azure Functions being the issue. It’s out of our control but now we’re aware of it and have the data to prove that it’s not the bot being slow due to something it is doing.
What next?
The bulk of the work for getting the bot up and running is now complete, and I’ve got a pretty solid release pipeline for getting it deployed (with observability into it, too). Next up is fleshing out the tests for the bot, an area I haven’t done a lot with in Go and only one command has any testing (though the others are pretty basic commands so might not need much). After that there’s a few improvements I’d like to make, primarily around the feature flag area, but I need more investigation into how Go would do singletons or something similar to get further with that. Beyond that I’m not sure where else to go other than adding new commands to the bot as I think of them (or they are suggested by servers the bot is on). I’ll probably write a blog post about the next one I add or might document the !mtg command I added for generating Scryfall searches to make Commander/EDH deck building a bit easier.
Curious to learn more about how Honeycomb can help you with observability? Check out our open-source Beelines or sign up for free!
Want to know more?
Talk to our team to arrange a custom demo or for help finding the right plan.