HoneyByte: Test Out Refinery Yourself!
This HoneyByte walks through how to get Refinery running locally to try out different configuration options and sampling methods.

By: Shelby Spees
Last week, we announced that Refinery, our platform-agnostic sampling solution, is generally available. But it’s always better to see it for yourself. Follow the steps in this HoneyByte to see how Refinery works by running it locally.
As a reminder: Honeycomb doesn’t sample your data and you don’t need to sample to use Honeycomb. But if you want to sample your data, Honeycomb’s backend can support data that’s been sampled by using it to reconstruct the overall shape of your traffic with statistical accuracy. Refinery makes it easy to sample telemetry effectively and on your terms so that you don’t have to waste a ton of money on data you don’t need. If you’d like to read more, my teammate Liz recently wrote a post about the why of sampling.
Running Refinery locally
This HoneyByte walks you through running Refinery locally with Docker and configuring your application to send data to Honeycomb by first running it through Refinery. We’ll look at how to validate basic sampling approaches with dry runs and how to measure your sampling impact with Honeycomb’s Usage Center. We’ll end with a look at a few different sampling methods and when you might use them. As a new user of Refinery, you should be able to match the intent of your sampling rules with the impact you see in Usage Mode.
Requirements
To follow the steps in this HoneyByte, you’ll need afree Honeycomb account and the ability to run Docker in your local environment. We’ll be running a Fibonacci example app—a simple app used to generate trace data using OpenTelemetry.
Note: Refinery support is included with Honeycomb’s Enterprise tier. If you’re already working with our Customer Success team or Sales team, be sure to contact them for help setting up Refinery and defining rules based on your organization’s needs.
Clone and run the application
Clone the repository and checkout the refinery branch:
git clone git@github.com:shelbyspees/opentelemetry-python-example.git fibonacci
cd fibonacci
git checkout refineryNormally, you would configure OpenTelemetry to send data directly to api.honeycomb.io, Honeycomb’s event ingest API. Instead, to use Refinery, you need to update the API host parameter in your application’s Honeycomb configuration to point to your Refinery instance. When Refinery receives your data, it makes sampling decisions and sends those samples to Honeycomb using the appropriate API key and dataset name.
This example app is set up to use the environment variable HONEYCOMB_API_HOST. Run the application using Docker compose, passing in your API key and Refinery’s endpoint for the API host (in this case, port 8080 on the refinery service):
HONEYCOMB_API_KEY=abc123 HONEYCOMB_API_HOST=http://refinery:8080 docker-compose upYou should see output from both Refinery and the Flask app:
. . .
refinery_1  | time="2021-03-09T03:00:43Z" level=info msg="Listening on 0.0.0.0:8080" router_iop=incoming
refinery_1  | time="2021-03-09T03:00:43Z" level=info msg="Listening on 0.0.0.0:8081" router_iop=peer
app_1       |  * Serving Flask app "server" (lazy loading)
app_1       |  * Environment: production
app_1       |    WARNING: This is a development server. Do not use it in a production deployment.
app_1       |    Use a production WSGI server instead.
app_1       |  * Debug mode: on
app_1       |  * Running on http://0.0.0.0:5000/ (Press CTRL+C to quit)
app_1       |  * Restarting with stat
app_1       |  * Debugger is active!
app_1       |  * Debugger PIN: 844-753-887
Now you can curl the app (or navigate to it in your browser) to make sure it’s running:
$ curl localhost:5000
Visit http://localhost:5000/fib?i=1Hit the /fib API endpoint with a parameter (you may need to wrap the URL in quotes in some terminals):
$ curl localhost:5000/fib?i=1
0The sample app just generated trace data you can see. Go to your new fibonacci dataset in the Honeycomb UI and look for recent traces. For a nice meaty trace, try giving i a larger value like 10. Be careful of exponential growth with these input values!
$ curl localhost:5000/fib?i=10
34Okay, with that basic app working, let’s configure sampling.
Configure sampling rules
All sampling approaches with Refinery are trace-aware, which everything should just work. (If you remember last year’s HoneyByte on sampling with Beelines, none of those common pitfalls apply to using Refinery.)
Deterministic sampling is the simplest form of sampling that just keeps 1 out of every N requests with no other qualification parameters. Deterministic sampling is the same sampling method available in Honeycomb’s Beelines. It’s the simplest and broadest form of sampling because it applies a single sample rate to all of your traffic. The main difference when using it with Refinery is that rather than setting that up in every single service you manage, you can do it from a central location.
To use deterministic sampling, make these changes to your rules.toml configuration file:
# refinery/rules.toml
Sampler = "DeterministicSampler"
SampleRate = 5 # send 1 in every 5 tracesValidating with DryRun mode
For teams already sending production traffic to Honeycomb, you will probably want to test your sampling rules without the risk of accidentally dropping events you care about. Refinery offers DryRun mode as a way to safely validate the rules you’ve just configured.
DryRun mode sends all of your traffic to Honeycomb, but it also marks events that would have been kept or dropped based on your Refinery rules. Honeycomb queries then show you which events would have been dropped. DryRun mode allows you to make sure your configured rules actually deliver against your sampling goals, both in terms of overall volume and for decisions around individual events.
To use DryRun mode, you must set the mode to true in your Refinery rules.toml configuration file.
# refinery/rules.toml
Sampler = "DeterministicSampler"
SampleRate = 5  # send 1 in every 5 traces
DryRun = true
Hit the /fib endpoint a few more times with some small values for i and look for the log output below in the Refinery console:
refinery_1 | time="2021-03-09T04:15:46Z" level=info msg="Trace would have been dropped, but dry run mode is enabled" dataset=fibonacci trace_id=10975145a077324e3a40c68e2b891409Now in the Honeycomb UI, GROUP BY refinery_kept run your query again. Go to the Results tab to see which traces would have been kept or not.
See the impact on ingest volume with Usage Mode
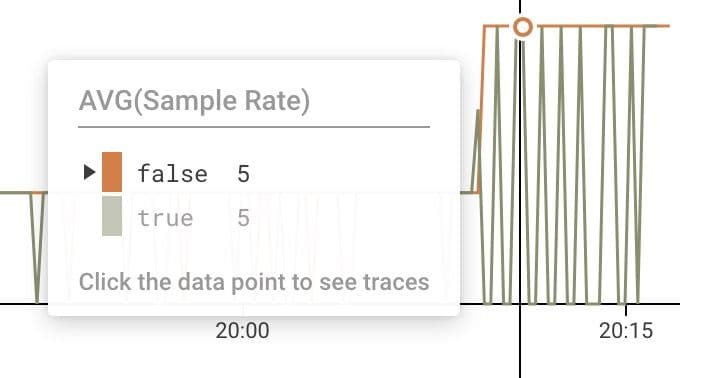
When an event is sampled by Refinery, a Sample Rate field gets appended to that event. The Sample Rate field tells us how many other similar events are represented by the one event sent to Honeycomb (SampleRate = 5, in our example).
Honeycomb uses those sample rates when returning query results such as COUNT, AVG, etc., to calculate representations for the unsampled events. In other words, just by looking at the charts generated by the UI, you wouldn’t be able to notice much of a change in your data once sampling is turned on.
So how can you tell whether Refinery is actually sampling your data? Usage Mode in the Honeycomb UI will show you the sample rate attached to events.
To enter Usage Mode, go to your Team Settings by selecting your user account in the left-hand sidebar, and then selecting Team Settings in the pop-up menu.
On the Team Settings page, select the Usage tab, and then scroll down to the Per-dataset Breakdown section. Then select the Usage Mode button for the dataset where you’re sending your application traffic.
(Note: A shortcut for entering Usage Mode is to insert /usage/ after your dataset name in the URL. It should look like this: https://ui.honeycomb.io/{yourteam}/datasets/fibonacci/usage/.)
This will take you to the query builder for that dataset. Select the suggested query: Average and spread of sample rates over the past two hours.
This suggested query gives us a couple different graphs to analyze:
- HEATMAP(Sample Rate)
- AVG(Sample Rate)
- COUNT (unweighted)
You can also use Usage Mode combined with the DryRun option to see what the sample rates would be if they were being sampled.
Add refinery_kept back into the GROUP BY field to see the breakdown.
Once you’ve verified your sampling rules, you can remove the DryRun = true line and watch your event volume drop in Usage Mode.
More sampling rules
Refinery comes with a handyrules_complete.toml file that explains all the configuration options and gives examples. Let’s explore a few sampling methods that Refinery offers.
Rules-based sampling
Tail-based sampling means that a sampling decision is made after every single span of a trace has been collected (or, at its “tail”). A good place to start when you’re new to tail-based sampling is using rules-based sampling. This method allows you to specify a sample rate based on the particular value of a field within your events.
For example, rules-based sampling enables you to sample more of your uninteresting traffic (like HTTP 200s) and keep all of your interesting traffic (like any 5xx errors).
For the uninteresting (or successful) traffic, you can configure the rules-based sampler to send 1 in every 1000 of your HTTP 200 responses. Since the HTTP 200s for this sample app are all nearly identical, the 1 representative event that gets sent to Honeycomb will stand in for its 999 dropped counterparts. We don’t get much from keeping the other 999 events. A sample rate of 1000 is a reasonable place to start when sampling uninteresting traffic on high-volume services, but your mileage may vary.
# refinery/rules.toml
Sampler = "RulesBasedSampler"

[[rule]]
  name = "500 errors"
  SampleRate = 1 # send 1 in 1 (100%) of these traces
  [[rule.condition]]
    field = "http.status_code"
    operator = ">="
    value = 500

[[rule]]
  name = "downsample 200 responses"
  SampleRate = 1000 # send 1 in 1000 of these traces
  [[rule.condition]]
    field = "http.status_code"
    operator = "="
    value = 200

[[rule]]
  SampleRate = 50 # send 1 in 50 of all other traces
Exponential moving average
Rules-based sampling is a good place to start, but what happens if traffic patterns suddenly shift? Maybe keeping 1 out of 1000 successful events makes sense when you’re receiving tens of thousands of successful events every few seconds. But it may not make as much sense if traffic drops off in the middle of the night and you’re only receiving dozens.
Like rules-based sampling, the EMADynamicSampler allows you to set a target sample rate and specific fields as keys for sampling. But unlike rules-based sampling, the exponential moving average implementation does a little bit of math to adjust sampling rates dynamically based on how frequently the values in your designated fields have appeared over a recent time period. That dynamically adjusting sample rate helps avoid problems arising from spiky changes in event volume when you have a burst of traffic or a sudden scale-up event, which is a downside of other basic dynamic sampling methods.
If you’re unsure which to use, EMA Dynamic is the recommended sampling method for most teams using Refinery.
# refinery/rules.toml
[my-dataset]
  Sampler = "EMADynamicSampler"
  GoalSampleRate = 10
  FieldList = ["http.method","http.status_code"]
  AdjustmentInterval = 15
Weight = 0.5In this example, we’ve configured the sampler to use the http.method and http.status_code fields for making decisions. Based on the values of those fields, the sampler will adjust how many similar events it drops. So for each combination of values of http.method and http.status_code, the sampler will keep track of how many events have those values:
- GET and 200
- GET and 500
- POST and 200
- POST and 500
- etc.
Based on our configuration, Refinery will aim to send 1 in every 10 traces with that combination of values. Both http.method and http.status_code act as a combined key for sampling decisions.
To better understand how sampling decisions are made, you can configure Refinery to add a field to your events that track which fields (the combined key) the sampler uses to make its decision for that trace:
# . . .(continued from above)
# Keep track of what key the sampler is using to make decisions
AddSampleRateKeyToTrace = true
AddSampleRateKeyToTraceField = "meta.refinery.dynsampler_key"This is a basic introduction to the sampling strategies that can help you better understand what Refinery does, how it makes decisions, and how you can verify that the rules you set up have the effect you intend. For more about using Refinery, be sure to check out our docs.
Sampling that puts you in control
In this Honeybyte, you’ve sent application data through Refinery, verified your configuration using DryRun mode, seen the impact that sampling has had on your event traffic with Usage Mode, and learned a little about the most common ways that Refinery makes sampling decisions. Now you’re ready to start applying these techniques to manage your own telemetry data.
You can try Refinery on your enterprise production workloads, fully backed by Honeycomb support for all your configuration needs, by signing up for a free 30-day Enterprise account trial today.
Want to know more?
Talk to our team to arrange a custom demo or for help finding the right plan.