Getting started with observability can be time consuming. It takes time to configure your apps and practice to change the way you approach troubleshooting. So it can be hard to prioritize investing time, especially if you can’t clearly see how that investment will pay off.
That’s why we put together Honeycomb Developer Week: short, snackable, time-efficient learning sessions to jumpstart your observability journey. From hands-on workshops, to feature breakdowns, to workflow integrations, Honeycomb Developer Week helps you quickly uplevel your ability to locate any application performance issue—no matter how complex, hidden, or hard to find.
If you’d like to quickly sharpen your observability chops, then this recap of Honeycomb Developer Week is for you.
Observability 101 Workshop
For those just getting started with observability, this beginner workshop covered both the theory and practice of observability. Attendees had the opportunity to learn via plenty of hands-on exercises, from sending trace data to Honeycomb using OpenTelemetry, to identifying performance issues using Honeycomb features.
Missed signing up for this workshop and experiencing FOMO? No worries, we’ve got you—registration is now open for the next Observability 101 Workshop on January 26 at 11 a.m. PT. Sign up now to save your spot!
Instrumenting With OpenTelemetry
As Michael Sickles explains in his session, the vendor-neutral, open-source OpenTelemetry (OTel) framework can help you easily get started via their SDKs or the JVM Agent to send telemetry directly to Honeycomb. As opposed to using proprietary libraries or agents, using OTel means you can instrument your applications just once and send telemetry data to any vendor of your choice!
Michael also covers the benefits of the automatic instrumentation included with OTel, how it helps you sample your data (if necessary), and how to use it to set up tracing across multiple services. All in under 10 minutes. His full session is now available on demand. Or, if you’re ready to learn more, check out our OpenTelemetry docs.
Distributed Tracing in Honeycomb
Ever wonder what’s causing latency in one of your services, but don’t have a way of seeing the whole story? Brian Langbecker has an answer for you in his session covering distributed tracing and how it works in Honeycomb.
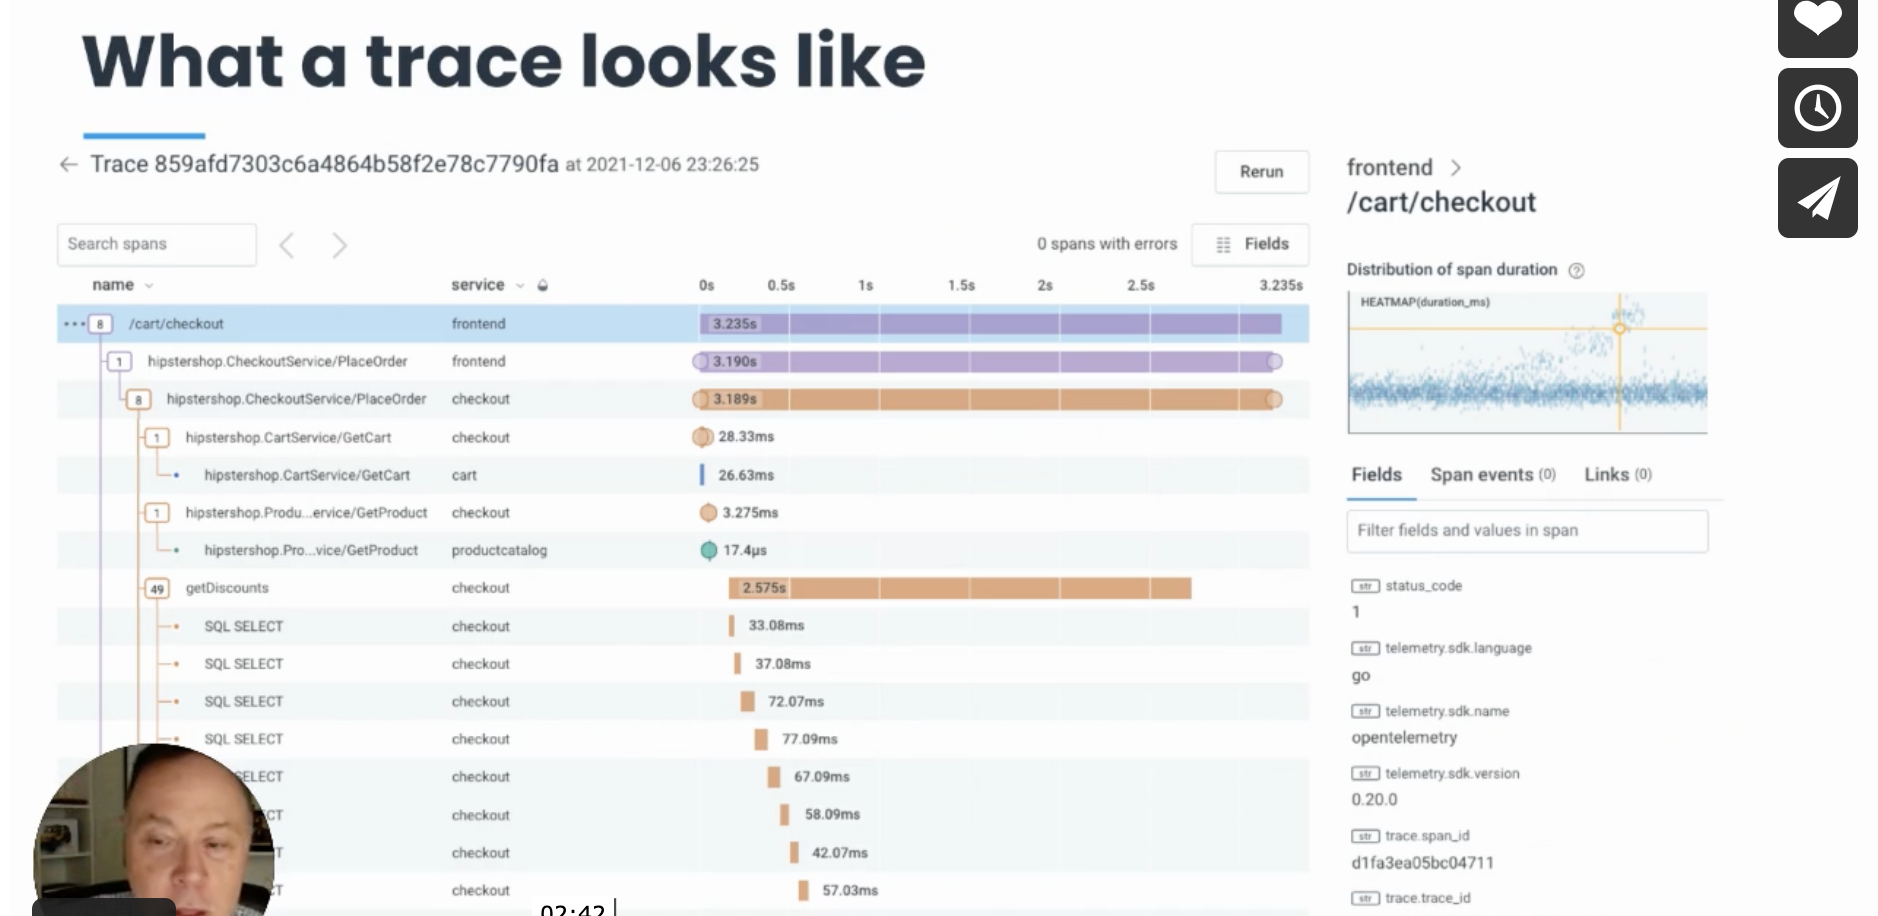
Distributed tracing can be an incredibly useful debugging tool. But typically, it’s detached from the rest of your debugging workflow, and it’s up to you to connect the dots between production issues and the relevant trace data needed to help you locate issues. By seamlessly integrating tracing into Honeycomb, you can find the right data you need, exactly when you need it.
In his session, Brian gets you quickly oriented by defining terminology used in distributed tracing, showing how heatmaps work in Honeycomb, and how using them together helps you clearly see what’s happening inside any application service, no matter how complex or distributed.
Check out his full session for a complete walkthrough of a trace or download “Distributed Tracing: A Guide for Microservices and More” for more details on what traces are and what they contain.
Finding Outliers With BubbleUp
Debugging issues in production can be an exercise in frustration, especially when you don’t even know where to start looking for problems. Production systems have many moving parts and even simple transactions pull data from multiple sources, making it difficult to determine where underlying issues are happening when mysterious “slowness” is reported.
How do you find those pesky outliers (or anomalies) that are wreaking havoc, causing spikes in error rates and latency? Adam Hicks shows you how to quickly bring statistical outliers in your event data to the forefront using Honeycomb’s BubbleUp feature. BubbleUp automatically combs through billions of rows of data, comparing results across thousands of highly unique fields, to surface commonalities in relevant outliers within seconds. It dramatically speeds up your debugging efforts and reduces downtime.
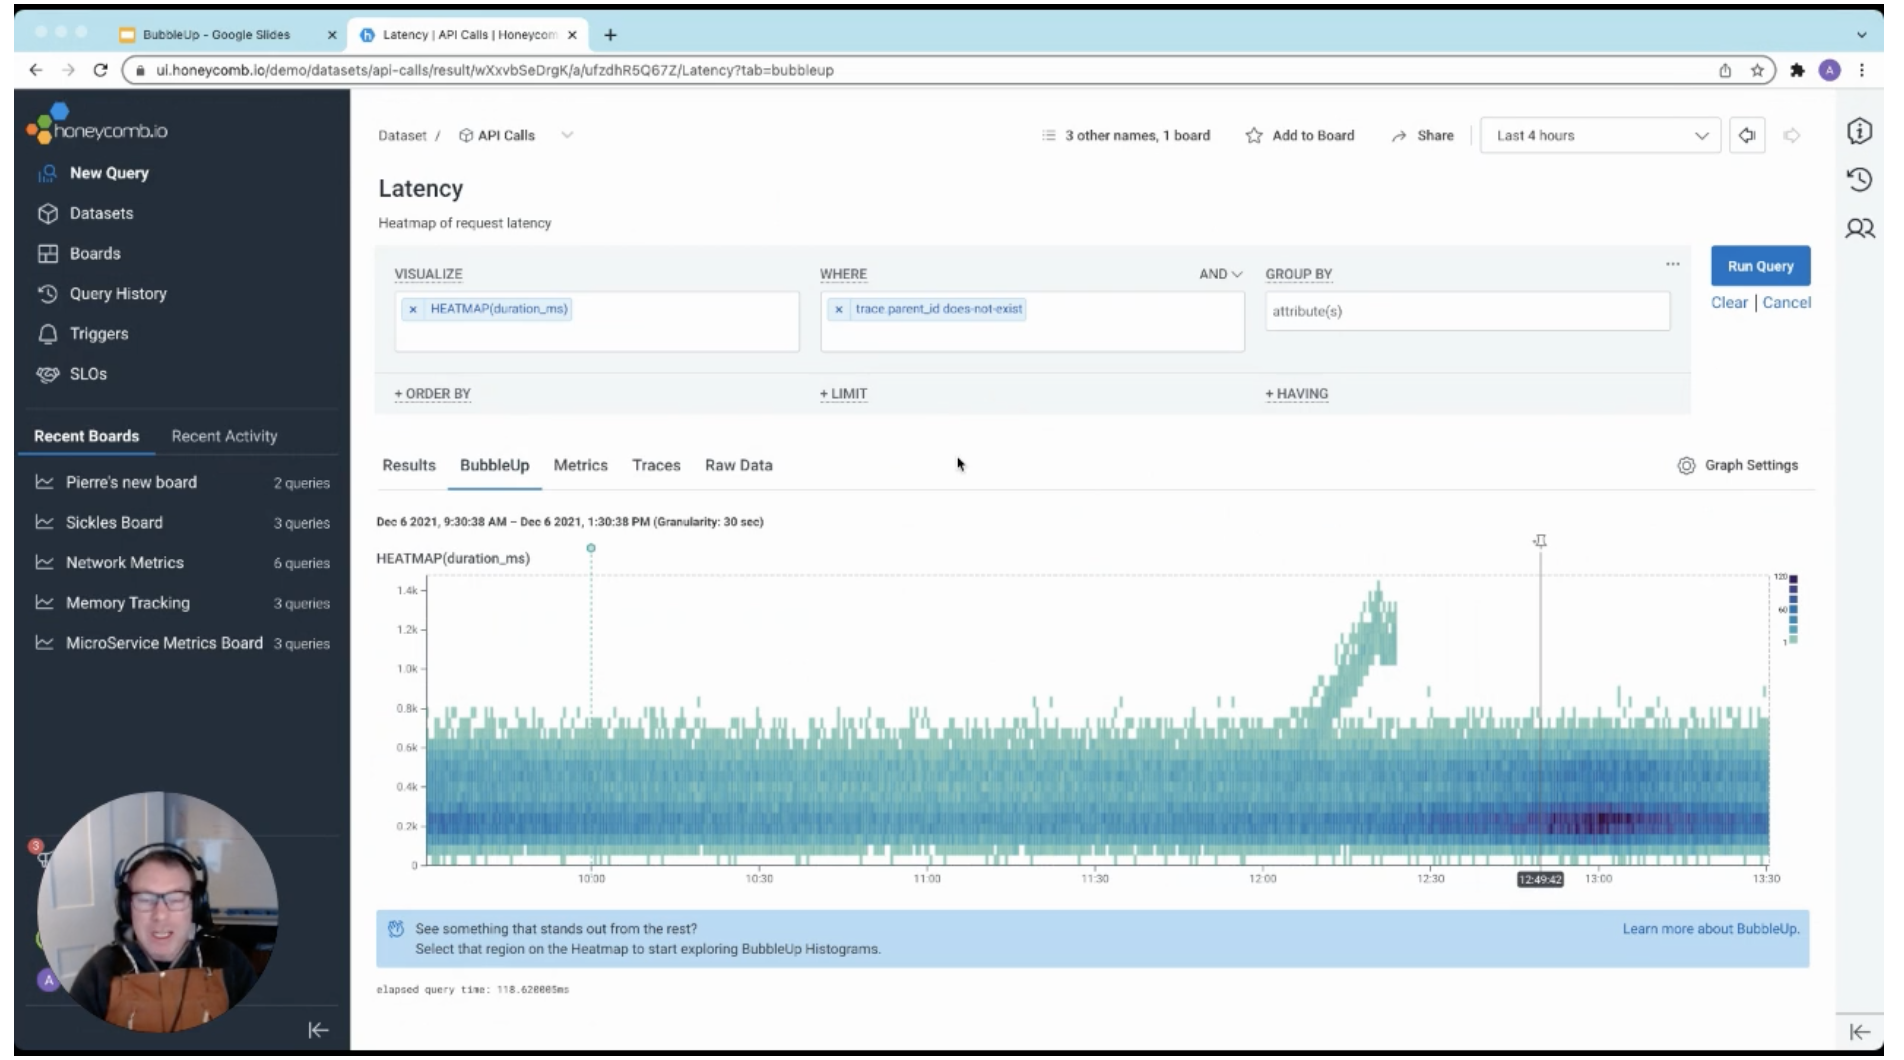
Along the way, he also teaches you about custom attributes you can add to your OpenTelemetry instrumentation and how Honeycomb’s proprietary columnar database makes it possible for you to get query results so incredibly quickly.
Watch Adam’s full session to see the BubbleUp magic in action. Or if you’re ready to start exploring to see what BubbleUp … well, bubbles up for you, take a gander at our docs.
Pipelines and Build Events
Build events help you build better builds. In his session, Pierre Tessier demonstrates how you can use observability and Honeycomb Build Events to understand what’s going on inside your CI/CD pipelines.
Whether you deploy once a week, or you run hundreds of builds a day, understanding how to maximize the performance of your build systems can save you valuable time. Getting fast feedback from your build testing is a critical step that results in ensuring smoother deployments to production.
In this session, Pierre walks you through Honeycomb’s own build pipelines and shows you how they’ve changed over time as real-world examples. He also shows you how you can instrument your own builds for better visibility into issues and reduced build times.
There are a lot of different ways to apply the lessons learned in this session. So if you watched this and you still have questions, we recommend booking office hours with one of our developer advocates to get free customized advice for your particular situation.
Debuggable Service-Level Objectives
Anyone who’s ever been on call knows it can suck. It’s never fun getting alerts when you’re asleep or out and about enjoying life. But worse is when the alerts aren’t meaningful or actionable: When it’s not an actual emergency, or when it can wait until a more convenient time to fix, or when it’s simply noise that doesn’t require action—that’s a fast road to burnout.
Enter debuggable service-level objectives (SLOs), presented by Adam Hicks, and how they can help business and engineering teams agree on what really matters: issues that impact customers. SLOs can help you change your traditional alerts to debuggable alerts that are always actionable. Rather than alerting on symptoms, you get alerted to real and meaningful issues that are happening in production. You can reduce alert noise, decrease the number of both false positives and false negatives, and sleep more soundly at night—only being alerted when it matters.
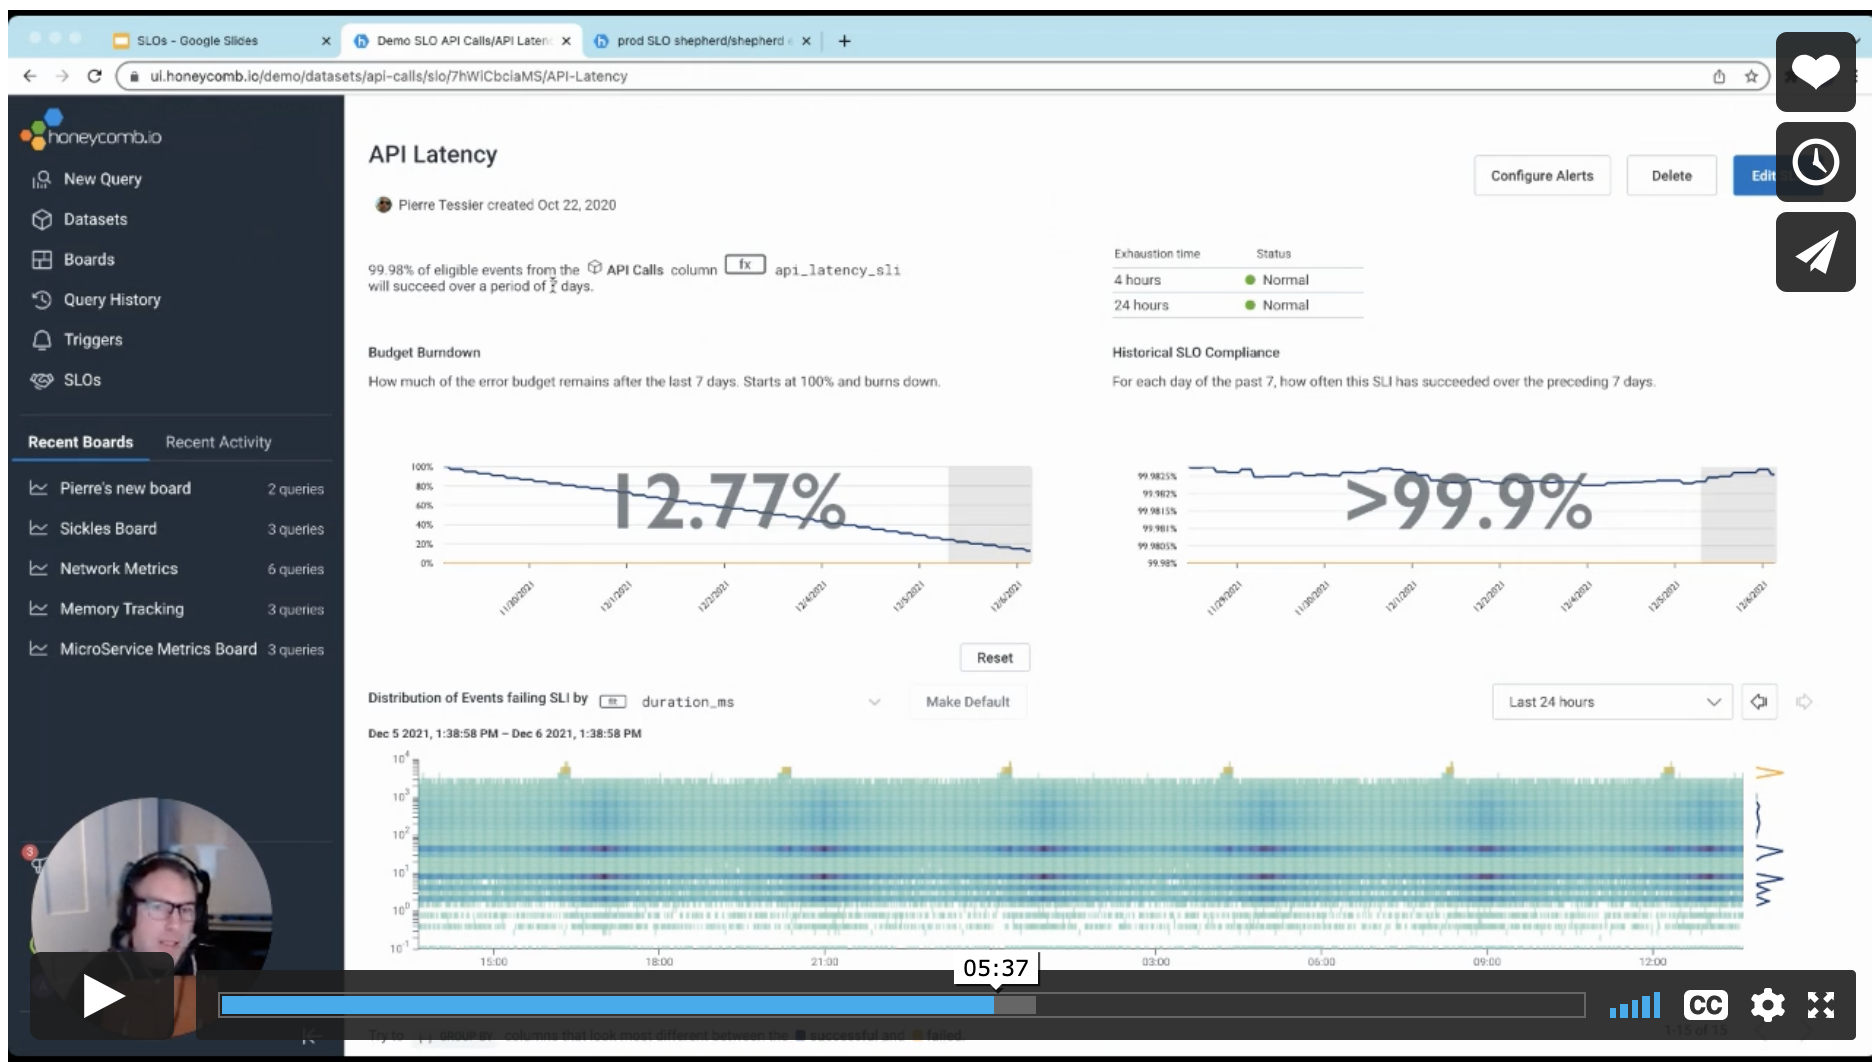
Adam covers the terminology related to SLOs, how error-budget burn alerts work, and how to set up everything you need to make them work in Honeycomb.
Check out our docs on SLOs for more details. Want to try out Honeycomb SLOs for yourself? Sign up for a free Enterprise trial today.
Honeycomb Metrics
In Michael Sickles’ session on Honeycomb Metrics, he shows you how to take a modern approach to using metrics data alongside your observability event data. Observability and events are a great way to debug application issues, obviating the need for application-level metrics. But metrics can still be incredibly useful at the system level.
In this session, he walks through getting metrics data into Honeycomb before showing how you can make your metrics data actionable, usable, and queryable. He shows multiple ways of using the OpenTelemetry Line Protocol (OTLP) format to send metrics to Honeycomb, including CloudWatch, Kubernetes, and Prometheus metrics.
For more information on Honeycomb’s modern approach to using metrics, see our docs for an overview. Honeycomb Metrics is an enterprise feature—if you don’t have an enterprise account and want to try out using metrics in Honeycomb, we encourage you to sign up for a free Enterprise trial.
Honeycomb in your workflows
Stay tuned for a future blog post re-capping the Honeycomb Developer Week day three sessions from integration partners like PagerDuty, LaunchDarkly, CircleCI, Apollo GraphQL, and Cloudflare. These sessions show you how Honeycomb speeds up and de-risks workflows when you use these tools together.
We had a blast hosting all of you at Honeycomb Developer Week and hope you had fun learning with us! Of course, the best way to learn is to sign up for Honeycomb and play with these features yourself. And if you need help, pop into our community Slack, Pollinators, or schedule office hours with our Developer Advocates.