Making Semantic Conventions Work for You With OpenTelemetry Weaver
In this post, I'll show how OpenTelemetry Weaver lets you define, layer, and validate semantic convention schemas so that both humans and agents have full context on every attribute in your telemetry.

By: Mike Goldsmith

Managing OpenTelemetry Semantic Convention Migrations With the Collector
This is what a semantic convention migration looks like in practice: not a clean cutover, but months of coexistence where old and new attribute names overlap. In this post, I'll explain why this happens, how the OpenTelemetry Collector's schema processor is designed to automate migrations in both directions, and what we're actively working on to get it into a state where everyone can use it.
Read Now
Your dataset has hundreds of attributes. Some are self-explanatory: http.response.status_code, server.address. Others are not: meta.refinery.reason, dataset.slug, sli.latency_target_ms. If you don't know what an attribute means, you can't write a good query. And if an AI agent doesn't know what it means, it guesses.
OpenTelemetry's semantic conventions solve part of this problem. They define a shared vocabulary for standard telemetry attributes so that http.response.status_code means the same thing regardless of which service or language produced it. But semantic conventions only cover the OpenTelemetry layer. Your platform's internal attributes and your organization's domain-specific attributes are undocumented, invisible to anyone who didn't create them.
In this post, I'll show how OpenTelemetry Weaver lets you define, layer, and validate semantic convention schemas so that both humans and agents have full context on every attribute in your telemetry. I'll also show how we use it at Honeycomb to build a three-layer registry that informs our AI agents about every column in your dataset.
What is OpenTelemetry Weaver?
OpenTelemetry Weaver is a toolset for defining, validating, and evolving telemetry schemas using semantic conventions. The philosophy is that telemetry should be treated like a public API. Just as you'd document and version your API endpoints, Weaver lets you document and version your telemetry attributes.
Weaver works with semantic convention schemas defined in YAML. Each schema describes groups of attributes with their names, types, descriptions, stability levels, and examples. Weaver resolves these schemas into a registry: a single, queryable source of truth for what your attributes mean.
Weaver's capabilities go beyond registry building. It can generate type-safe SDKs from schemas, compute diffs between schema versions for migration guidance, and validate live telemetry against your schema. I'll focus on the registry and how Honeycomb uses it.
Layered schemas: OpenTelemetry, Honeycomb, and your own
One of Weaver's most powerful features is its support for schema dependencies. You don't have to define everything from scratch. You start with the OpenTelemetry semantic conventions as a base, then layer your own definitions on top.
At Honeycomb, we use a three-layer model:
1. OpenTelemetry base covers the industry-standard attributes: HTTP, database, messaging, runtime metrics, and so on.
2. Honeycomb overlay adds platform-specific attributes that Honeycomb creates during ingest, like trace metadata, Refinery sampling fields, and browser Core Web Vitals.
3. Customer domain overlay (optional) adds your organization's own domain-specific attributes.
The OpenTelemetry base
The OpenTelemetry semantic conventions define hundreds of attributes across all signal types. Weaver resolves these into a self-contained registry with every attribute fully expanded, including inherited attributes and resolved references. This forms the foundation that everything else builds on.
The Honeycomb overlay
On top of the OpenTelemetry base, we add a Honeycomb schema that describes attributes specific to our platform. These are attributes that Honeycomb's ingest pipeline creates when it processes your telemetry, or concepts specific to how Honeycomb organizes data. They don't exist in the OpenTelemetry spec because they're Honeycomb-specific.
Here's a snippet describing Honeycomb workspace concepts:
groups:
  - id: hny.workspace
    type: attribute_group
    brief: Honeycomb workspace concepts used as query scope identifiers
    note: >
      Honeycomb organizes data as: Team -> Environment -> Dataset -> Events.
      These identifiers are used as scope parameters in API calls and tool inputs.
    stability: stable
    attributes:
      - name: team.slug
        type: string
        brief: Unique identifier for a Honeycomb team
        note: >
          Used as a scope parameter in Honeycomb API calls.
          All data in Honeycomb is scoped to a team.
        stability: stable
        examples:
          - my-company
          - acme-corp
      - name: dataset.slug
        type: string
        brief: Unique identifier for a dataset within a Honeycomb environment
        note: >
          Datasets are collections of events within an environment.
          Each dataset has its own set of queryable columns.
        stability: stable
        examples:
          - my-service
- frontend-eventsAnd here's another group describing Refinery sampling metadata:
  - id: hny.refinery
    type: attribute_group
    brief: Metadata added by Refinery during trace processing
    note: >
      These attributes are only present when traces pass through a Refinery
      instance. They are not set for traces sent directly to Honeycomb.
    stability: stable
    attributes:
      - name: meta.span_count
        type: int
        brief: Total number of spans in the trace
        stability: stable
        examples:
          - 1
          - 15
          - 200
      - name: meta.refinery.reason
        type: string
        brief: Sampling rule name that caused this trace to be kept
        stability: stable
        examples:
          - deterministic
          - dynamic/high-error-rate
      - name: meta.refinery.final_sample_rate
        type: int
        brief: Final effective sample rate applied by Refinery
        stability: stable
        examples:
          - 1
          - 10
- 100Each attribute has a name, type, brief description, and examples. The note field provides deeper context when needed. Without this schema, dataset.slug and meta.refinery.reason are just opaque column names. With it, anyone looking at the data understands exactly what they mean.
The customer domain overlay
The third layer is the most powerful for your team specifically. OpenTelemetry covers the standard attributes. Honeycomb covers the platform attributes. But nobody knows your business domain better than you do.
If your services emit attributes like payment.method, payment.retry_count, or order.fulfillment_status, those attributes are meaningful to your organization but invisible to anyone who didn't create them. A domain schema documents that knowledge in a structured, queryable way.
Here's what a customer domain schema might look like:
groups:
  - id: payments
    type: attribute_group
    brief: Payment processing attributes
    stability: stable
    attributes:
      - name: payment.method
        type:
          members:
            - id: credit_card
              value: credit_card
            - id: debit_card
              value: debit_card
            - id: bank_transfer
              value: bank_transfer
            - id: digital_wallet
              value: digital_wallet
        brief: Payment method used for the transaction
        stability: stable
        examples:
          - credit_card
          - digital_wallet
      - name: payment.retry_count
        type: int
        brief: Number of times this payment was retried after a transient failure
        note: >
          A value of 0 means the payment succeeded on the first attempt.
          Higher values indicate transient failures that were recovered from.
        stability: stable
        examples:
          - 0
          - 1
          - 3
      - name: payment.provider
        type: string
        brief: Payment gateway provider handling the transaction
        stability: stable
        examples:
          - stripe
          - adyen
- braintreeWhen this schema is loaded into the registry, payment.retry_count is no longer just a column name. It's "Number of times this payment was retried after a transient failure," with documented types, examples, and notes. That context is available to everyone working with the data.
Honeycomb supports uploading custom schemas so this context is always part of your registry.
How Honeycomb uses the registry
The registry is built by merging the OpenTelemetry resolved schema with the Honeycomb overlay into a single index. When a customer has a custom schema configured, it is merged on top per-team.
Automatic column descriptions
When you list the columns in a dataset, Honeycomb automatically populates descriptions from the registry for any column that doesn't already have a custom description set. This means that even if nobody on your team has manually documented a column, the registry fills in the context. An agent or human looking at your dataset sees:
- http.response.status_code described as "HTTP response status code" (from OpenTelemetry)
- meta.span_count described as "Total number of spans in the trace" (from the Honeycomb overlay)
- payment.retry_count described as "Number of times this payment was retried after a transient failure" (from your domain schema)
If you've already set a custom description for a column, that takes precedence. The registry only fills gaps.
MCP tools for deeper exploration
Beyond automatic descriptions, the registry powers MCP tools available to both Honeycomb Canvas and external agents using the Honeycomb MCP server:
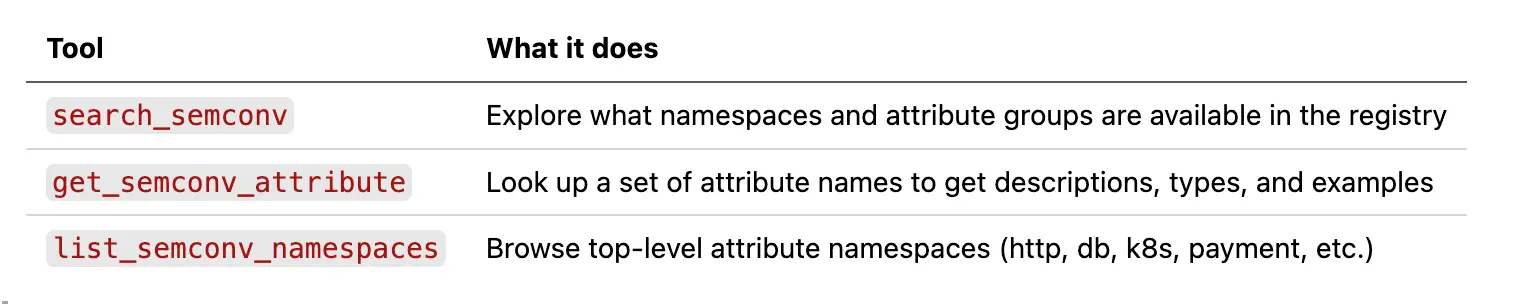
These tools give agents a way to go beyond what's on the columns list. An agent investigating a performance issue can search the registry for related attributes it hasn't seen yet, or look up detailed notes on an attribute to understand edge cases before writing a query.
For example, an agent querying Refinery metadata might call get_semconv_attribute with meta.refinery.reason and learn that it's "Sampling rule name that caused this trace to be kept," with examples like deterministic and dynamic/high-error-rate. That context turns a GROUP BY on an opaque column into an informed analysis of your sampling behavior.
The result is that agents make informed decisions about what to query and how to interpret the results, rather than guessing based on attribute names alone.
Beyond the registry: what else Weaver can do
The registry is the foundation, but Weaver has several other capabilities worth knowing about:
- Live checking validates real telemetry against your schema. Point it at an OTLP source and it checks for missing required attributes, type mismatches, deprecated attributes, and invalid enum values. Useful in CI/CD pipelines or during development to catch schema violations before they reach production.
- Code generation produces type-safe SDKs, documentation, and other artifacts from your schema using Jinja templates. Makes instrumenting applications easier.
- Schema diffing computes the differences between two registry versions, helping you plan migrations when your conventions evolve.
Each of these deserves its own deep dive, but the registry is where it all starts.
Writing your own schema
Defining a custom schema for your organization is straightforward. You write YAML that describes your domain attributes, grouped by area of concern. Honeycomb handles the resolution and merging with the OpenTelemetry base for you.
Here's a minimal example for a logistics domain:
groups:
  - id: shipment
    type: attribute_group
    brief: Order fulfillment and shipment tracking attributes
    stability: stable
    attributes:
      - name: shipment.carrier
        type: string
        brief: Logistics carrier handling the shipment
        stability: stable
        examples:
          - fedex
          - ups
          - dhl
      - name: shipment.warehouse_id
        type: string
        brief: Identifier of the warehouse that fulfilled the order
        note: >
          Maps to the internal warehouse code. Use alongside
          deployment.environment to distinguish staging test
          warehouses from production facilities.
        stability: stable
        examples:
          - us-east-1a
          - eu-west-2b
      - name: shipment.sla_tier
        type: string
        brief: Delivery SLA tier promised to the customer
        stability: stable
        examples:
          - next-day
          - standard
- economyEach attribute needs a name, type, and brief description at minimum. Add examples to show the expected values, and notes for any non-obvious behavior.
Upload this to Honeycomb and it becomes the third layer in your registry, merged alongside the OpenTelemetry and Honeycomb layers.
Getting started
OpenTelemetry Weaver is available on GitHub at open-telemetry/weaver. The opentelemetry-weaver-examples repo has working examples of custom registries with dependencies.
If you're a Honeycomb user, you can upload a custom schema today so that AI agents understand your domain attributes when analyzing your data.
Semantic conventions are the foundation that makes telemetry understandable. Weaver makes them composable, queryable, and validated. When both humans and agents can look at an attribute and immediately understand what it means, your observability gets more useful for everyone.
Want to see how semantic convention context improves your agent experience? Sign up for a free Honeycomb account and start querying, or book office hours with one of our Developer Advocates if you want a hand setting up custom schemas.