RUM without visibility gaps
Honeycomb for Frontend Observability goes beyond shallow dashboards. Understand your frontend, mobile, and backend together. See what broke, where, why, and for whom so your teams can fix it fast and build better experiences.
Talk to Us try in sandbox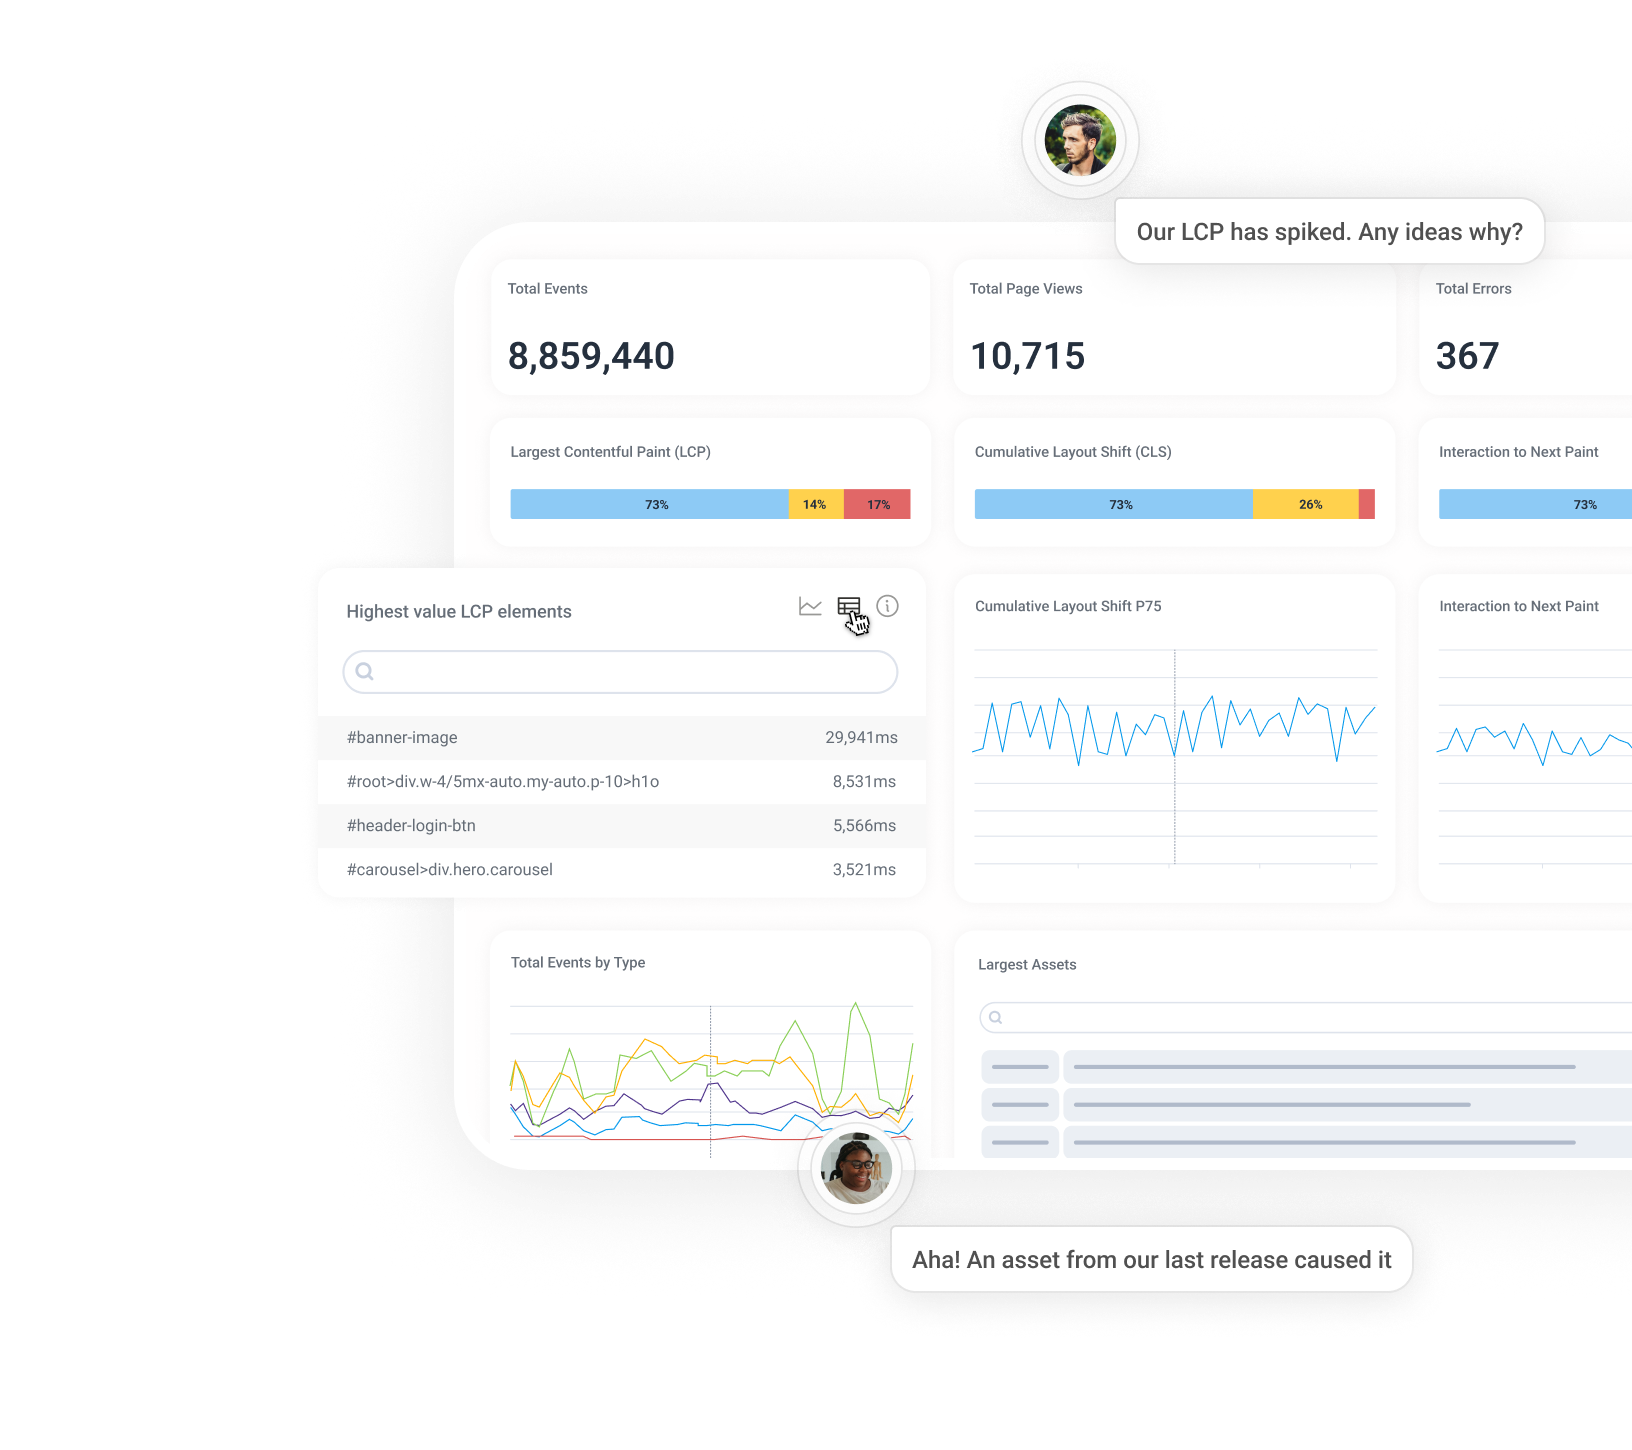
Why you’ll love Honeycomb
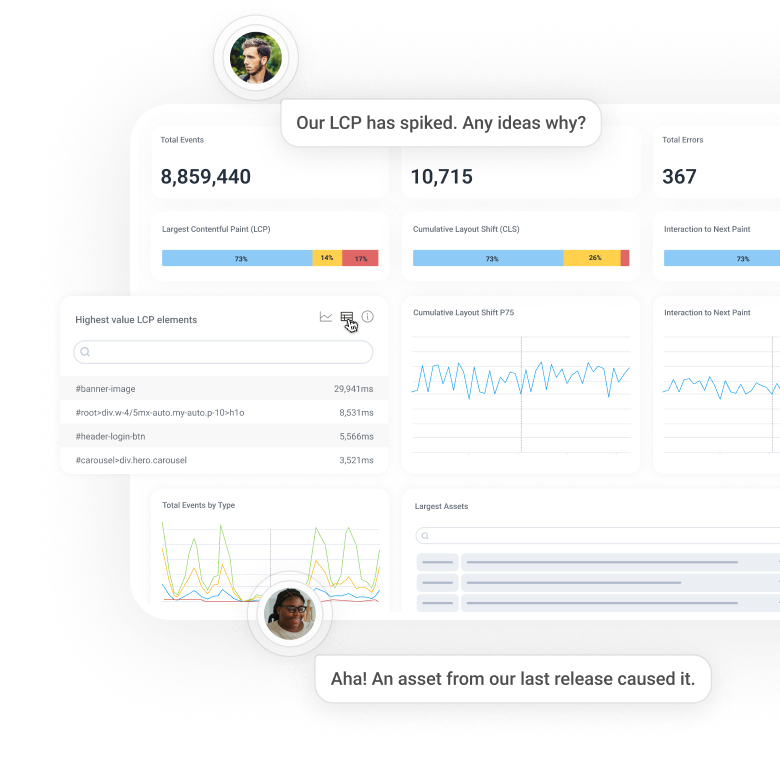
Find performance killers, fast
Debug Core Web and Mobile Vitals with real-time visualizations that reveal exactly what’s affecting them—in just a few clicks.
See the full story behind every issue
Debug faster with end-to-end traces and performance data in one place. Follow every user journey, from click or tap to backend call. Spot what’s slow or broken and fix it fast with your whole team in sync.
Business context, everywhere
Add user ID, plan type, feature flag, and more with up to 2,000 free custom attributes per event, no triaging required. Break down behavior by any dimension to uncover what’s really impacting users.
Feature highlights
Feature highlights

Web, iOS, and Android Launchpads
Get a shortcut to the most relevant performance metrics for web, iOS, and Android with visualizations that let you drill into the underlying data with no dead ends. Filter by any attribute, modify queries, and jump straight into traces with full context.

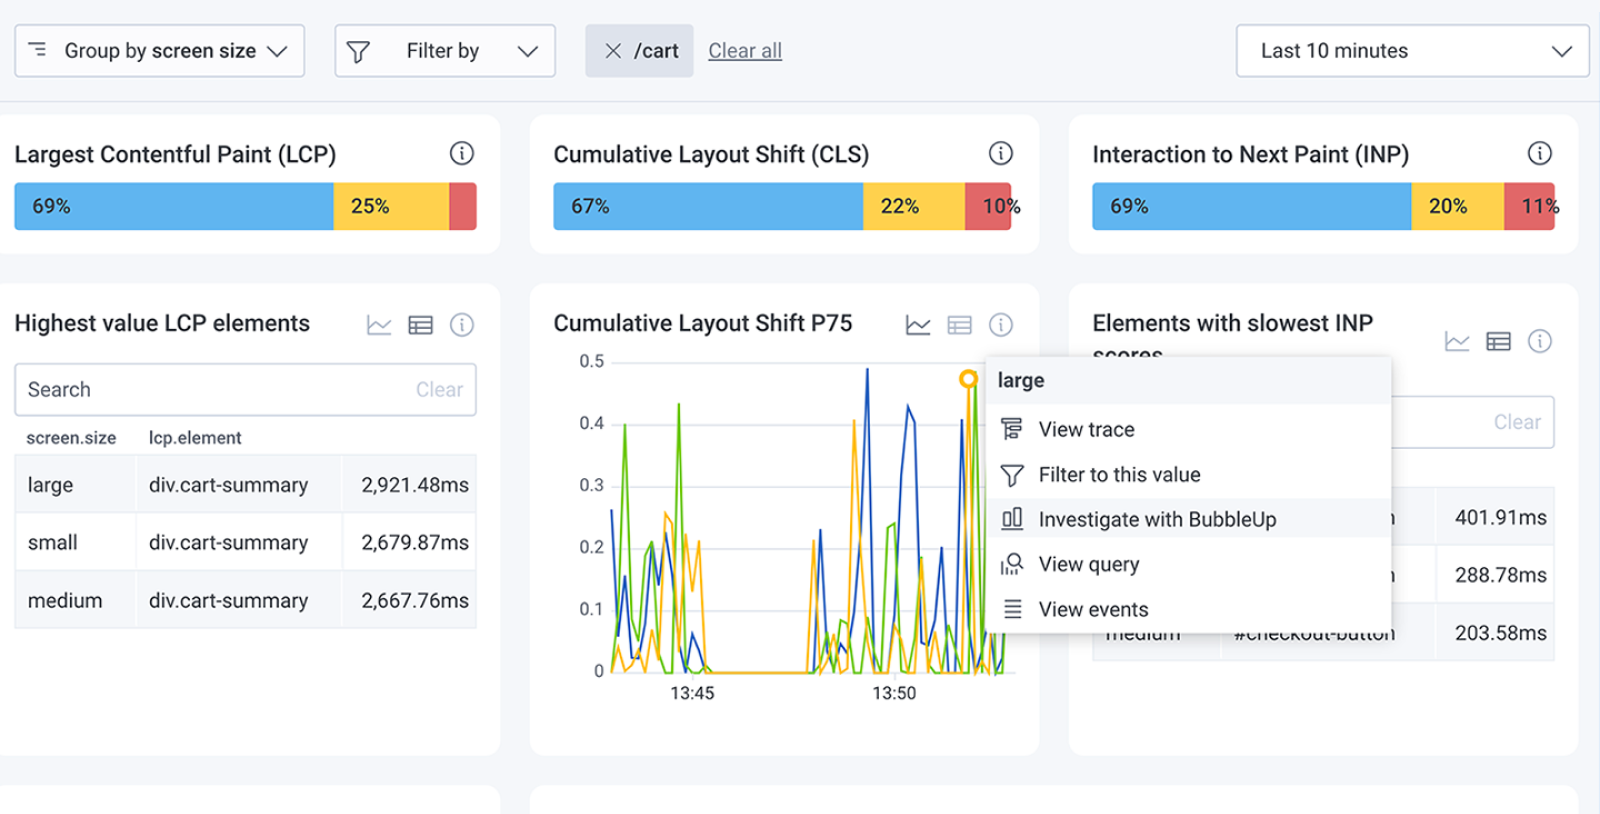
Faster answers for everyone
Give every team member the power to explore, explain, and resolve. Build natural language queries with Query Assistant, uncover the root cause of failed user journeys with BubbleUp, and share answers instantly with a link.
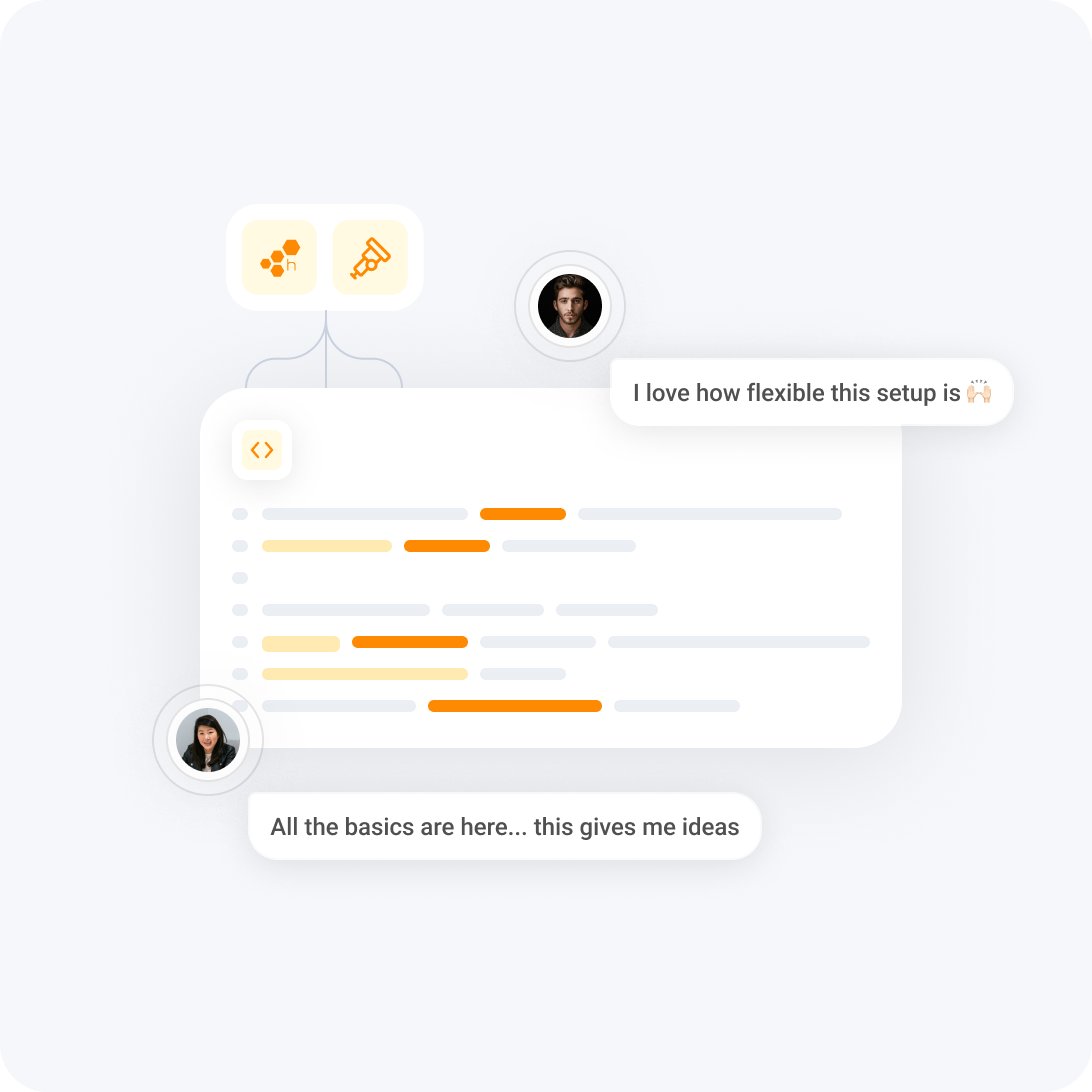
No-compromise instrumentation
Instrument quickly without vendor lock-in using Honeycomb’s OpenTelemetry-based SDKs for web and native mobile apps. Auto-capture Core Web and Mobile Vitals with the attribution data behind them so you can see exact root causes. Seamless trace propagation gives you consistent, end-to-end visibility.

E-commerce is critical to Fender. Honeycomb for Frontend Observability removes the guesswork from diagnosing our site’s performance issues by tracking precise page speeds, filtering sessions, and identifying the cause of speed spikes, enabling targeted site optimization for maximizing conversions and delivering better customer experiences.


Dive deeper
Learn more about the power and possibilities of Honeycomb.

Beyond Backend: Honeycomb for Frontend Observability is Now GA
Observability has traditionally been backend-focused, but the frontend is just as hard—if not harder—to debug and has simply outgrown current monitoring tools. Engineers working with the frontend need the ability to see every user interaction with their system—and all the rich context around it. They need observability for the frontend. Today, we’re proud to announce that Honeycomb for Frontend Observability is now generally available.

Redefining RUM: A Comparative Gap Analysis of Existing Tools
Real user monitoring (RUM) began as a straightforward approach to tracking basic web performance metrics. Focused on things like page load times and response rates, RUM relied on server-side logging and simple browser timings. While these tools captured Core Web Vitals (CWVs), they offered limited insights into how users actually interacted with pages, focused mainly on server-side performance.


Give it a try in our sandbox
Use Honeycomb to find the most promising optimizations by debugging Core Web Vitals.
explore sandbox


Want to know more?
Talk to our team to arrange a custom demo or for help finding the right plan.