
You might already know that OpenTelemetry is the future of instrumentation. It’s an open-source and vendor-neutral instrumentation framework that frees you from the trap of using proprietary libraries simply to understand how your code is behaving. Best of all, you can instrument your applications just once and then take that instrumentation to any other backend system of your choice.
This blog shows you exactly how to use OpenTelemetry to ✨break the vendor lock-in cycle.✨
Why should you use OpenTelemetry?
OpenTelemetry provides an open standard for generating, collecting, and exporting application telemetry across any number of backend systems. Application telemetry (such as tracing, metrics, and logs) is necessary to better understand and debug application performance. Prior to OpenTelemetry, your choice was to use vendor-specific libraries to instrument your code.
In the past, you were required to manually instrument your application to meet vendor spec or simply use the vendor’s own instrumentation libraries. And if you later became curious about another solution and wished to try it out? Yes, you guessed it; you had to first rip all the old instrumentation out of your code base, then re-instrument it with an entirely second set of libraries and paradigms. You can forget going through this cycle several times to explore the landscape of tools—after just one or two rounds of tedious re-tooling, you’re likely to give up and learn to live with what you got.
That’s the trap of vendor lock-in and it sucks. It means most people out there are stuck using whatever tool they happened to pick up first. Not out of any love for the tool, but out of fear and avoiding the tremendous amount of work required to change. Vendors should have to compete for your love based on how well they can delight you and solve your problems, not based on how annoying it is to get rid of them. Right?
Well, many others have agreed—and out of that shared frustration, standards began to emerge in the form of two parallel open-source projects, OpenCensus and OpenTracing. Eventually, the communities merged and combined the two standards into the OpenTelemetry project. While it’s still a relatively new kid on the block, OpenTelemetry (or OTel) is growing up fast and was recently accepted as a CNCF incubating project.
With growing vendor support for the native OTel export format (OTLP), switching between vendors has never been easier. The goals are that anyone should only ever have to instrument their code once using OTel and that switching between vendors should be as simple as changing a config file, thus forcing vendors to compete on being great for users instead of being impossible to get rid of.
Let’s see the switching of vendors with OTel in action. 😀
How to switch vendors with OpenTelemetry
We’ll start with a simple Node.js Express app. We just have one route, and we fetch a todo to keep things interesting.
// app.js

const express = require("express");

const https = require("https");

const app = express();

app.get("/", async (req, res) => {

  https.get("https://jsonplaceholder.typicode.com/todos/1", (incoming) => {

    incoming.on("data", (data) => {

      console.log(JSON.parse(data))

    });

    incoming.on("end", () => {

      res.send("OK")

    });

  });

});

app.listen(3000, () => {

  console.log(`Listening for requests on http://localhost:3000`);

});
Now let’s sprinkle some OTel on it. We’re going to add a few dependencies and introduce a tracing.js file that initializes the OTel SDK.
"dependencies": {

"@grpc/grpc-js": "1.3.7",

"@opentelemetry/api": "1.0.3",

"@opentelemetry/auto-instrumentations-node": "0.25.0",

"@opentelemetry/exporter-collector-grpc": "0.25.0",

"@opentelemetry/sdk-node": "0.25.0",

"express": "~4.16.1"

  }

```

```js

// tracing.js

const opentelemetry = require('@opentelemetry/sdk-node');

const { getNodeAutoInstrumentations } = require('@opentelemetry/auto-instrumentations-node');

const { CollectorTraceExporter } = require("@opentelemetry/exporter-collector-grpc");

const { credentials } = require("@grpc/grpc-js");

const traceExporter = new CollectorTraceExporter({

  credentials: credentials.createSsl(),

});

let sdk = new opentelemetry.NodeSDK({

  traceExporter,

  instrumentations: [getNodeAutoInstrumentations()]

});

sdk.start()
We’re going to configure the rest of the OTel pipeline via environment variables. First, let’s point it at Honeycomb.
export OTEL_EXPORTER_OTLP_ENDPOINT=“https://api.honeycomb.io”

export OTEL_EXPORTER_OTLP_HEADERS=“x-honeycomb-team=MY_HNY_KEY,x-honeycomb-dataset=otel-node”

export OTEL_SERVICE_NAME=“express-backend”
Now, when we run our traced app and hit our endpoint, we see some lovely trace data in Honeycomb UI.
node -r tracing.js app.js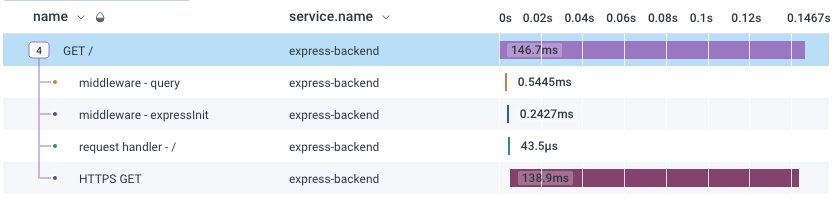
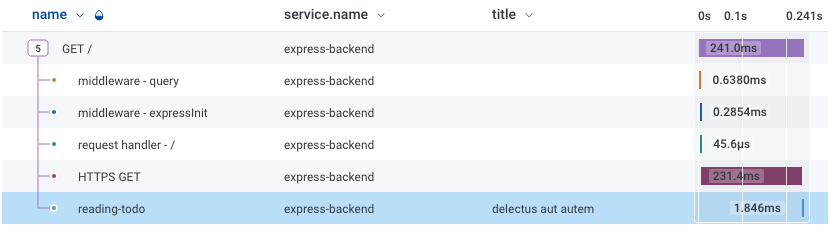
Of course, we don’t stop here. We want to know what kind of todo we fetched. Let’s add a span with the todo title as an attribute.
// app.js
const otel = require("@opentelemetry/api");
let tracer = otel.trace.getTracer("my-tracer");
app.get("/", async (req, res) => {
https.get("https://jsonplaceholder.typicode.com/todos/1", (incoming) => {
let span = tracer.startSpan("reading-todo");
incoming.on("data", (data) => {
span.setAttribute("title", JSON.parse(data).title)
});
incoming.on("end", () => {
span.end();
res.send("OK")
});
});
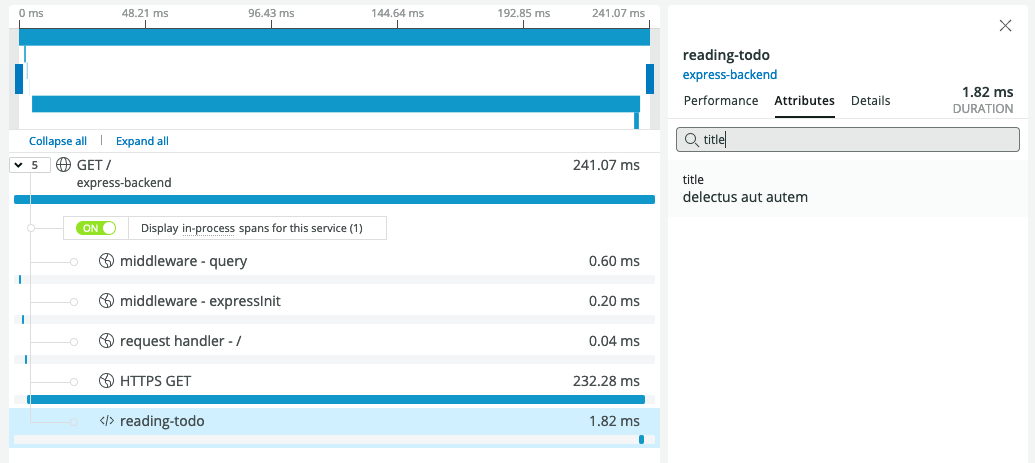
});Oh hey, we got another span in our trace, and it shows the todo title!
Now, let’s say that you want to send your data somewhere other than Honeycomb. Easy—just swap out your endpoint and headers. Let’s look at New Relic as an example.
export OTEL_EXPORTER_OTLP_ENDPOINT=“https://otlp.nr-data.net:4317/”

export OTEL_EXPORTER_OTLP_HEADERS=“api-key=MY_NR_KEY”
Now, after re-running the app and hitting the endpoint, we can see the trace, including our very useful todo title, in New Relic.
But what if you’re not quite ready to make the switch and want to shop your data around multiple vendors? The OpenTelemetry Collector is an OTel component that allows you to ingest, process, and export telemetry by configuring data pipelines. It’s not a required component, but in this case we can leverage it to send our traces to both Honeycomb and New Relic. We start by running the collector locally in a Docker container.
docker run -p 4317:4317 -v /collector-config.yaml:/etc/collector-config.yaml otel/opentelemetry-collector —config=/etc/collector-config.yamlHere’s our collector-config.yaml file that exports to the two vendors.
receivers:

  otlp:

    protocols:

      grpc:

exporters:

  otlp/hny:

    endpoint: api-dogfood.honeycomb.io:443

    headers:

      "x-honeycomb-team": "MY_HNY_KEY"

      "x-honeycomb-dataset": "otel-node"

  otlp/nr:

    endpoint: otlp.nr-data.net:4317

      headers:

        "api-key": "MY_NR_KEY"

service:

  pipelines:

    traces:

      receivers: [otlp]

      exporters: [otlp/hny,otlp/nr]
Because now our Node.js app will be sending data to the Collector on localhost, we need to update our gRPC credentials to be insecure.
// tracing.js

const traceExporter = new CollectorTraceExporter({

  credentials: credentials.createInsecure(),

});
Finally, we swap our endpoint for the collector address.
export OTEL_EXPORTER_OTLP_ENDPOINT=localhost:4317Now, after we run the app and hit our endpoint, the trace appears in both Honeycomb and New Relic. This is what lets you compare and contrast different vendor solutions to your heart’s desire!
Break yourself out of the cycle of vendor lock-in
The example in this blog is a trivial one, but think of the dozens (or hundreds? Hello, microservices) of endpoints and code paths that can be left blissfully unaware of your tracing backend. With OpenTelemetry, there is no need to hardcode vendor-specific logic into your applications only to get stuck with them until the end of time.
OpenTelemetry enables you to have more agency over your telemetry data, and opens more doors when choosing a vendor (or multiple vendors!). At Honeycomb, we believe that the value we provide for you is evident once you start analyzing and debugging your telemetry. Observability is measured by your ability to quickly identify the correct sources of issues and to discover hidden problems that legacy tools simply can’t show you. Those metrics, logs, and traces are simple table stakes and you shouldn’t be locked into a particular solution just to get your data.
We fully support the OpenTelemetry project and we hope you’ve found this step-by-step example helpful.
Try it for yourself
Did we pique your interest in OpenTelemetry? If you’re ready to dive in, check out our quickstart docs for setting up OTel with Honeycomb and, if you haven’t already, sign up for a free Honeycomb account. If Honeycomb doesn’t work for you, you’ll be able to take that work elsewhere.
You can also learn more about the project, find documentation, and join the OTel community at https://opentelemetry.io/