Instrumenting a Demo App With OpenTelemetry and Honeycomb
A few days ago, I was in a meeting with a prospect who was just starting to try out OpenTelemetry. One of the things that they did was to create an observability demo project which contained an HTTP reverse proxy, a web frontend, three microservices, a database, and a message queue.

By: Howard Yoo
A few days ago, I was in a meeting with a prospect who was just starting to try out OpenTelemetry. One of the things that they did was to create an observability demo project which contained an HTTP reverse proxy, a web frontend, three microservices, a database, and a message queue. Here’s a rough diagram:
Their motivation was to try out OpenTelemetry and see how much effort it took for them to instrument their system. They wanted to see whether they could pull this off with a minimal amount of effort, and derive the scope of how much auto-instrumentation they could leverage versus manual instrumentation.
Today, I’m sharing a step-by-step guide on how I instrumented this demo application with OpenTelemetry and what challenges I encountered. While I was working on instrumenting this demo app, I found that it was difficult to find a centralized source of information related to OpenTelemetry instrumentation—because many of these sources were scattered around in different places. I hope that this blog post helps make your journey easier.
Don’t have a Honeycomb account yet?
Get one for free today.
The demo application
The original demo application can be found in this o11y demo repo. If you want to try it out by yourself (and I strongly recommend you do), you need to check it out using Git CLI, with Docker desktop installed on your local machine. Simply clone the o11y-demo repo using this Git command:
git clone git@github.com:gkspranger/o11y-demo.gitDone! It should now be cloned in your environment. Running the application is very easy. Run docker compose command to start it up using the pre-curated make up command (you should see a Makefile in this repo).
Once it’s up, you can also shut it down using the command make down.
Submitting the workload can be done using the make command, with three different options:
make fast
make slow
make many
Each will submit a request: fast will trigger the application to perform quickly, slow will make application run relatively slowly, and many will go into a loop randomly invoking either fast or slow service calls.
Step one: auto-instrumentation
I skimmed through each directory representing each component of this demo application. It had the following components:
- WAF: Stands for Web Application Firewall, and contains haproxy.cfg file.
- WEB: Runs NGINX web frontend. Houses nginx.conf.
- Tier1: The initial entry point, written in Python.
- Tier2: A microservice that Tier1 interacts with, also written in Python.
- DB: MySQL database that persists certain information.
- Cons: A separate microservice that consumes messages published into the message queue. Written in Python.
The message queue, in RabbitMQ, did not require any specific configuration—hence, no directory.
My initial strategy for instrumenting these in OpenTelemetry was to leverage as much auto-instrumentation as possible. My initial targets for configuring such auto-instrumentation were the Python applications.
Auto-instrumenting Python applications
OpenTelemetry’s support for Python is stable and mature, and you almost never need to change your existing code. I started by adding the following OpenTelemetry Python packages to each requirements.txt that the directories had:
opentelemetry-distro
opentelemetry-exporter-otlpThen, I modified each Dockerfile as such:
FROM docker.io/library/python:3.11.7-slim AS base
WORKDIR /app
COPY requirements.txt .
RUN pip3 install -r requirements.txt
RUN opentelemetry-bootstrap --action=installCOPY app.py .
CMD opentelemetry-instrument \ python3 /app/app.pyIn addition to these minor changes, I also told OpenTelemetry Python where to send traces. I modified the docker compose.yml file to contain this information:
  tier1:
    build:
      context: ./tier1
      dockerfile: Dockerfile
    environment:
      - OTEL_SERVICE_NAME=tier1-service
      - OTEL_EXPORTER_OTLP_PROTOCOL=http/protobuf
      - OTEL_TRACES_EXPORTER=console,otlp_proto_http
      - OTEL_EXPORTER_OTLP_ENDPOINT=https://api.honeycomb.io
- OTEL_EXPORTER_OTLP_HEADERS=x-honeycomb-team=${HONEYCOMB_API_KEY}In order to not expose the actual Honeycomb API key, I exported the API key as HONEYCOMB_API_KEY, and then let that become the environment for my Python containers as OTEL_EXPORTER_OTLP_HEADERS.
But as you can see in this section of the docker compose file, I defined several OTEL_* environment variables:
- OTEL_SERVICE_NAME: defines which service the trace originated from.
- OTEL_EXPORTER_OTLP_PROTOCOL: defines whether you want to use http or grpc for the OpenTelemetry protocol type. In this example, I chose to use http.
- OTEL_TRACES_EXPORTER: defines types of exporters. I did use console exporter so that any traces generated are output into the standard output of the application, to make debugging easier.
- OTEL_EXPORTER_OTLP_ENDPOINT: the URL of my endpoint that will receive traces. Since I’m using Honeycomb, I used https://api.honeycomb.io.
- OTEL_EXPORTER_OTLP_HEADERS: included in my request to pass the security.
Getting traces in Honeycomb
If you haven’t already signed up,
Get started with Honeycomb for free.
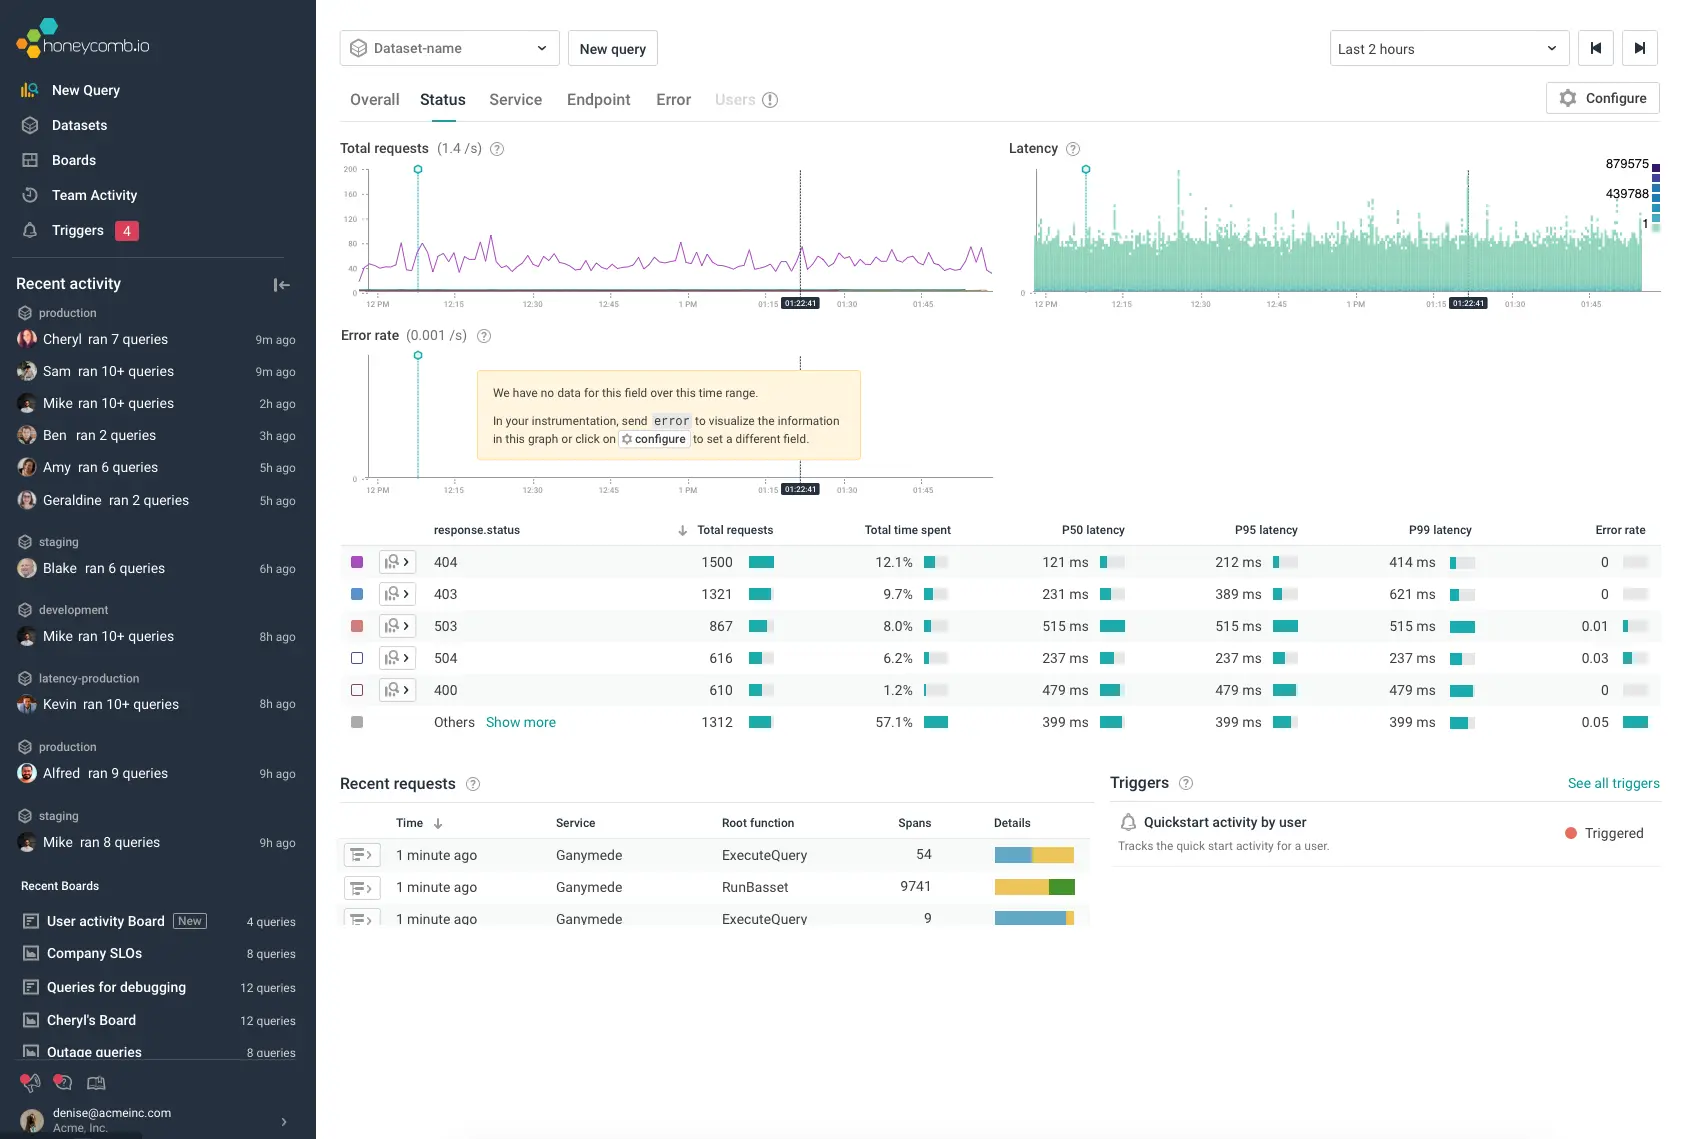
Once traces start to flow into Honeycomb, you can query them via query builder. Look for the dataset that matches what you specified in OTEL_SERVICE_NAME. Any span that appears in your query, you can right click the mouse and select ‘View Trace.’
OpenTelemetry’s auto-instrumentation worked better than I expected. You can see tier1-service sending the message into the message queue, which is then picked up by cons-service. Tier1-service then calls tier2-service. Based on the trace, it looked like cons-service and tier2-service both called MySQL databases using SQL statements. Also, tier1-service called an external SaaS service.
It was helpful to see the db.statement that the application used, all due to the wonderful auto-instrumentation that captured it automatically, along with rich context of things like database user, db system, db name, etc.
Step two: turning logs into span events
When looking at the Python application, I noticed that the code produced some ‘logging’ function that looked like this:
def logit(msg):
    """making sure we are printing out to stderr
print(f"CONSQUE: {msg}", file=sys.stderr)There were several places where the code was outputting some important messages into standard error. But I wondered if I could easily turn these into OpenTelemetry logs. Turns out I could if I used Python’s logging package. So, I changed the above logit function into this:
log = logging.getLogger(__name__)

def logit(msg):
    """making sure we are printing out to stderr
    so log can be seen while running docker-compose"""
    # print(f"CONSQUE: {msg}", file=sys.stderr)
log.warning(msg)I chose to use warning instead of usual info due to a minor bug that I discovered while working on this, where generating info type log messages is ignored by the auto-instrumentation library (that PR is currently submitted to be reviewed and eventually merged).
I then added the following additional OTEL_* environment variables to enable the logging to be auto-instrumented.
- OTEL_LOGS_EXPORTER=otlp_proto_http
- OTEL_PYTHON_LOGGING_AUTO_INSTRUMENTATION_ENABLED=trueAfter restarting, the logging messages started to appear, along with the traces! Notice how Honeycomb stores the log messages in a special attribute called body. When you look for logs in Honeycomb, remember to look for any events that have this body in it.
Correlating logs as span events
Pretty good start, right? But I knew I could make it even better. What if I could ‘correlate’ these logs to the very spans that produced them? Wouldn’t that make checking the log much easier?
Adding this additional environment variable made that happen:
- OTEL_PYTHON_LOG_CORRELATION=trueWith this variable, any instrumented log messages will have the relevant trace_id and span_id of the span that was active at that time put into the log event’s attribute. When that happens, Honeycomb does its magic: it converts that into span events and attaches them to the span!
Now, when you restart the application, notice now the trace.parent_id and trace.trace_id contain the value they occurred from:
Reopen the same trace. You’ll see it now has span events containing these log messages!
Notice how the spans now have ‘circles’ which indicate the span events. When you click on the span, you should be able to see all the log messages that were coded in the right pane under the tab ‘Span events.’
Step three: adding metrics
Even though I was pretty happy with how I instrumented my Python apps, the MySQL database and RabbitMQ never appeared in Honeycomb. Even though they’re not part of the application trace, having their performance metrics appear should make investigations much easier.
OpenTelemetry fortunately has the necessary integrations available for monitoring MySQL and RabbitMQ. However, since they can’t send their metrics to Honeycomb by themselves, I had to introduce a new component: the OpenTelemetry Collector.
Configuring the Collector
I added the following service, otel-collector, in the docker’s compose.yml:
services:

  otel-collector:
    image: otel/opentelemetry-collector-contrib:0.70.0
    labels:
      description: "OpenTelemetry collector"
    environment:
      - HONEYCOMB_API_KEY=${HONEYCOMB_API_KEY}
    container_name: "otel-collector"
    command: [--config=/etc/otel-collector-config.yml]
    volumes:
      - ./otel-collector/otel-collector-config.yml:/etc/otel-collector-config.yml
    ports:
      - 24317:4317    # OTLP grpc receiver
      - 24318:4318    # OTLP http receiver
    depends_on:
      db:
        condition: service_healthy
      queue:
condition: service_healthyThen, I added ./otel-collector/otel-collector-config.yml:
receivers:
  otlp:
    protocols:
      http:
        endpoint: 0.0.0.0:4318
      grpc:
        endpoint: 0.0.0.0:4317
  mysql:
    endpoint: db:3306
    username: root
    password: admin
    collection_interval: 60s
  rabbitmq:
    endpoint: http://queue:15672
    username: test
    password: test
    collection_interval: 60s

processors:
  batch:

exporters:
  otlp/metrics:
    endpoint: api.honeycomb.io:443
    headers:
      x-honeycomb-dataset: metrics
      x-honeycomb-team: ${env:HONEYCOMB_API_KEY}

service:
  pipelines:
    metrics:
      receivers: [otlp, mysql, rabbitmq]
      processors: [batch]
exporters: [otlp/metrics]The configuration now collects metrics against the MySQL database and RabbitMQ every 60 seconds via the OpenTelemetry Collector’s receivers. It then exports everything as ‘metrics’ as the dataset, and I can then look all this up in Honeycomb.
After starting everything up, I see metrics flowing in from the MySQL database:
And from RabbitMQ:
These will not appear as traces, but you can keep track of these metrics either via query builder, or by using Boards to keep track of important signals.
You can also add any additional metrics, like the host metrics, as additional sources. I added hostmetrics as part of the receiver:
receivers:
  otlp:
    protocols:
      http:
        endpoint: 0.0.0.0:4318
      grpc:
        endpoint: 0.0.0.0:4317
  mysql:
    endpoint: db:3306
    username: root
    password: admin
    collection_interval: 60s
  rabbitmq:
    endpoint: http://queue:15672
    username: test
    password: test
    collection_interval: 60s
  hostmetrics:
    collection_interval: 60s
    scrapers:
      cpu: {}
      disk: {}
      load: {}
      filesystem: {}
      memory: {}
      network: {}
      paging: {}
      processes: {}

processors:
  batch:
  resourcedetection:
    detectors: [env, system] # include ec2 for AWS, gcp for GCP and azure for Azure.
    # Using OTEL_RESOURCE_ATTRIBUTES envvar, env detector adds custom labels.
    timeout: 2s
    override: false
    system:
hostname_sources: [os]Then, I added it in the Collector’s metrics exporter pipeline:
service:
  pipelines:
    metrics:
      receivers: [otlp, mysql, rabbitmq, hostmetrics]
      processors: [resourcedetection, batch]
exporters: [otlp/metrics]Now, I have the application emitting the three different types of telemetry data: logs, traces, and metrics.
Honeycomb can now store this data, which helps me better troubleshoot the application’s problems Thanks, OpenTelemetry Collector and auto-instrumentation!
Step four: WAF
I wanted to see if I could also make traces more complete by adding the WAF components into Honeycomb. Well, the challenge was that there were no direct integration options that I could use to make HAProxy send trace data.
After some research, I discovered that it’s possible to send what HAProxy generates as log entries to the OpenTelemetry Collector via its syslog receiver. HAProxy can be configured to send those logs, and the Collector can send them to Honeycomb.
The tricky part is that I didn’t want logs—I wanted spans.
Sending logs into rsyslog server
First of all, I configured haproxy.cfg to send log messages to a remote server, which is the OpenTelemetry Collector.
global
  maxconn 256
log otel-collector:54526 local0Creating trace_id and span_id
First, I looked for a way to generate a trace id and span id that conforms to the OpenTelemetry standard. I found the following setups in haproxy.cfg file producing the transparent as unique id, which is the W3C standard that OpenTelemetry uses.
 http-request set-header X-Scheme http
  http-request set-header X-Scheme https if { ssl_fc }

  declare capture request len 512
  http-request capture req.fhdr(User-Agent) id 0
  declare capture request len 5
  http-request capture req.hdr(X-Scheme) id 1
  declare capture request len 512
  http-request capture req.hdr(Host) id 2

  http-request set-var(txn.trace_id) uuid(4),regsub(\"^([^-]{8})-([^-]{4})-([^-]{4})-([^-]{4})-([^-]{12})$\",\"\1\2\3\4\5\")
  http-request set-var(txn.parent_id) uuid(4),regsub(\"^([^-]{8})-([^-]{4})-([^-]{4})-([^-]{4})-([^-]{12})$\",\"\1\2\3\")
  unique-id-format 00-%[var(txn.trace_id)]-%[var(txn.parent_id)]-01
unique-id-header traceparentFormatting HAProxy logs as JSON
I still needed to produce the root span coming from HAProxy. The way I found was to generate the log message as JSON and send it off to the OpenTelemetry Collector to be parsed, and possibly add the trace id and span id as the attribute.
log-format "{\"appname\":\"haproxy\", \"service.name\":\"%ft\", \"trace.trace_id\":\"%[var(txn.trace_id)]\", \"trace.span_id\":\"%[var(txn.parent_id)]\", \"client_ip\":\"%ci\", \"client_port\":%cp, \"request_date_time\":\"%t\", \"frontend\":\"%ft\", \"backend\":\"%b\", \"servername\":\"%s\", \"first_byte_time\":%TR, \"queue_wait_time\":%Tw, \"server_conn_time\":%Tc, \"server_response_time\":%Tr, \"total_request_time\":%Ta, \"status_code\":%ST, \"bytes_read\":%B, \"req_method\":\"%[capture.req.method]\", \"user_agent\":\"%[capture.req.hdr(0)]\", \"req_url\":\"%[capture.req.hdr(1)]://%[capture.req.hdr(2)]%HP\", \"traceparent\":\"%ID\"}"Notice the trace.trace_id and trace.span_id in the format in this formatting.
OpenTelemetry Collector’s syslog receiver setup
The next step was to add the syslog receiver to the OpenTelemetry Collector.
receivers:
…
  syslog/waf:
    udp:
      listen_address: "0.0.0.0:54526"
protocol: rfc3164Having the protocol as rfc3164 is important. Syslog has another protocol, rfc5424, but HAproxy uses rfc3164.
Flexible operators of the OpenTelemetry Collector
I added the following OpenTelemetry operators to the syslog/waf receiver, which is crucial in properly ‘shaping’ the data to be converted into spans when it arrives into Honeycomb:
  syslog/waf:
    udp:
      listen_address: "0.0.0.0:54526"
    protocol: rfc3164
    operators:
    - type: json_parser
      parse_from: attributes.message
    - type: add
      field: attributes.meta.annotation_type
      value: trace
    - type: add
      field: attributes.span.kind
      value: server
    - type: add
      field: attributes.type
      value: server
    - type: time_parser
      parse_from: attributes.request_date_time
      layout_type: strptime
      layout: "%d/%b/%Y:%H:%M:%S.%f"
    - type: remove
      field: body
    - type: remove
field: attributes.messageThe above settings will:
- Parse the log message (which seems to be included into attributes.message when arrived from HAProxy) as JSON, then add any found attributes inside it as OpenTelemetry attributes.
- Add (or override) the attribute meta.annotation_type as trace instead of log. This is necessary to make sure the event is treated as a span.
- Add (or override) the attribute span.kind and type as server, as this span is created within the context of the server side.
- Parse the time from the log attribute request_date_time instead of the time that the log message was received. The reason being that when the log message is emitted, it does not properly represent the exact time the request was received, but rather when the log message was created.
- Lastly, remove the original log payload which resides in attributes.message and body.
OpenTelemetry exporter setup
The final phase was to set the exporter otlp/waf, which will connect to the logs/waf exporter in order to send it to Honeycomb:
exporters:
…
  otlp/waf:
    endpoint: api.honeycomb.io:443
    headers:
      x-honeycomb-team: ${env:HONEYCOMB_API_KEY}
      x-honeycomb-dataset: waf
…

service:

  pipelines:

    logs/waf:
      receivers: [syslog/waf]
      processors: [batch]
exporters: [otlp/waf]The exporter is logs instead of traces because the syslog receiver is categorized as a log type receiver, and thus will not be compatible with the trace exporter. However, when the data arrives into Honeycomb, it doesn’t matter whether the data was sent as metric, trace, or log—it will all conform to the same ‘wide event’ structure.
Let’s restart everything and see if the trace now includes HAProxy.
Voila! Now we have the WAF as part of the trace.
Step five: WEB
Let’s add the Nginx web frontend that sits between the HAproxy and Tier1 service. Fortunately, OpenTelemetry had an Nginx integration that I could use to set it up. However, I did need to add additional scripts to download the OpenTelemetry SDK for Nginx, and set it up properly for it to be loaded up as its module.
Updating the Dockerfile
Amend your dockerfile as below:
FROM docker.io/library/nginx:1.24.0

RUN apt-get update ; apt-get install unzip
ADD https://github.com/open-telemetry/opentelemetry-cpp-contrib/releases/download/webserver%2Fv1.0.4/opentelemetry-webserver-sdk-x64-linux.tgz /opt
RUN cd /opt ; unzip -o opentelemetry-webserver-sdk-x64-linux.tgz; tar xvf opentelemetry-webserver-sdk-x64-linux.tgz
RUN cd /opt/opentelemetry-webserver-sdk; ./install.sh
ENV LD_LIBRARY_PATH=$LD_LIBRARY_PATH:/opt/opentelemetry-webserver-sdk/sdk_lib/lib
COPY opentelemetry_module.conf /etc/nginx/conf.d
COPY headers.js /etc/nginx/headers.js
COPY nginx.conf /etc/nginx/nginx.confUpdating nginx.conf
Then, amend your nginx.conf file:
load_module /opt/opentelemetry-webserver-sdk/WebServerModule/Nginx/1.24.0/ngx_http_opentelemetry_module.so;
load_module modules/ngx_http_js_module.so;
events {}
http {
  include /etc/nginx/conf.d/opentelemetry_module.conf;
  js_import headers.js;
  js_set $headers_json headers.headers_json;
  log_format main '$remote_addr'
                  '\t$remote_user'
                  '\t$time_local'
                  '\t$request'
                  '\t$status'
                  '\t$headers_json';

  server {
    listen 80;
    listen [::]:80;
    server_name localhost;
    access_log /var/log/nginx/access.log main;
    error_log /var/log/nginx/error.log;

    location / {
      root /usr/share/nginx/html;
      index index.html index.htm;
    }

    location /proxy {
      proxy_pass http://tier1:8080/;
    }

    error_page 500 502 503 504 /50x.html;
    location = /50x.html {
      root /usr/share/nginx/html;
    }
  }
}I also had to add a file, opentelemetry_module.conf, which contains the exporter type and endpoint of where to send traces.
NginxModuleEnabled ON;
NginxModuleOtelSpanExporter otlp;
NginxModuleOtelExporterEndpoint otel-collector:4317;
NginxModuleServiceName web;
NginxModuleServiceNamespace web;
NginxModuleServiceInstanceId WebInstanceId;
NginxModuleResolveBackends ON;
NginxModuleTraceAsError ON;You can find out more about the configuration directives here.
Updating the OpenTelemetry Collector
Lastly, the receiver and exporter that handle traces were added to the OpenTelemetry Collector’s configuration:
…
exporters:
  logging:
    verbosity: detailed
  otlp/waf:
    endpoint: api.honeycomb.io:443
    headers:
      x-honeycomb-team: ${env:HONEYCOMB_API_KEY}
      x-honeycomb-dataset: waf
  otlp/traces:
    endpoint: api.honeycomb.io:443
    headers:
      x-honeycomb-team: ${env:HONEYCOMB_API_KEY}
  otlp/metrics:
    endpoint: api.honeycomb.io:443
    headers:
      x-honeycomb-dataset: metrics
      x-honeycomb-team: ${env:HONEYCOMB_API_KEY}

service:
  pipelines:
    logs/waf:
      receivers: [syslog/waf]
      processors: [batch]
      exporters: [otlp/waf, logging]
    traces:
      receivers: [otlp]
      processors: [batch]
      exporters: [otlp/traces, logging]
    metrics:
      receivers: [otlp, mysql, rabbitmq, hostmetrics]
      processors: [resourcedetection, batch]
exporters: [otlp/metrics]The final outcome
With the above steps, I felt like I had instrumented and set up everything I could for this application. Now, when the application is running, this is what we can see as an end-to-end trace flow of requests received from WAF → WEB → Tier1 → Cons → Tier2:

I hope you enjoyed my journey of instrumenting a demo application using various OpenTelemetry instrumentations and integrations. As you saw, there’s a rich set of strategies that you can take to make components of your application emit metrics, traces, and logs.
Honeycomb’s ability to easily consume any type of telemetry data as wide events certainly helped glue everything together.
All the work mentioned in this blog can be found on my forked branch in GitHub.
Want to try it for yourself? We offer a useful free tier with 20 million events per month. Get started today!
Acknowledgement: I’d like to throw a shout out to Gregory Spranger, Cloud Engineer II / Senior Technical Consultant at AARP, who provided me with the demo application. This blog/experiment as a whole would not have been possible without his contribution.
Want to know more?
Talk to our team to arrange a custom demo or for help finding the right plan.