Reporting CSP Errors in Honeycomb With the OpenTelemetry Collector
The HTTP Content-Security-Policy response header is used to control how the browser is allowed to load various content types. It is used to control which URLs, fonts, images, scripts, and more can be loaded…

By: Martin Holman
Honeycomb & OpenTelemetry for in-depth observability
Learn MoreThe HTTP Content-Security-Policy response header is used to control how the browser is allowed to load various content types. It is used to control which URLs, fonts, images, scripts, and more can be loaded onto the page. It’s a great defense against XSS (cross-site scripting), clickjacking, and cross-site vulnerabilities. The header can also specify a URL that will be used to send reports on violations of these properties.
Capturing these reports is valuable because it provides visibility into violations of your site’s intended security policies. These reports give you real-time feedback about attempted resource loads or script executions that were blocked by the policy, enabling faster debugging, tighter policy tuning, and enhanced protection of user data. Additionally, analyzing CSP reports can help uncover malicious activity or misconfigurations that might otherwise go unnoticed.
Receiving CSP reports with the webhookevent receiver
If you already have a Collector set up for receiving your frontend telemetry, you can start to receive CSP reports with the following configuration. First, you need to configure your CSP headers to send the reports to the Collector.
'Content-Security-Policy': "img-src 'none'; script-src 'self' 'unsafe-eval'; report-to otel-collector",
'Reporting-Endpoints': 'otel-collector="http://otel-collector.host/csp-reports"',You also need to configure the Collector to receive these reports. This involves adding a new receiver and creating a new logs pipeline to process them.
receivers:
    webhookevent/csp:
      endpoint: 0.0.0.0:8088
      read_timeout: "500ms"
      path: "/csp-reports"
service:
  pipelines:
    logs/csp:
      receivers: [webhookevent/csp]
      processors: [batch]
exporters: [otlp]This gives you access to all of the information in your CSP reports.
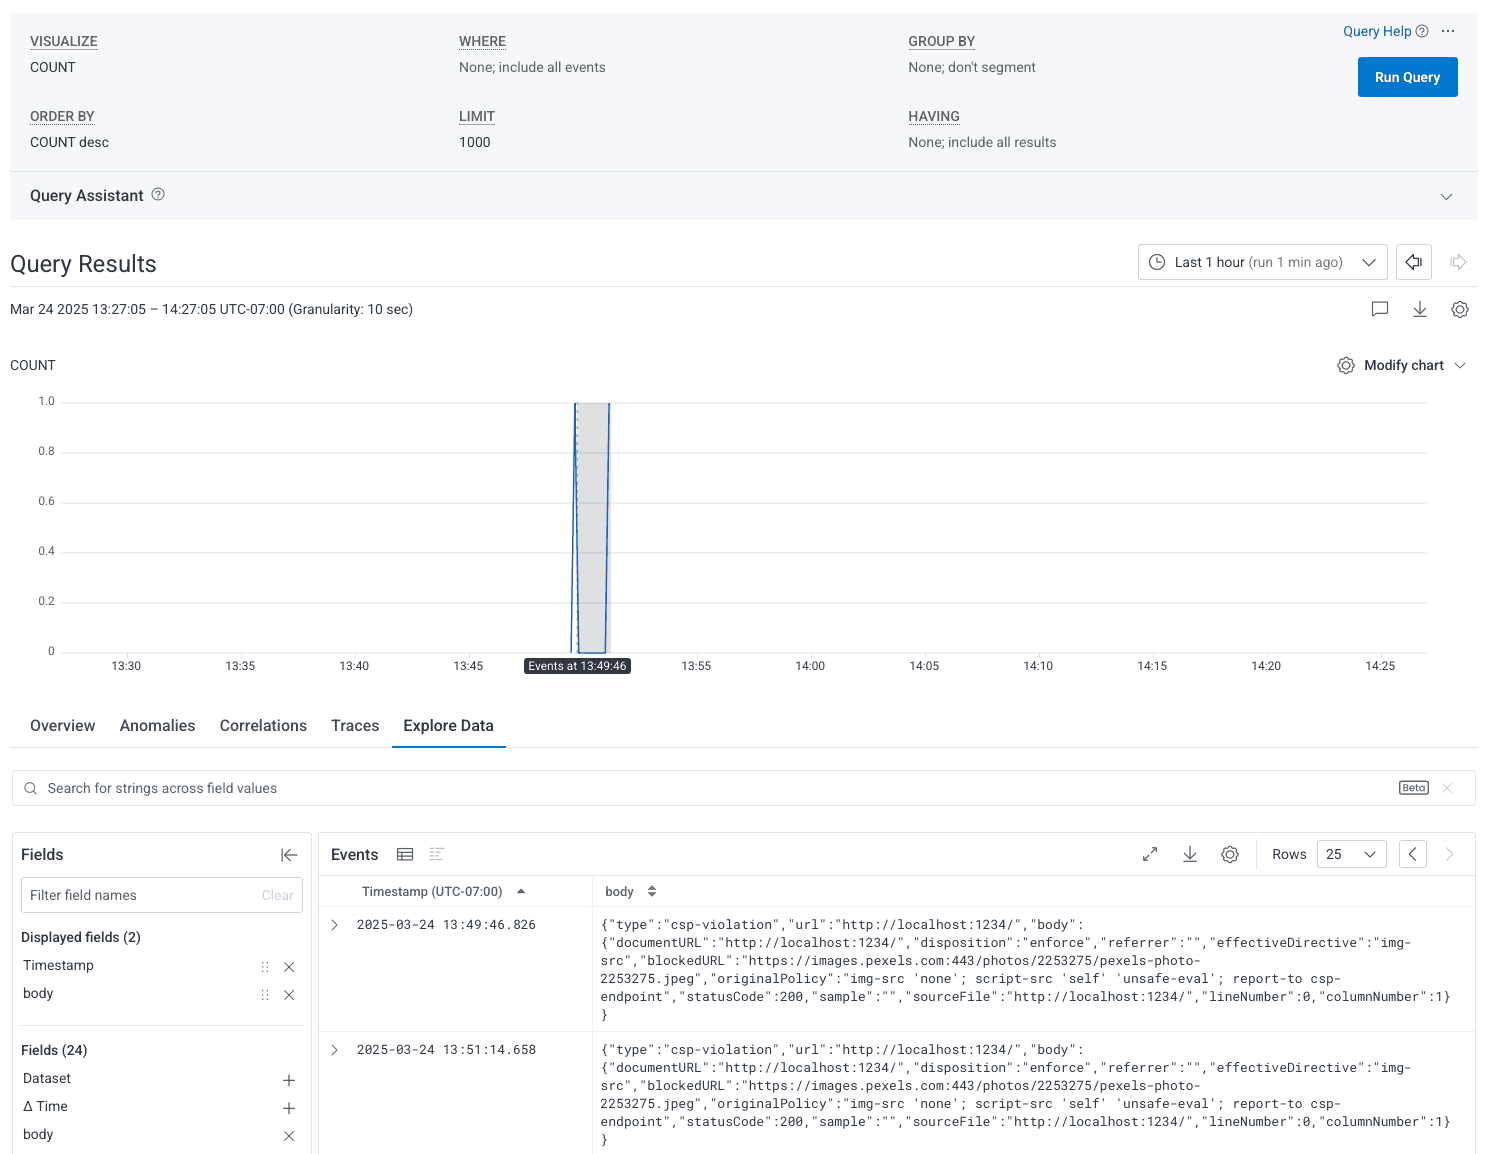
Enhancing our CSP report data with the transform processor
This is a great start, but let’s make it even better. The CSP report is a JSON blob and it would be great to query over this data in a more natural manner. Enter the transform processor.
With a few extra lines in your Collector configuration, you can make this data much better. Add the transform processor and plug it into the CSP pipeline that you create above.
processors:
  transform/csp:
    log_statements:
      - statements:
        - merge_maps(log.attributes, ParseJSON(log.body), "upsert")
service:
  pipelines:
    logs/csp:
      receivers: [webhookevent]
      processors: [batch, transform/csp]
exporters: [otlp]Now, you can slice and dice your CSP report data more easily!
Continuous improvements
In this short blog post, you learned how to report CSP errors in Honeycomb thanks to the wonderful transform processor and the Collector. If you’d like to learn more about OpenTelemetry, download Austin Parker’s free whitepaper: The Director’s Guide to Observability: Leveraging OpenTelemetry in Complex Systems.
Martin Thwaites also wrote a great series on OpenTelemetry best practices that you can access here:
OpenTelemetry Best Practices #1: Naming
OpenTelemetry Best Practices #2: Agents, Sidecars, Collectors, Coded Instrumentation
OpenTelemetry Best Practices #3: Data Prep and Cleansing
Happy learning!
Want to know more?
Talk to our team to arrange a custom demo or for help finding the right plan.