“You Had One Job”: Why Twenty Years of DevOps Has Failed to Do it
I think the entire DevOps movement was a mighty, twenty year battle to achieve one thing: a single feedback loop connecting devs with prod. On those grounds, it failed.

By: Charity Majors

Let’s start with a question. What is DevOps all about?
- Empathy!
- Breaking down silos!
- Forcing operations engineers to write more software!
I’ll tell you my answer. In retrospect, I think the entire DevOps movement was a mighty, twenty year battle to achieve one thing: a single feedback loop connecting devs with prod.
On those grounds, it failed.
Not because software engineers weren’t good at their jobs, or didn’t care enough. It failed because the technology wasn’t good enough. The tools we gave them weren’t designed for this, so using them could easily double, triple, or quadruple the time it took to do their job: writing business logic.
This isn’t true everywhere. Please keep in mind that all data tools are effectively fungible if you can assume an infinite amount of time, money, and engineering skill. You can run production off an Excel spreadsheet if you have to, and some SREs have done so. That doesn’t make it a great solution, the right use of resources, or accessible to the median engineering org.
Read our O’Reilly book, Observability Engineering
Get your free copy and learn the foundations of observability,
right from the experts.
Good news and bad news
The good news is that AI has changed this. The technology we have now is good enough to create a feedback loop between developers and production systems for the median engineering team, for the first time ever.
The bad news is also that AI has changed this. Our existing feedback loops are unprepared to deal with the current amount of code slop. And I think we all know what the volume of code slop is about to do:
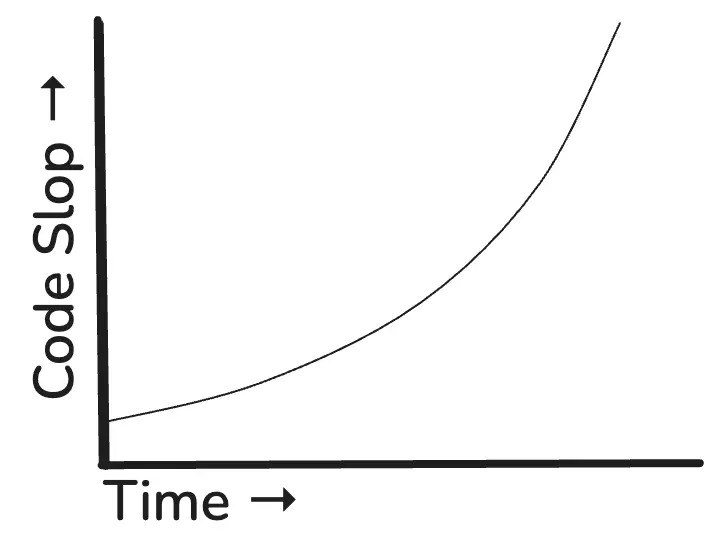
(Oh yeah, guess what I learned to do over the break? STICK ART, baby doll.)
I know this is a big, spicy claim. And since I got as pissed off as anyone when vendors were posting clickbait about “DEVOPS IS DEAD,” I’m going to back up and show you my argument from scratch. I’m not saying this in an accusatory, inflammatory kind of way. The truth is, we were all sensing and circling around the same problem, and it was the right one. We did the best we could with the tools that we had.
Value-generating feedback loops
If your business makes money by building products with software, this is what progress looks like: you build something new, ship it to users, and see what happens.
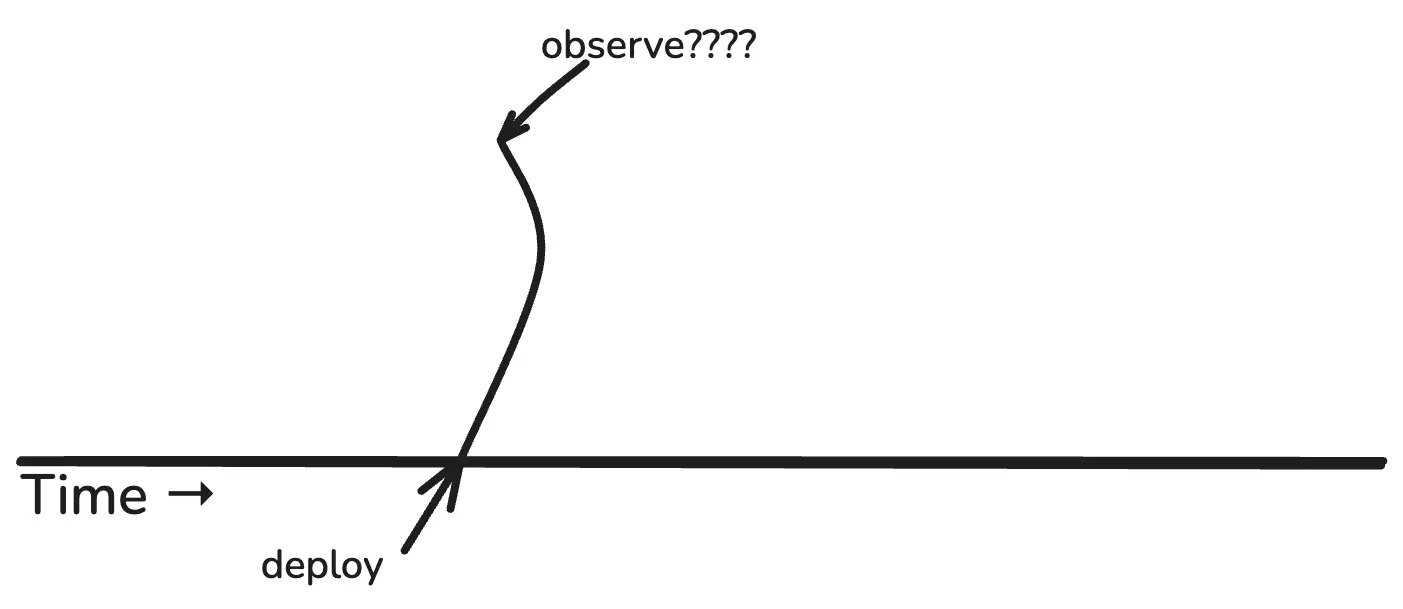
This is the theoretical feedback loop of generating business value with software. As our friends at Intercom like to say, “shipping is your company’s heartbeat.” The value-generating loop gets kicked off every time you deploy a new diff. In stick art, it looks like this: deploy -> observe -> learn.
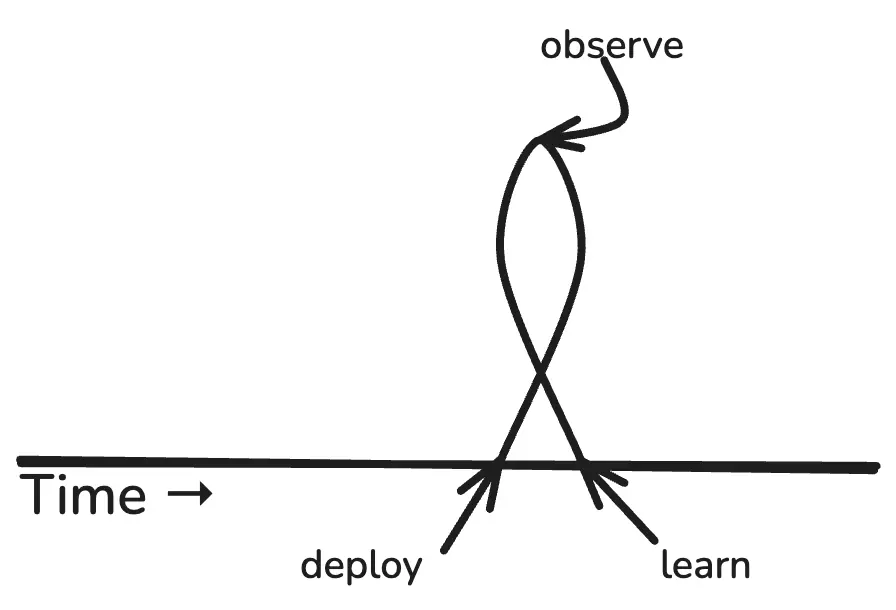
“Build” isn’t shown because it doesn’t count. Value does not get captured until the code has been deployed. That’s one of the reasons why software experts are always haranguing us to ship frequently. Like this:
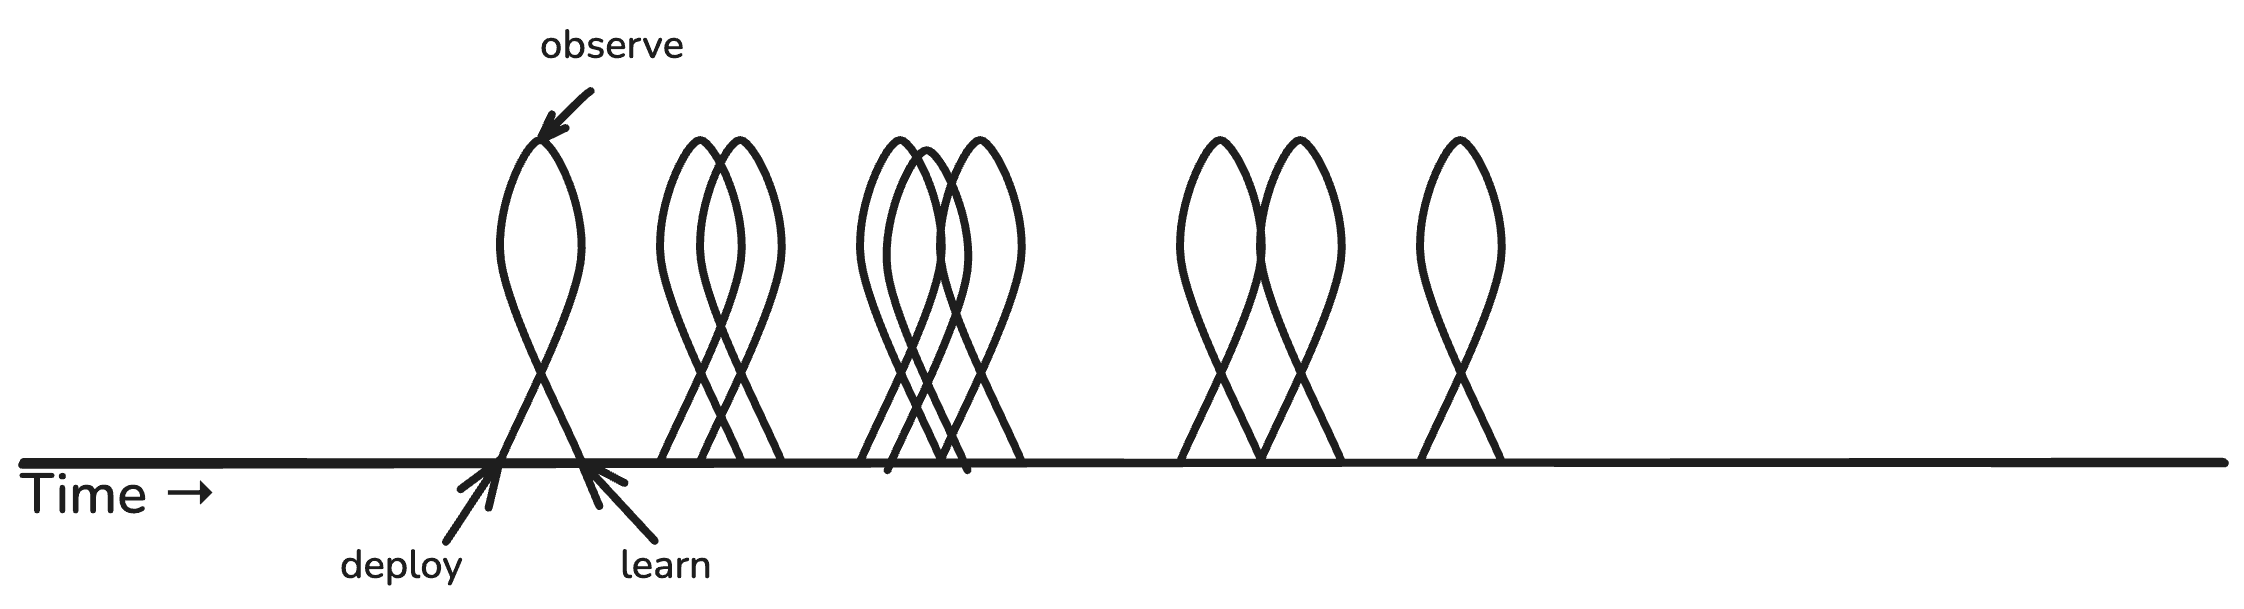
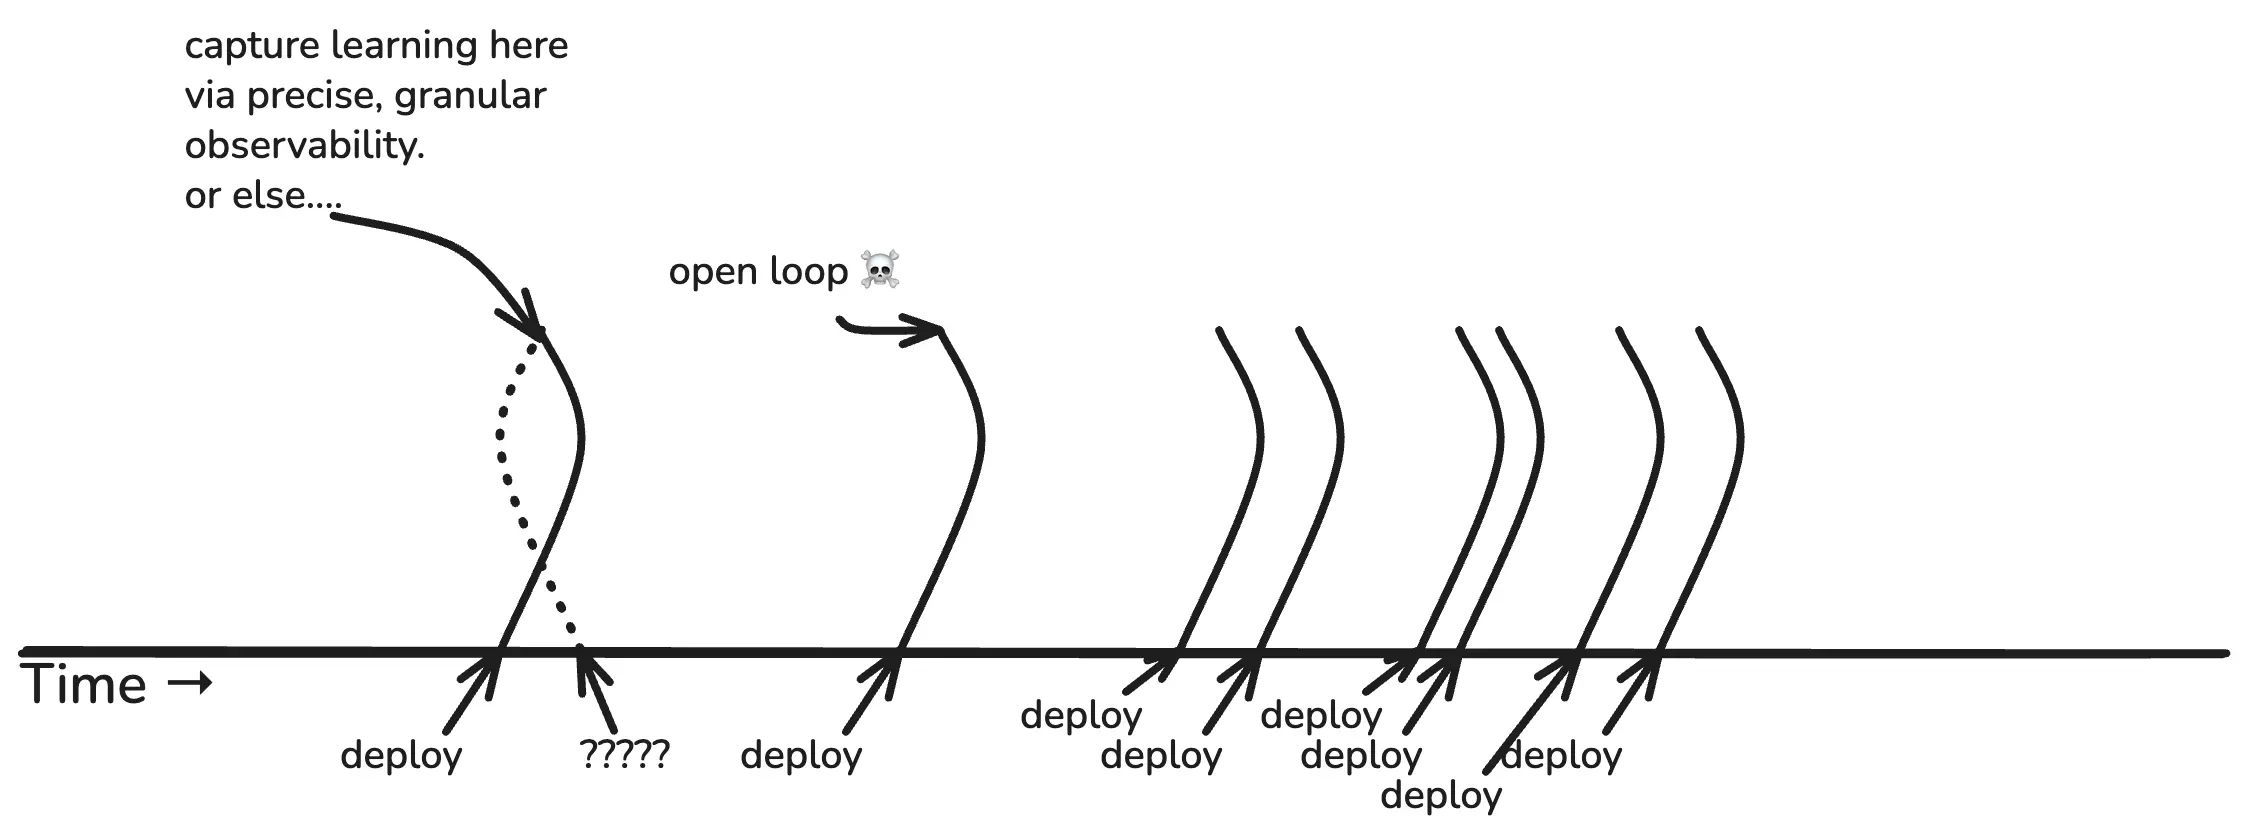
Or even…
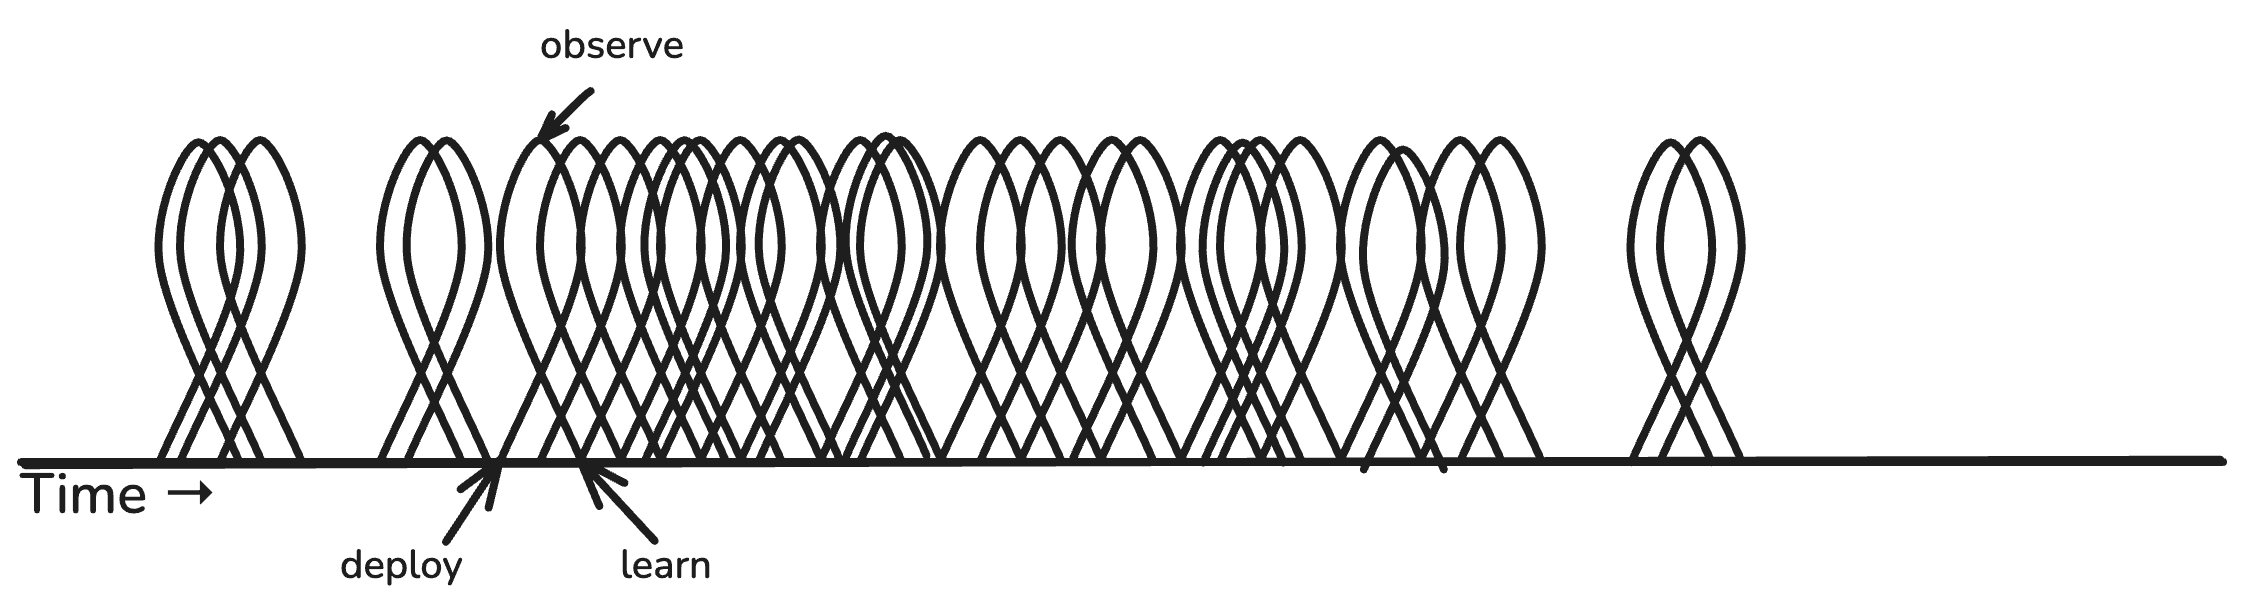
(Look at all that learning! 😍)
Every deploy is a chance to learn something new about your product, your system, your users, your feature, etc. But what if you deploy new code and don’t observe?
If you don’t observe, you don’t learn anything. Your deploy becomes an open loop. You are shipping blind.
This is what observability does, by the way. It’s the sense mechanism that enables all your other feedback loops to function. It’s the information channel that connects the dots and closes the loops.
Now, let’s move from the theoretical loops of value generation to the actual feedback loops people are using today to develop new software and operate the software they already have.
Actual developer feedback loops
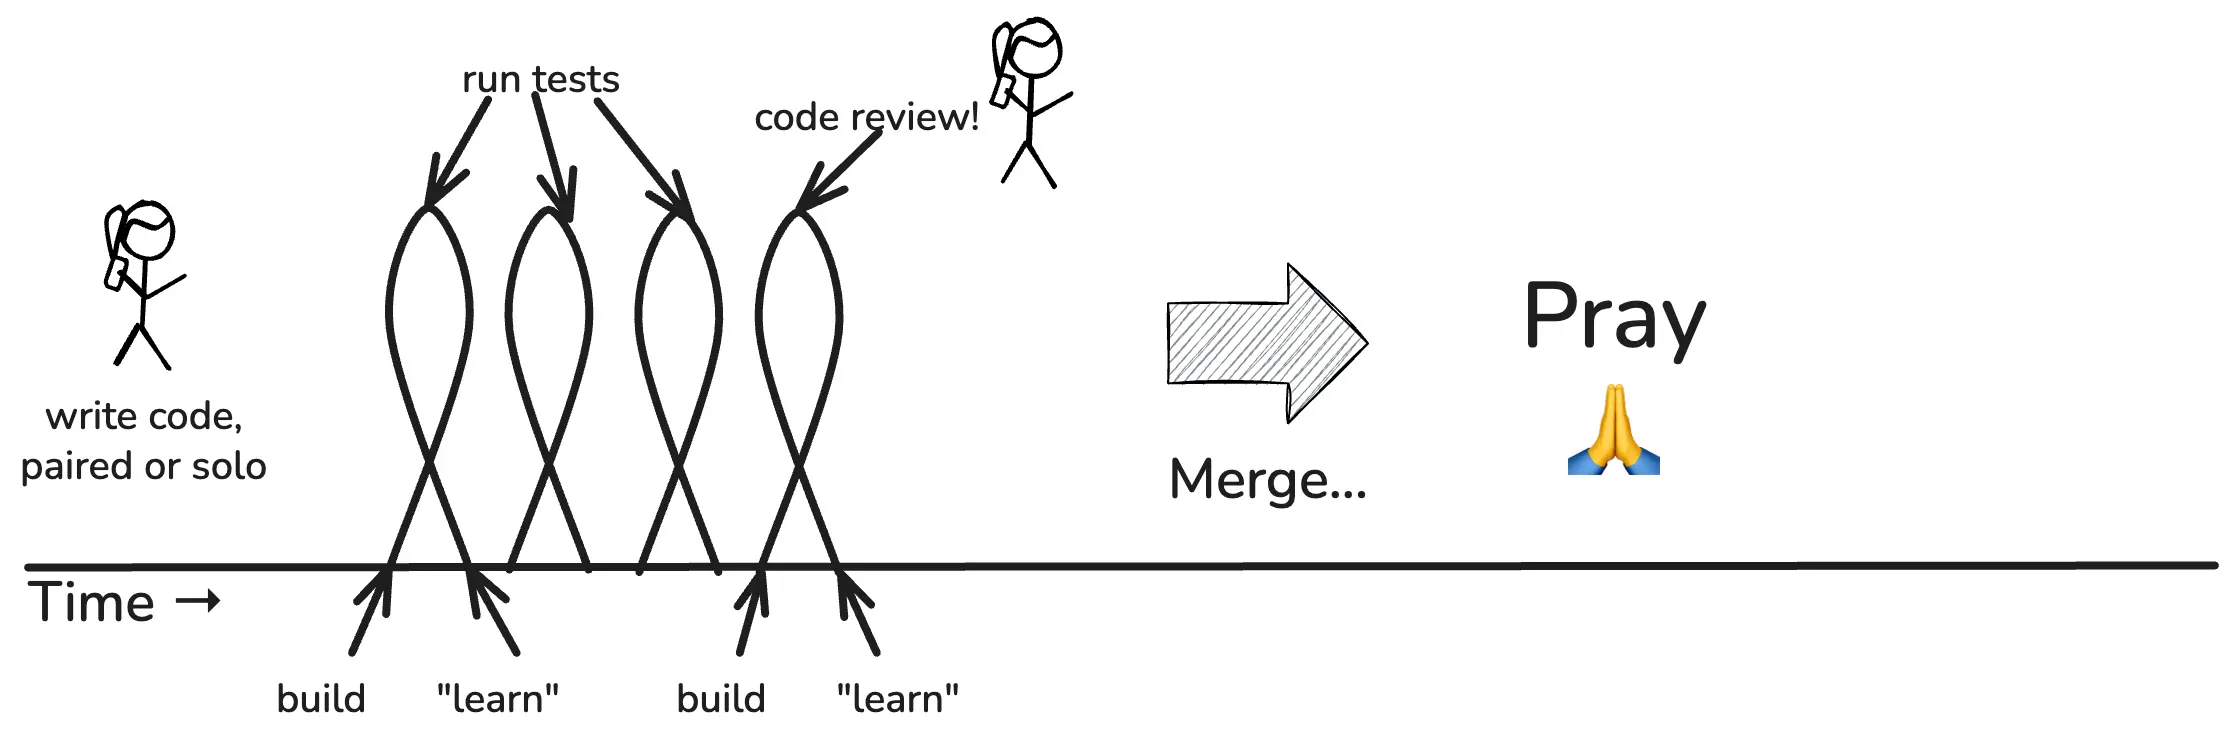
Software developers typically spend most of the day in their development environment. They build stuff, they run tests, they build more stuff, they run more tests. (Or they conduct lengthy, increasingly intimate conversations with Cursor or Claude about how agents should do these things on their behalf, but for simplicity’s sake, let’s use the classical terms.)
Build-> test -> learn, build -> test -> learn. These are the actual feedback loops that drive a developer’s daily labor. When we’re ready to merge, we may get code review first.
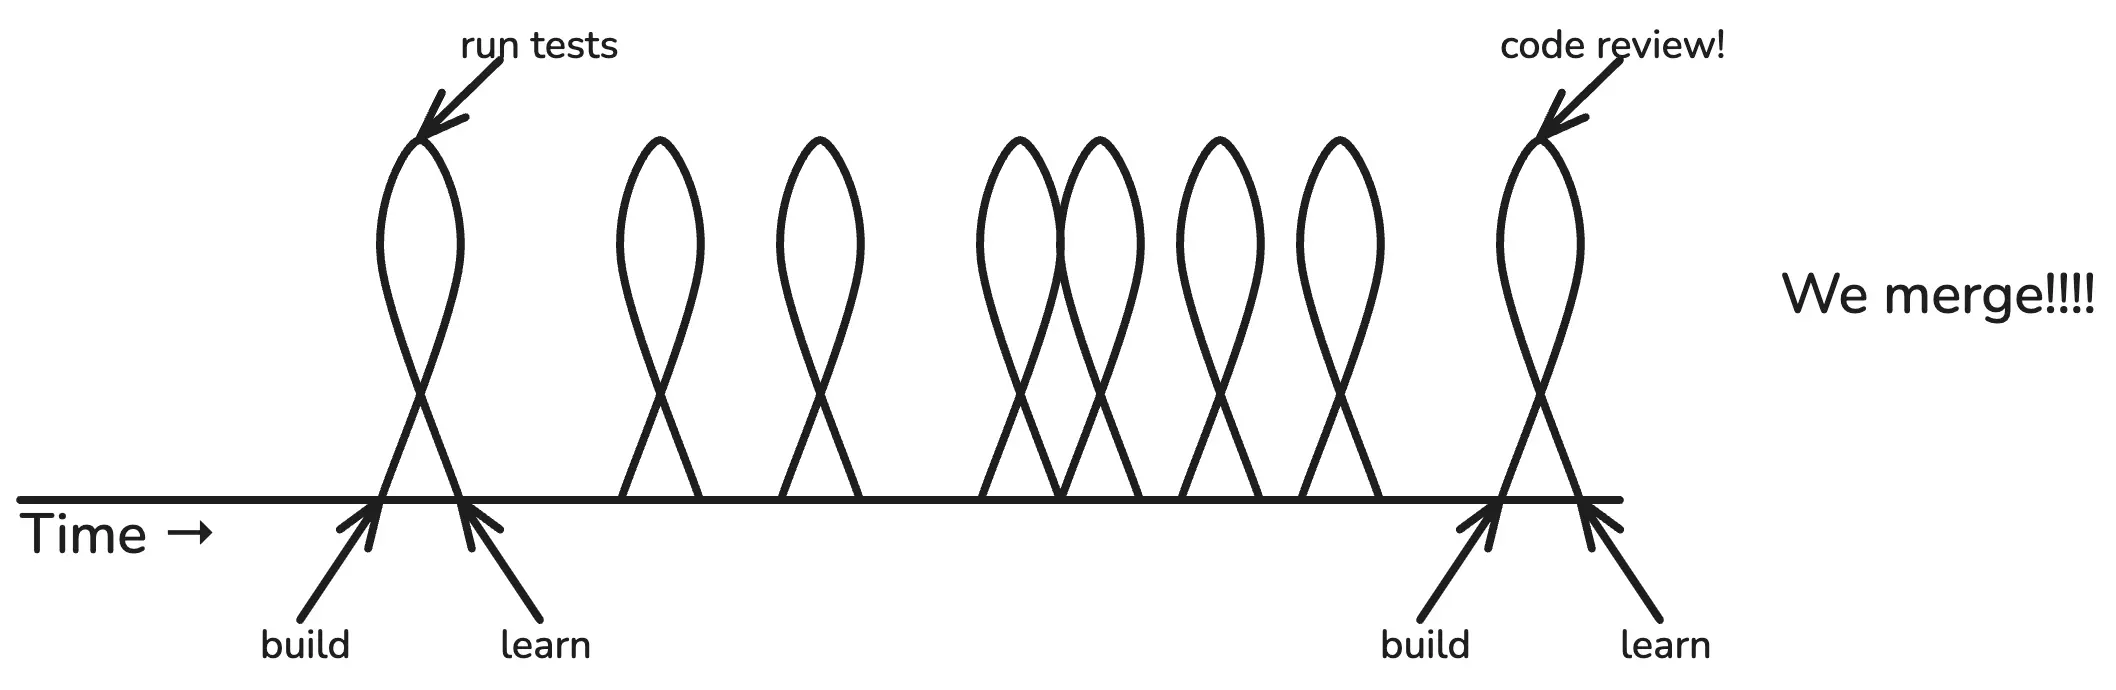
If all tests pass, and our buddy approves, we merge! Joyous day. On to the next unit of work.
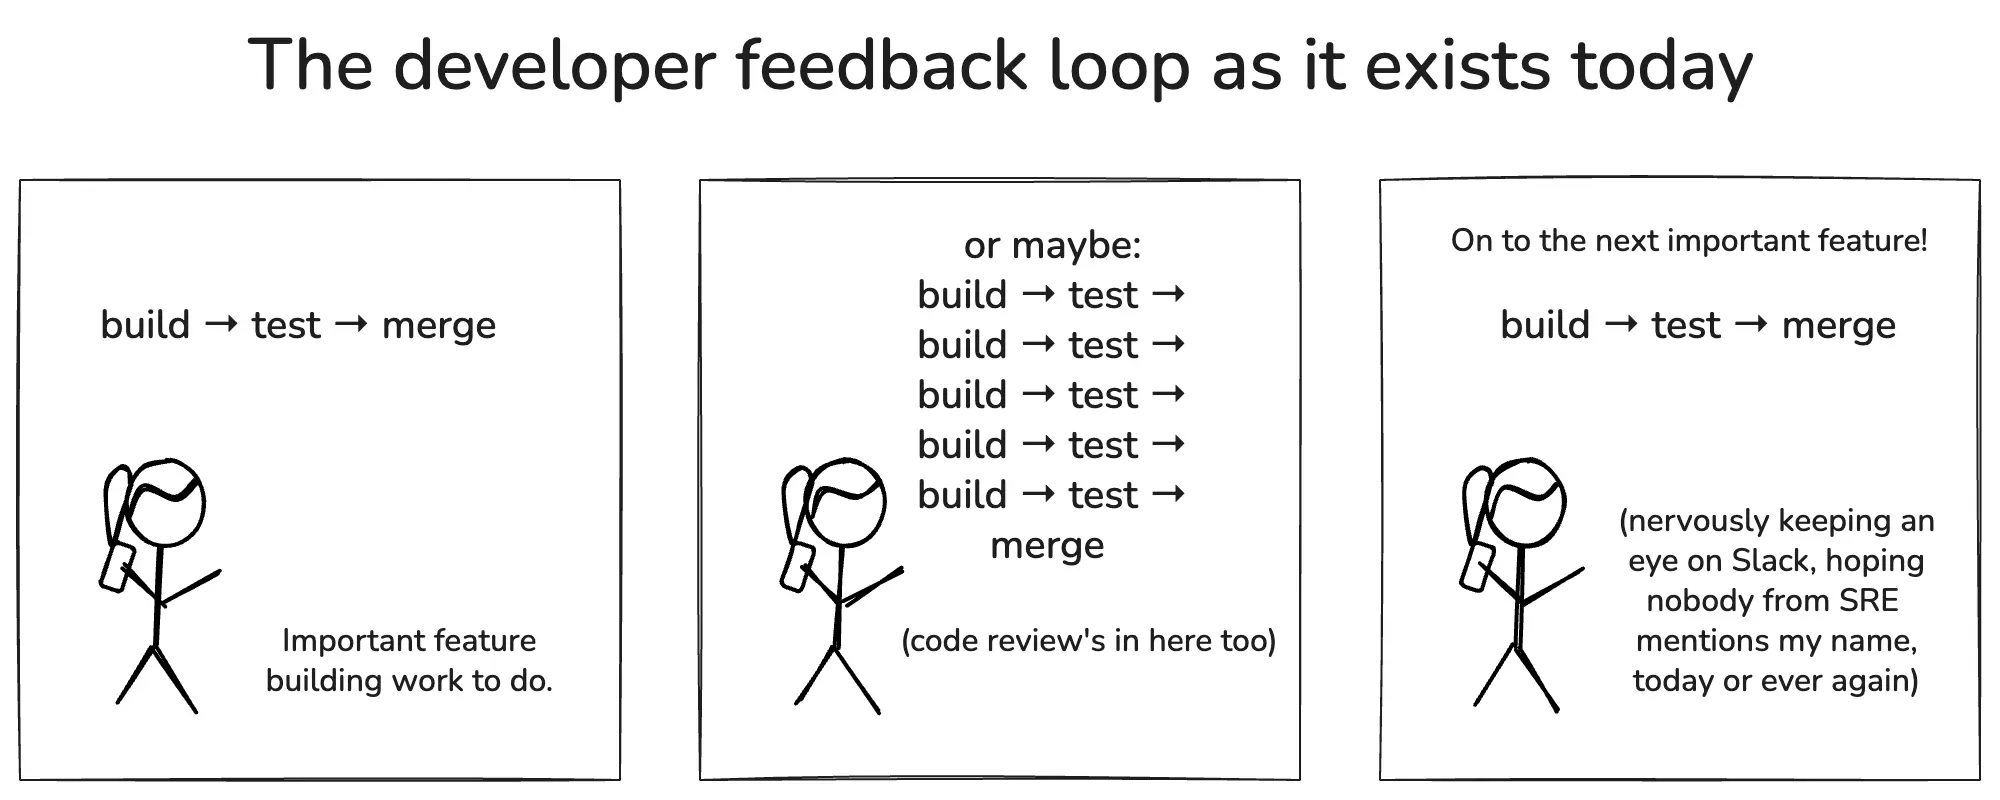
What did we “learn” by running tests? We learned that our tests pass. That’s all.
Tests are great, but from the business perspective, we don’t learn anything new by running tests. All of this work is important, but you don’t learn anything. You can’t learn anything until you deploy to production. Hold that thought.
Next, let’s look at the feedback loops involving production.
Actual production feedback loops
Most developers don’t interact with production on a daily basis, unless they’re hunting down a bug or something. Guess who does? Your operations crew—or as they are more likely to be called, cloud engineering, infrastructure, SREs, DevOps, or platform engineering.
Whatever you call them, somebody has to deal with operational feedback loops. They are the last line of defense for your system in the face of perpetual threats. In soccer terms, they are the goalie.
Operational feedback loops get kicked off any time someone gets paged (or a customer complains loudly enough to trigger an escalation). Day or night, rain or shine, someone hops on to production to investigate, triage, and fix the problem.
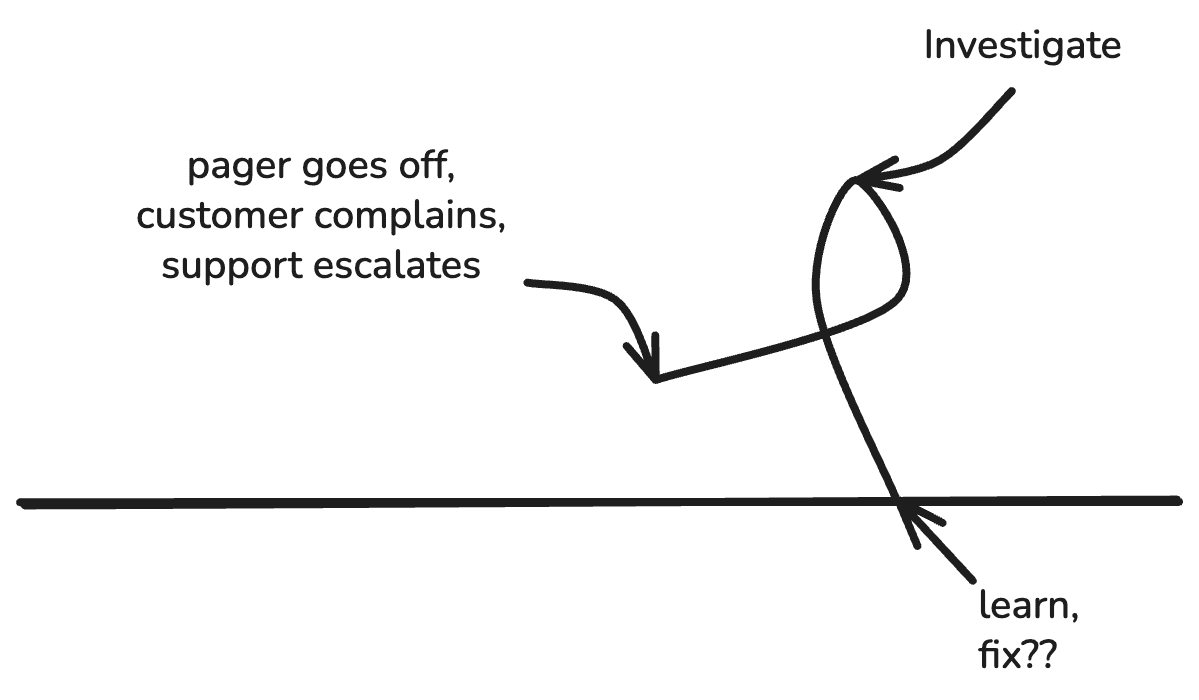
Operational feedback loops are always reactive. Sometimes you can tell what just changed (deploy? migration?), but often, you cannot. An unusual traffic pattern, a new client version, a database bug, a bug from two years ago just reached a tipping point… the possibilities are endless.
It might look more like this:
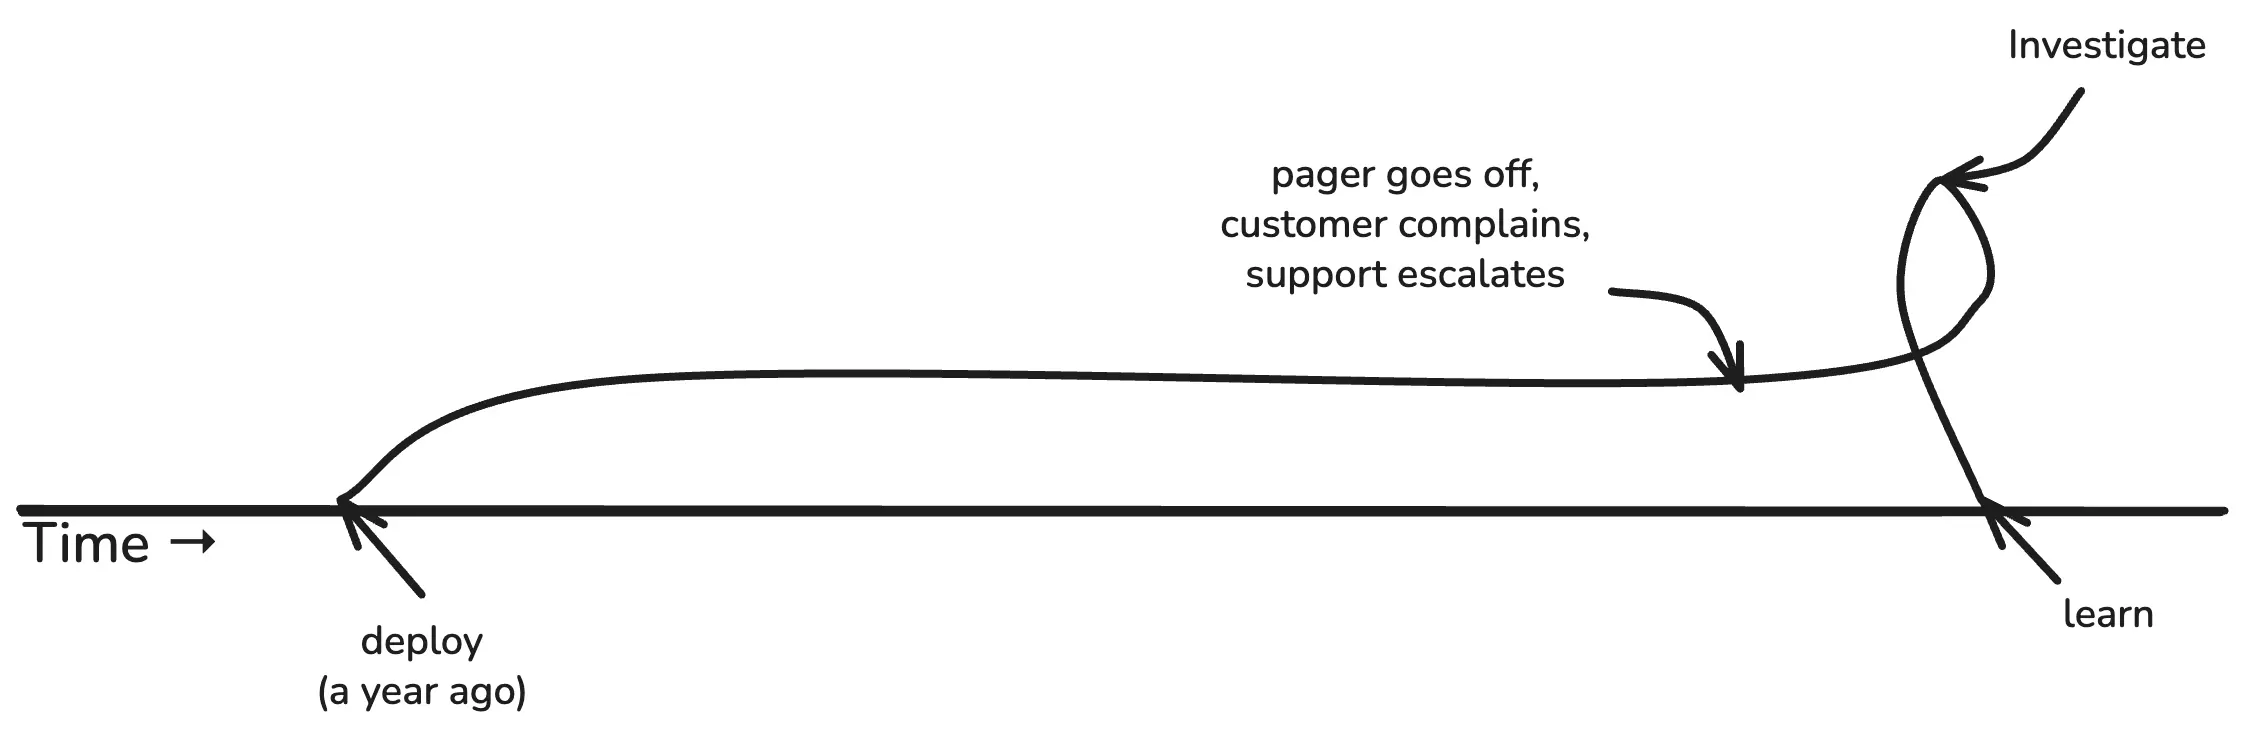
Or this:
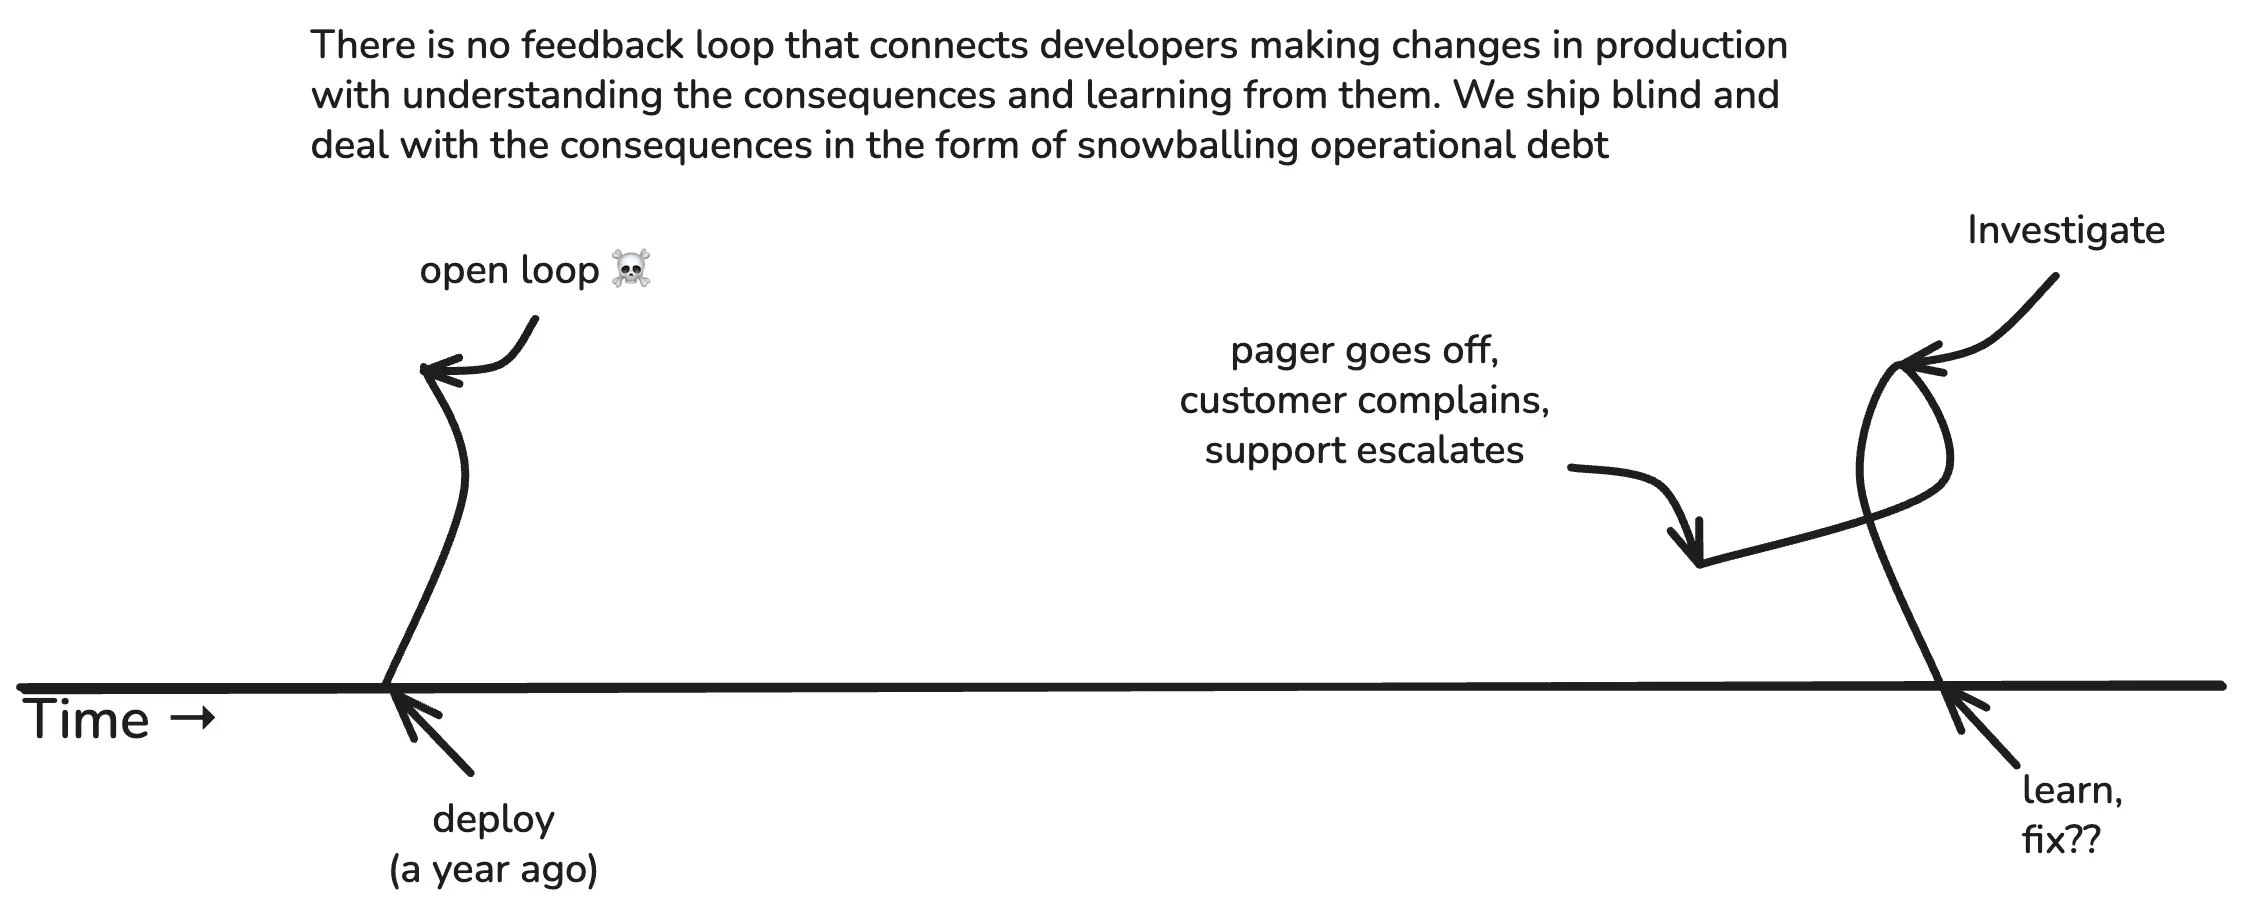
The dirty little secret of infrastructure is how often things happen that we just don’t understand. Some of it can perhaps be handwaved away as emergent properties of complex systems, but a great deal more of it is due to how long, laggy, and lossy these feedback loops are.
Both of these feedback loops are vital
This might be a good time for me to pause and underline that both feedback loops are necessary. One is not better than the other one. We need both. As Stephen Jay Gould might say, these are non-overlapping magisteria. (Uh, except actually they do overlap, a lot.)
I want to be super clear on this point, because in this industry we have a tendency to throw rocks at each other and be like, “why are you stupid?”
“Stupid ops people, why don’t you just alert any time something changes in production, so we can learn from it?”
“Stupid developers, why don’t you just LOOK at your graphs after every deploy?”
I actually feel pretty bad about this, because I think I’ve been a key driver of the latter narrative. I’ve lost track of how many times I’ve told people to “put your developers on call!” to make them pay more attention to production. Mind you, I’m not necessarily saying this is a bad idea, nor is it necessarily a good idea. I’m saying that it doesn’t solve the problem.
Ops and dev have different perspectives
The problem is that these are different domains, and they have fundamentally different perspectives. This doesn’t necessarily mean they need different tools (recall what I said about all data tools being fungible), but they are worth considering with equal weight.
The ops perspective
Here we have the basic ops/dev contract, in its simplest form. Ops (or platform, or whatever) provides a place for devs to run their code, their queries, etc. Devs write the code that runs on it.
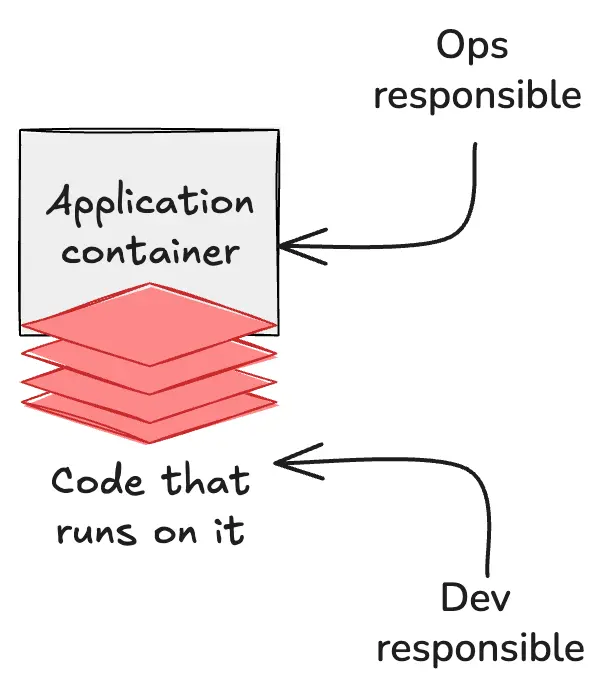
If we zoom out a little and simplify by a factor of ten million or so, it looks like this. The ops/platform/SRE mandate is to provide a stable, reliable place for lines of code to execute.
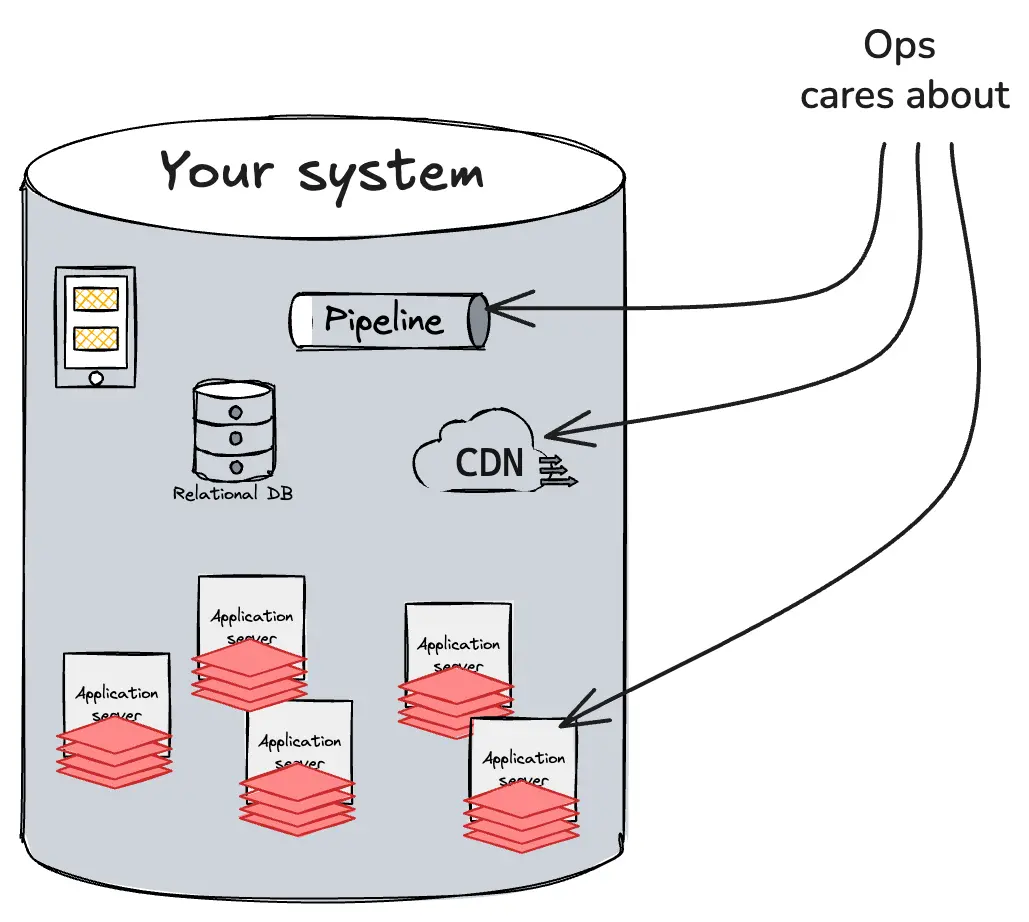
To do this, they collect a lot of telemetry from the perspective of the system and each of its constituent parts: disks, pods, network devices, databases, and so on. Most of this is third-party code, so you can’t change it; you just have to swallow whatever metrics or logs they sent you.
The dev perspective
What the devs care about is the ability to understand the product experience from the perspective of each customer. In practice, this can mean any combination or permutation of agent, user, mobile device type, laptop, desktop, point of sale device, and so on.
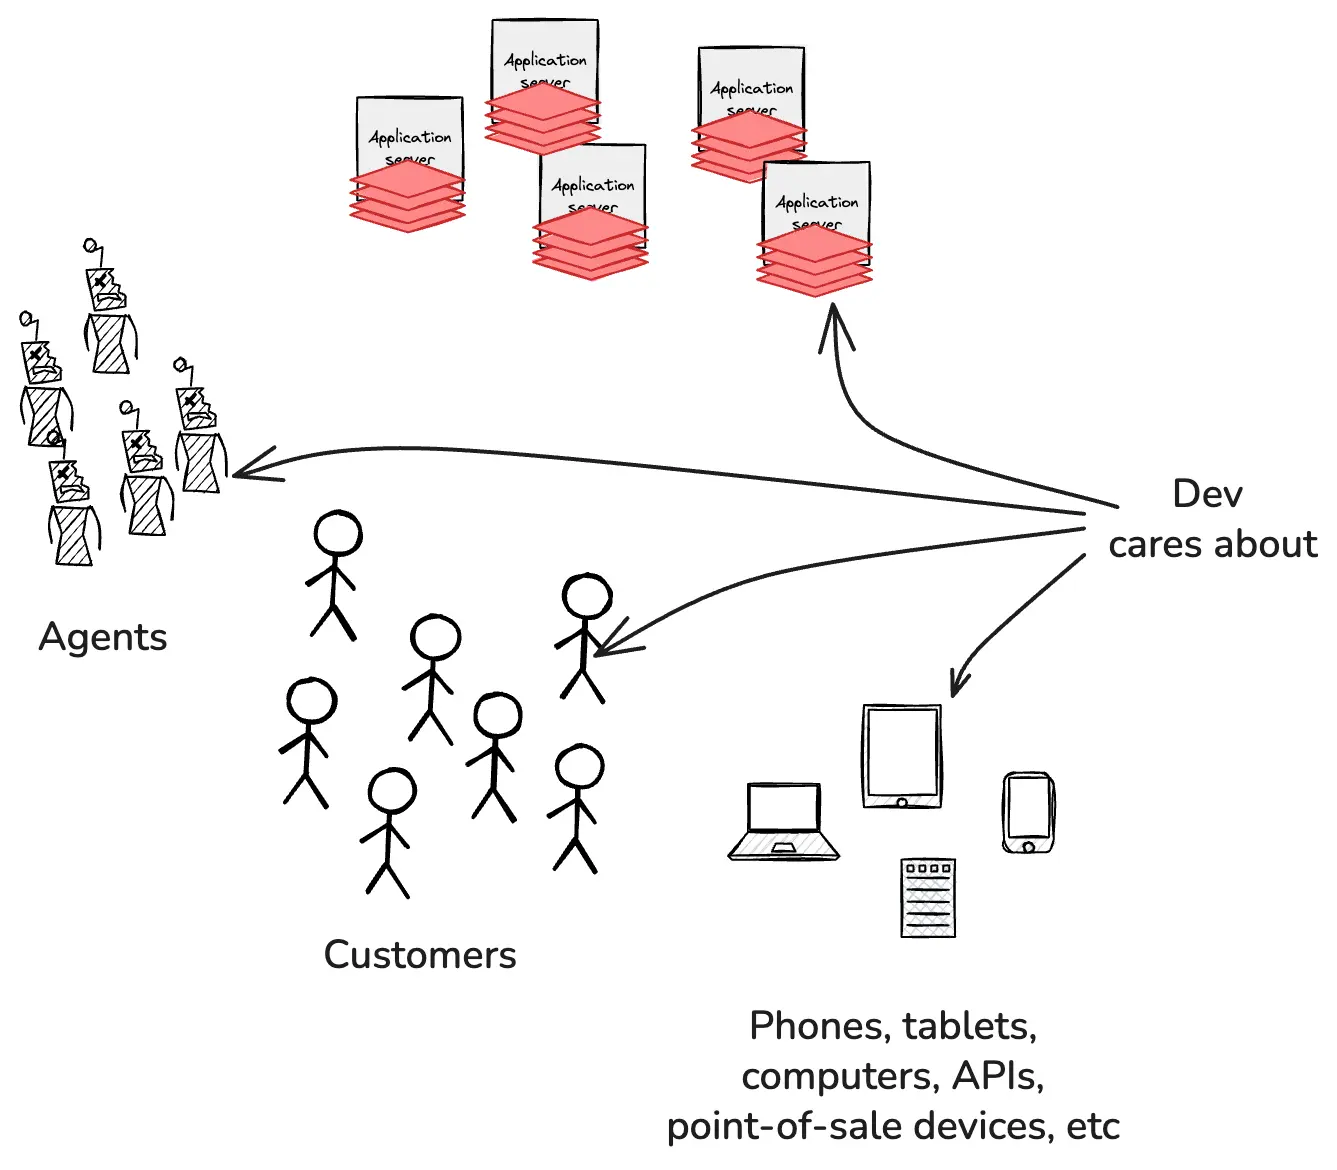
They also need to be able to slice and dice and combine this with any combination of build IDs, commit tags, feature flags, container pods, and anything else being collected by the application telemetry.
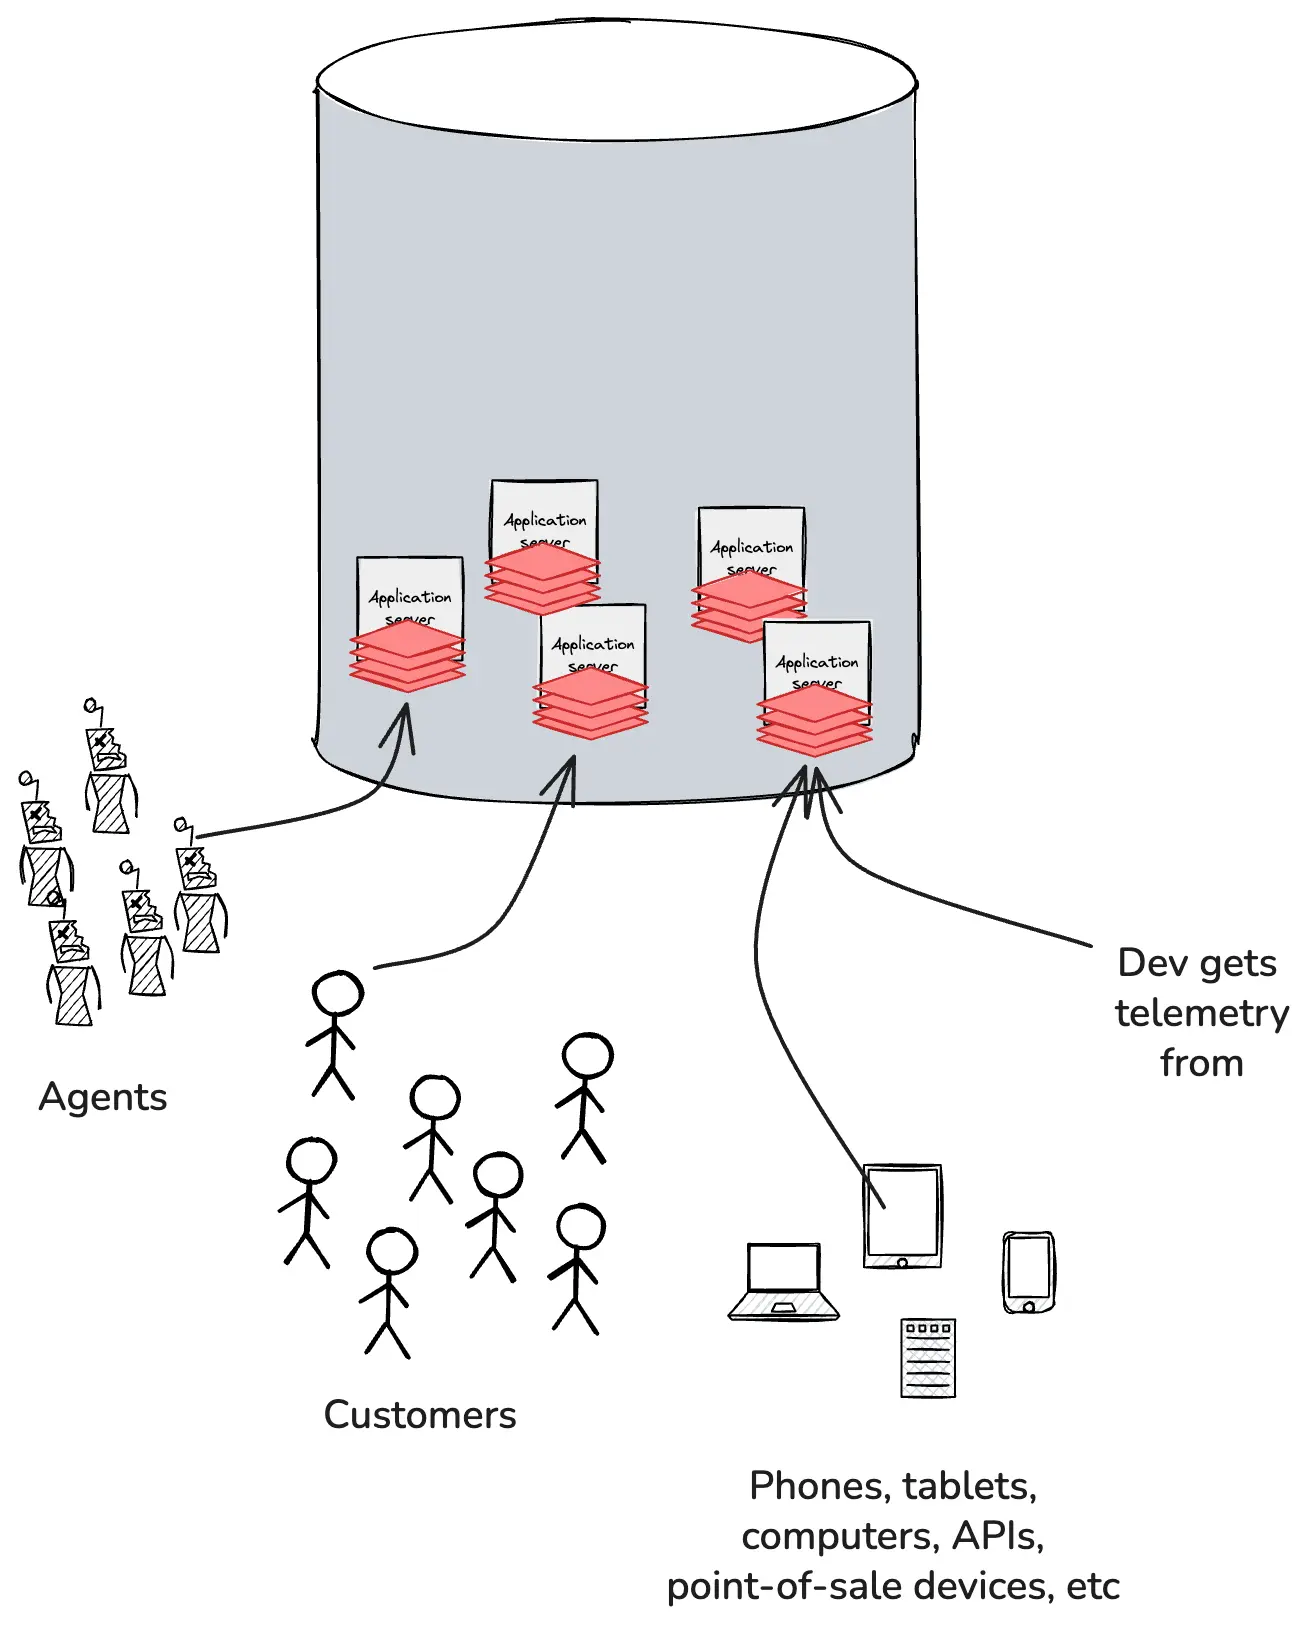
Devs can’t physically access every phone, laptop, and point of sale device in the world. But if they use the right tools, they can stream that telemetry back to the application in a format that preserves their ability to explore and ask open-ended, exploratory questions from the system side.
Ops and dev have different concerns
Ops and dev also have different concerns.
Operational feedback loops exist to guard the system and its components against catastrophic threats. If it isn’t failing, broken, buggy, slow, etc., ops mostly don’t care; not their domain.
Devs, on the other hand, very much do care about things beyond bugs and catastrophes. The developer’s job is to create new value for the business. Build products, implement features, run experiments. Try something new, see if users run with it.
Think of it this way. Ops is the building inspector, dev is the architect. The inspector only shows up to look for code violations, structural problems, safety hazards. The architect spends most of their time imagining what could be built, how people might use the space, what will delight them. They both care about safety, but the inspector’s entire job is about managing risk while the architect’s job is possibility.
“How do I get my developers to go look at it?”
I spent some time chatting with folks at LDX Berlin last November. It struck me afterwards that over half of the questions I heard—from staff+ engineers, directors, and execs—were some variation on a single theme: “But how do I get my developers to go look at it?” [their dashboards].
This might be the first time I ever truly thought through just how frustrating and confusing this has been for developers, from start to finish.
Instrumenting your code using ops tools: not easy
Think about it. You and your buddy Claude are building a new checkout feature together, and you want to capture a few valuable bits of telemetry, let’s say user_name and order_total. Where do they go?
- Should these go in metrics?
- Should they go in logs?
- Should they be part of a trace? A span?
- What if you want to see it alongside errors when checkout fails?
- What about profiling data when checkout is slow?
Buckle in, we are just getting started. If it’s a metric, should it be a:
- Counter?
- Gauge?
- Histogram?
- Summary?
- Rate?
- Distribution?
If it’s a counter, when does it reset? If it’s a histogram or a summary, what are the bucket boundaries? Do I need to tag anything? Does cardinality matter, for the data and/or the tags? Am I supposed to worry about cost? Is there a naming convention?
Let’s say you figure out the metric part. Now, do they also need to go into logs or traces? All of the signal types? Should I append them to an existing log line (which one?), or make a new one? Do they need indexes? Can I index them? Is there a schema?
We could keep asking questions for another five pages or so. I don’t know that I ever truly considered just how much domain knowledge we presume when we tell developers to do this. All that time, fear and decision fatigue… it adds up.
At least it’s a one time expense and then you have it, right? In the end, it’s all worth it?
Ah. Right. About that…
Finding your telemetry using ops tools: also not easy
To look at your new instrumentation, you probably just need to wait for your code to get deployed, then find the right tool (or tools) for the telemetry you added, and create a new dashboard using those attributes. I’m going to fast forward through all this because it’s extremely vendor-specific and the specifics don’t matter much.
I want to get back to the question people were asking me in Berlin: how do you get your developers to go look at their telemetry?
The answer is: you don’t.
We have the technology now. We bring the telemetry to them.
Bring the telemetry to developers
No matter how much time we have spent yelling at them over the years, most developers really don’t want to leave their development environment (for anything other than Slack).
What if they were right all along?
Here, watch this demo. It’s only 3:37 long, and it shows Jessitron demoing some of the AI capabilities we released last September. Jump ahead to 2:21 if you’re impatient and want to see it in your development environment.
As it turns out, chat is kind of the perfect interface for interrogating your software and finding out how it’s doing in production.
Bring them telemetry they can use
The cognitive overhead of three pillars instrumentation is one reason we historically struggled to get developers to use ops tools. The other is simpler: the tools weren’t worth it.
Imagine you did everything ops was asking you to do—you doubled, tripled the time it took you to ship your business logic in order to get the right instrumentation included. You shipped your changes, then went to explore what impact your changes were having on how users experienced the product. And finally, after all the wrestling, and waiting, and clicking around, you got…aggregates? Histograms? Fucking buckets?
If you’re trying to use tools to ask exploratory, open-ended questions about the quality of your product as experienced by your users, you are squarely in “running production off an Excel spreadsheet” territory.
AI has changed the instrumentation game
In the past, instrumentation was laborious and required expertise in multiple domains, while auto-instrumentation generally alternated between sucking by doing too much and sucking by doing too little.
OpenTelemetry changed things by standardizing the way we instrument code, making instrumentation patterns consistent and well-documented, with a massive corpus of examples. LLMs have been trained on these, so they can follow instructions on how to implement it or add it to software projects.
The cost of instrumentation has effectively fallen to zero, and AI models and agents are able to understand important patterns in your code and generalize from the patterns they know how to instrument.
AI has changed the analysis game
And if your agentic harness can run your code in dev, inspect the output, verify that it’s working as expected, etc., then by the time you’re ready to merge your changes to production, you’ve already validated that the instrumentation can explain itself back to you from production.
Automatic, end-to-end feedback loops are the key. Instead of spending hours poring through traces, looking for outliers and suspicious symptoms… let your little buddy do that. Instead of putting your IDE on the left side of the screen, and a long, detailed trace on the right side of the screen, and stepping line by line, span by span through the trace… let your buddy do that, too.
It is not impossible to get what you need out of ops tools and legacy models. Plenty of engineers and teams have done so. That doesn’t make it a great solution, the right use of resources, or accessible to the median engineering org.
AI has changed the need for validation
The shape of the future is becoming clear. Developers will spend less time writing lines of code, and more time writing specs, thinking about the problem space, running experiments, and validating what they’ve built.
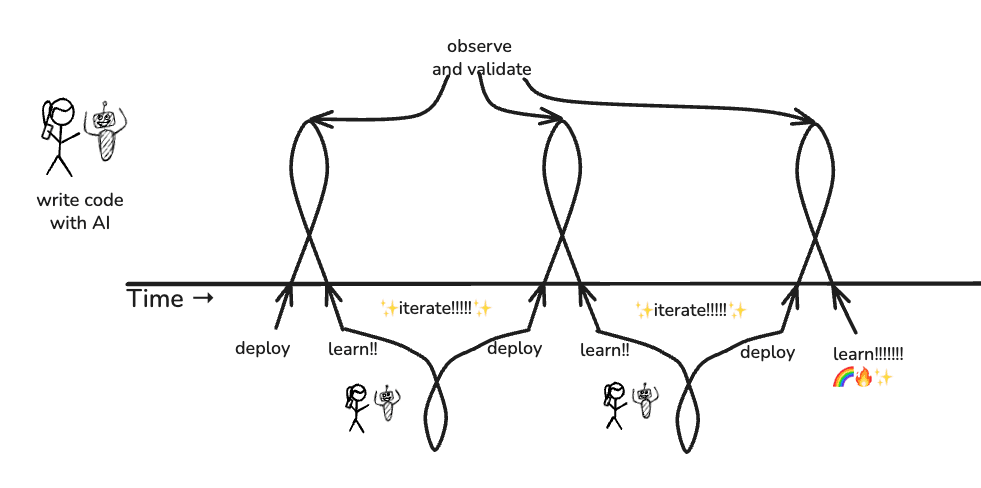
Instead of: write code -> test -> code review -> merge -> “hope it works!”
It becomes: write code (with AI) -> deploy -> observe and validate -> learn -> iterate.
See what happens? You are literally feeding what you learned from each change right back into the product in your next change. Shipping swiftly, with confidence, at the speed of AI.
The bottleneck shifts from, “How fast can I write code?” to, “How fast can I understand what’s happening and make good decisions about it?”
If AI makes code writing nearly free, then the ability to understand and validate what that code does in production becomes the primary constraint.
Engineers become more like scientists running experiments and interpreting results, less like typists translating specifications into syntax.
The freight train barrelling down the tracks at us
All this is tremendously exciting and great fun.
What’s mildly terrifying is that most companies, to this day, do all of their learning and observing about production via long, lossy, laggy operational feedback loops.
And most orgs are used to responding to a daytime alert by calling out, “Who just shipped that change?” assuming that whoever merged the diff surely understands how it works and can fix it post-haste.
What happens when nobody wrote the code you just deployed, and nobody really understands it?
I guess we’ll (all) find out. 😉
DevOps isn’t dead
The DevOps movement isn’t “dead.” It did an enormous amount of good in the world. It broke down silos, preached the value of empathy and collaboration, and reduced a ton of toil.
In retrospect, I’ve come to think that the entire effort was about trying to connect developers with the consequences of their code in production. We did not succeed, but it was hardly for lack of trying. We did the best we could with the tools we had.
And now we can do better.
Read our O’Reilly book, Observability Engineering
Get your free copy and learn the foundations of observability,
right from the experts.