How Honeycomb Uses Honeycomb, Part 1: The Long Tail
By Christine Yen | Last modified on April 15, 2022This post is the first in our series of “dogfooding” posts.
At Honeycomb, we dogfood everything: we try to solve all our own problems using our own service. And like any young company, we’re moving fast and uncovering plenty of new problems all the time.
We built Honeycomb because we were dissatisfied with the “split brain” flow of being alerted by one dashboard product and falling through to a second log aggregation product for investigation. We wanted to be able to capture transient state in the moment of something happening in our system for later exploration.
Here’s an example of how we debugged one real problem with Honeycomb, using Honeycomb. Context: a user has pinged us and complained that some of their queries are slow or timing out.
Begin debugging
So, let’s start out by getting a baseline for query performance across the system for the last few days, for all users. (We’re running a platform, we need to start by making sure the problem isn’t widespread and affecting lots of users.)
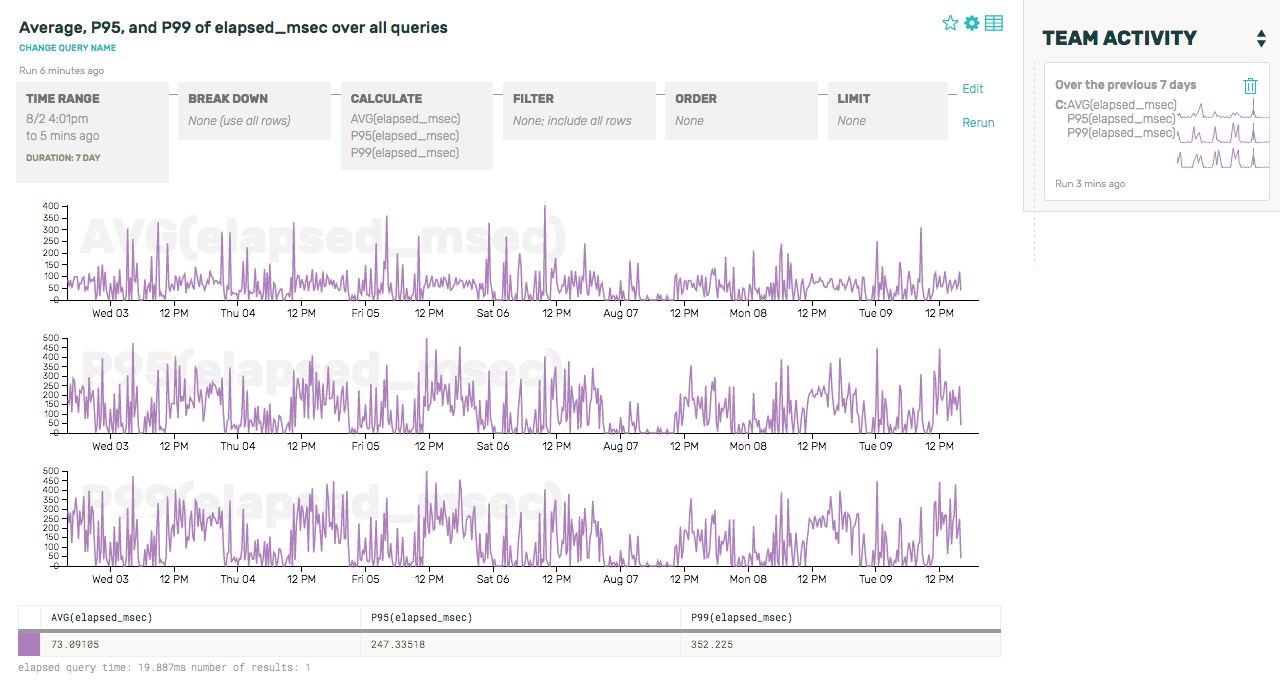
Our top-level metrics seem to be reporting a totally acceptable average/P95/P99 completion times for our queries: 73.1, 247.3, and 352.2ms, respectively (we can see this in the summary table underneath the graphs). This user isn’t the heaviest source of traffic on the platform, so it’s possible their bad experience is just being drowned out by other folks’ goods ones.
Let’s filter down to just the dataset in question, and inspect the latency distribution for queries over a particular threshold (we’ll choose the system-wide 99th percentile of latency, 352ms):
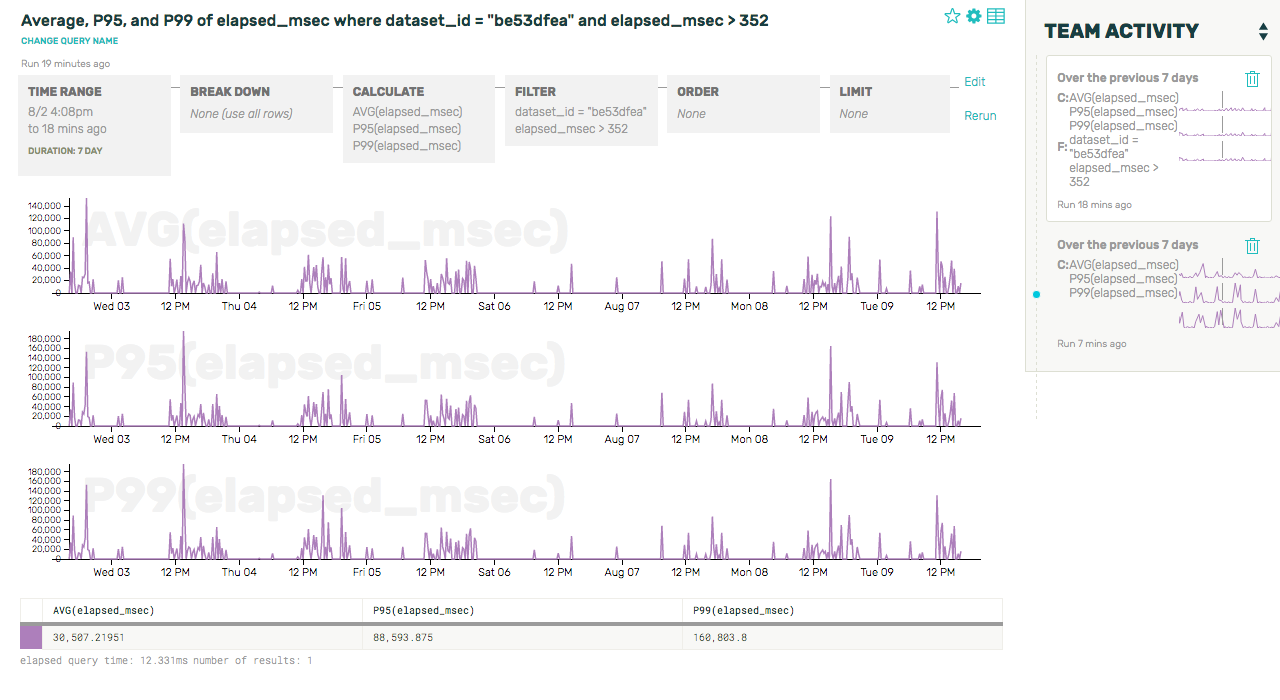
Whoa! Those query times are terrible—an average of 30 seconds to complete a query? A P99 of over two minutes? Let’s see if we can look a little deeper into why that dataset is experiencing such slow queries by zooming into the more recent of these two spikes and looking at some raw rows:
Huh. It sure looks like a lot of these slow queries are only running on one partition—in other words, the queries aren’t being spread out across our various shards correctly. Let’s take a look at all of the dataset’s queries to confirm this, and break down by the number of partitions used by each query:
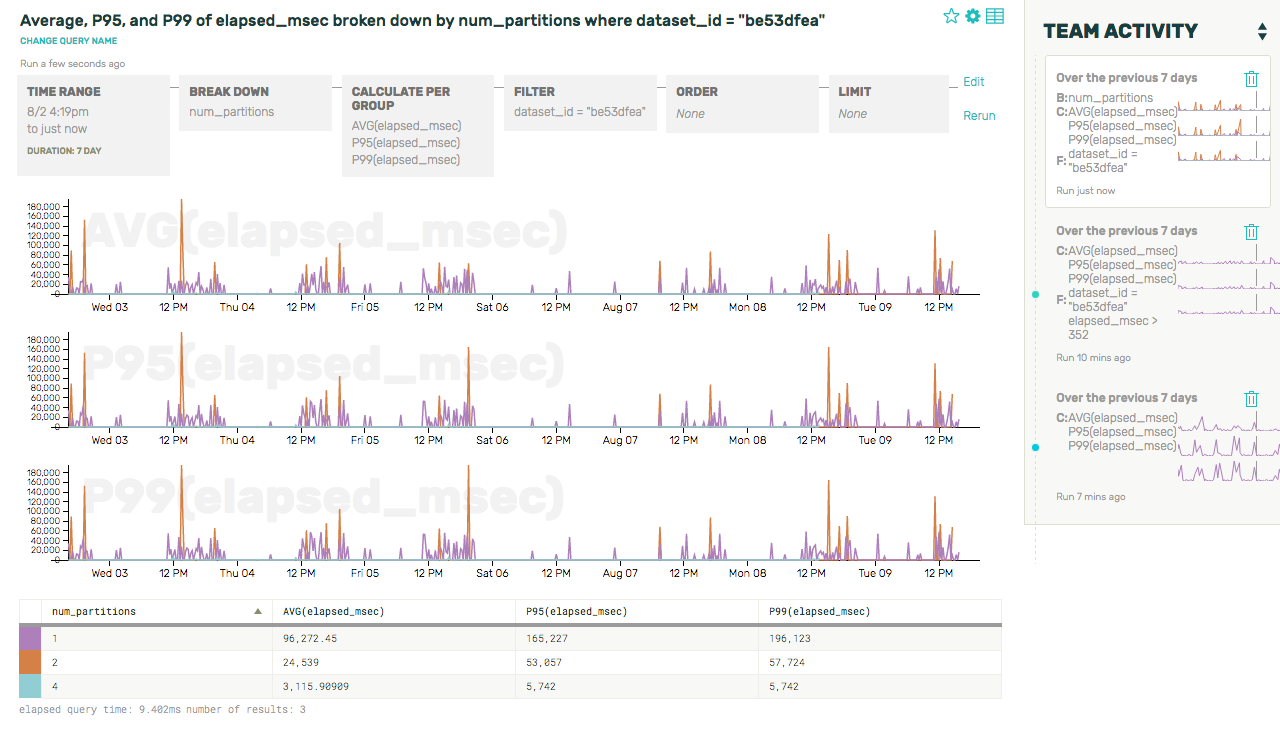
This graph tells us two main things: first, that we were correct in our hunch that increased latency is correlated with a smaller number of partitions. Second, it means that there’s something off with our sharding logic—all queries for this dataset should be hitting all 6 partitions, not just a small fraction of them. So now we know what we need to go and fix!
Post mortem
Averages, percentiles, and time series are nothing new—but with Honeycomb, we don’t have to make hard decisions about what to capture or not. Anything we think might ever be useful, we drop in as an attribute for the event, because the marginal cost is approximately zero. Here’s a sample event from this dataset:
{
  "aggregates":"[{"op":1}]",
  "build_id":"1855",
  "dataset_id":"907bc9ef",
  "end_time":1470768545,
  "engine_rows_processed":17431728,
  "filters":"[{"column":2199,"op":11,"value":{"Str":"sp."}}]",
  "groups":"[2211]",
  "host":"app-c0da5f85",
  "limit":1000,
  "local_msec":2.07953,
  "memory_inuse":4447848,
  "num_goroutines":65,
  "num_partitions":1,
  "orders":"[{"Descending":true,"op":1}]",
  "series_len":120,
  "start_time":1470761339,
  "storage_glob_msec":0.971951,
  "storage_rows_examined":17866164,
  "storage_wrong_timestamp":434436,
  "total_msec":8358.785709
}
As you can see, we don’t have to worry about cardinality limits to support breaking events down by dataset_id, and we can send lots of secondary and tertiary attributes along, just in case they end up being useful (like num_partitions did!). And if there is a missing attribute, there are no schemas to define or combinatorial explosions to avoid—we can just toss another key/value pair into new events and start querying against it right away.
We were able to go from a user complaint to the source of the problem in just a couple minutes. Yay!
This is the first in a series of dogfooding posts showing how and why we think this is the future of metrics exploration. Stay tuned for more!
This is part 1 of a series
-
Get Started!
Sign up to try Honeycomb for free!
Related Posts
How We Leveraged the Honeycomb Network Agent for Kubernetes to Remediate Our IMDS Security Finding
Picture this: It’s 2 p.m. and you’re sipping on coffee, happily chugging away at your daily routine work. The security team shoots you a message...
Introducing Honeycomb’s Microsoft Teams Integration for Enhanced Alert Management
Today marks an exciting milestone at Honeycomb, and we're thrilled to share it with you. We officially launched our integration with Microsoft Teams, a step...
Honeycomb + Tracetest: Observability-Driven Development
Our friends at Tracetest recently released an integration with Honeycomb that allows you to build end-to-end and integration tests, powered by your existing distributed traces....