Have you ever deep dived into the sea of your tracing data, but wanted additional context around your underlying system? For instance, it may be easy to see when/where certain users are experiencing latency, but what if you needed to know what garbage collection is mucking up the place or which allocated memory is taking a beating?
Imagine having a complete visual on how an application is performing when you need it, without having to manually dig through logs and multiple UI screens.
This is where the robustness of Prometheus Clients and Honeycomb comes in. Using Honeycomb Metrics, an enterprise feature that allows customers to consume and display metrics alongside their tracing and telemetry data, teams can unfold and discover what their underlying systems are doing.
In this post, I’ll walk through leveraging the official Prometheus Go client library to instrument Go metrics, ship the metrics to Honeycomb, and utilize the metrics view within Honeycomb to see a graphical presentation of the data you care about.
Let’s dive in.
mkdir go-prometheus-client-example && cd go-prometheus-client-example
Then, create a main.go file with the following:
package main

import (
    "log"
    "net/http"
    "github.com/gorilla/mux"
)

func GorillaHandler(w http.ResponseWriter, r *http.Request) {
    w.Write([]byte("Gorilla!\n"))
}

func main() {
    r := mux.NewRouter()
    r.HandleFunc("/", GorillaHandler)

    log.Fatal(http.ListenAndServe(":8080", r))
}
This file provides the details for creating a basic application using Go Gorilla Mux.
Next, initialize the application:
go mod init github.com/examples/go-prometheus-example
Let’s add Go metrics by means of the Prometheus client to the application. To utilize Prometheus, the promhttp library needs to be installed via go:
go get github.com/prometheus/client_golang/prometheus/promhttp
Once the package is installed, the default metrics can be exposed using the promhttp.Handler().
import (
        ....

        "github.com/prometheus/client_golang/prometheus/promhttp"

)
func main() {
        ....

        http.Handle("/metrics", promhttp.Handler())

        ....
}
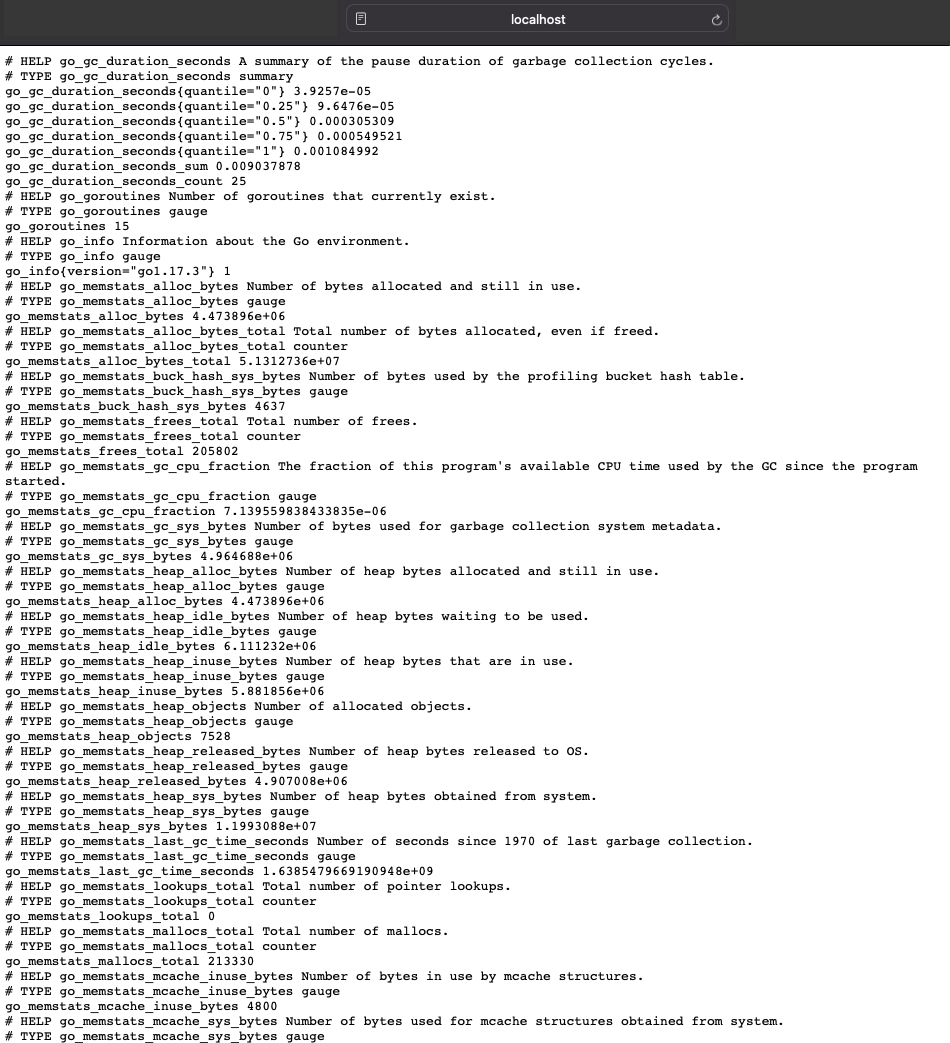
By accessing the metrics endpoint, you can see all of the metrics collected.
Below is an example of the results listed:
Using custom Prometheus metrics for more context
By utilizing custom Prometheus metrics, you can create additional metrics can be created to provide more context.
To utilize custom metrics, the prometheus and promauto libraries have to be installed, in addition to the promhttp library:
go get github.com/prometheus/client_golang/prometheus
go get github.com/prometheus/client_golang/prometheus/promauto
Once the libraries have been installed, the custom metric can be created as a function and called within the main function. The custom metric created below exposes a counter labeled muxapp_processed_ops_total, which counts the number of operations processed thus far, incremented by 3 seconds.
package main

import (

        ....

        "github.com/prometheus/client_golang/prometheus"
        "github.com/prometheus/client_golang/prometheus/promauto"
        "github.com/prometheus/client_golang/prometheus/promhttp"
)


func recordCustomMetrics() {
        go func() {
                for {
                        operationsProcessed.Inc()
                        time.Sleep(3 * time.Second)
                }
        }()
}

var (
        operationsProcessed = promauto.NewCounter(prometheus.CounterOpts{
                Name: "muxapp_processed_ops_total",
                Help: "The number of operations processed",
        })
)

func main() {
        recordCustomMetrics()
....
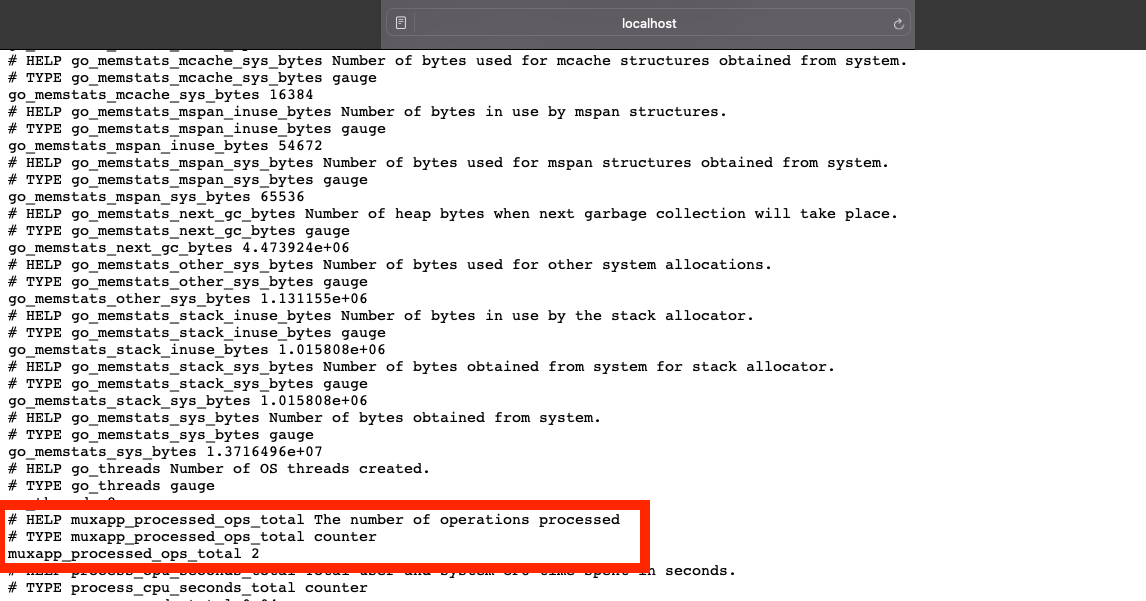
Once the running application is updated with the custom metric, the metric can be viewed through the /metrics endpoint. The highlighted section below shows muxapp_processed_ops_total , which includes:
- HELP – brief description of what it is –
The number of operations processed - TYPE –
counter - VALUE –
2
Sending metrics to Honeycomb
We need to configure the OpenTelemetery (OTel) Collector to send metrics into Honeycomb before we can query the results in Honeycomb and analyze the data via boards.
How to configure the OTel Collector
Metrics can be sent through OTel Collector by first identifying the scrape_configs , then the exporter , and, finally, the service pipeline with the Otel collector configuration file.
Step 1. Prometheus Receiver
To scrape Prometheus endpoints, you will need to configure the OTel Collector with a pipeline that starts with a prometheus receiver:
receivers:
  prometheus:
    config:
      scrape_configs:
        - job_name: go-mux-app
          scrape_interval: 10s
          static_configs:
            - targets: ['gorilla-mux-app:8080/metrics']
WHERE:
job_name: name of the jobscrape_intervals: frequency of the scrapetargets: the endpoint to scrape
Step 2. Metrics exporter
The exporter sends the metrics to Honeycomb.
....

exporters:
  otlp/metrics:
    endpoint: "api.honeycomb.io:443"
    headers:
      "x-honeycomb-team": $HONEYCOMB_API_KEY
      "x-honeycomb-dataset": ${HONEYCOMB_DATASET_NAME}-metrics

....
WHERE:
otlp/metrics: name given for the metrics endpointendpoint: honeycomb endpointheaders: (required)x-honeycomb-teamfor the API Key and thex-honeycomb-datasetfor the dataset
NOTE: For metric data, send this data to its own dataset.
Step 3. Metrics pipelines
The service pipelines collects and processes metric data:
service:
  pipelines:
    metrics:
      receivers: [prometheus]
      processors: [batch]
      exporters: [otlp/metrics, logging]
WHERE:
receivers:prometheuswhich allows reading in Prometheus metricsexportersallows sending the information to Honeycomb via the specified information in theexporterssection
Querying results in Honeycomb
Success! We’ve sent data into Honeycomb. 😄 Now, how do we look at it?
Viewing data In Honeycomb
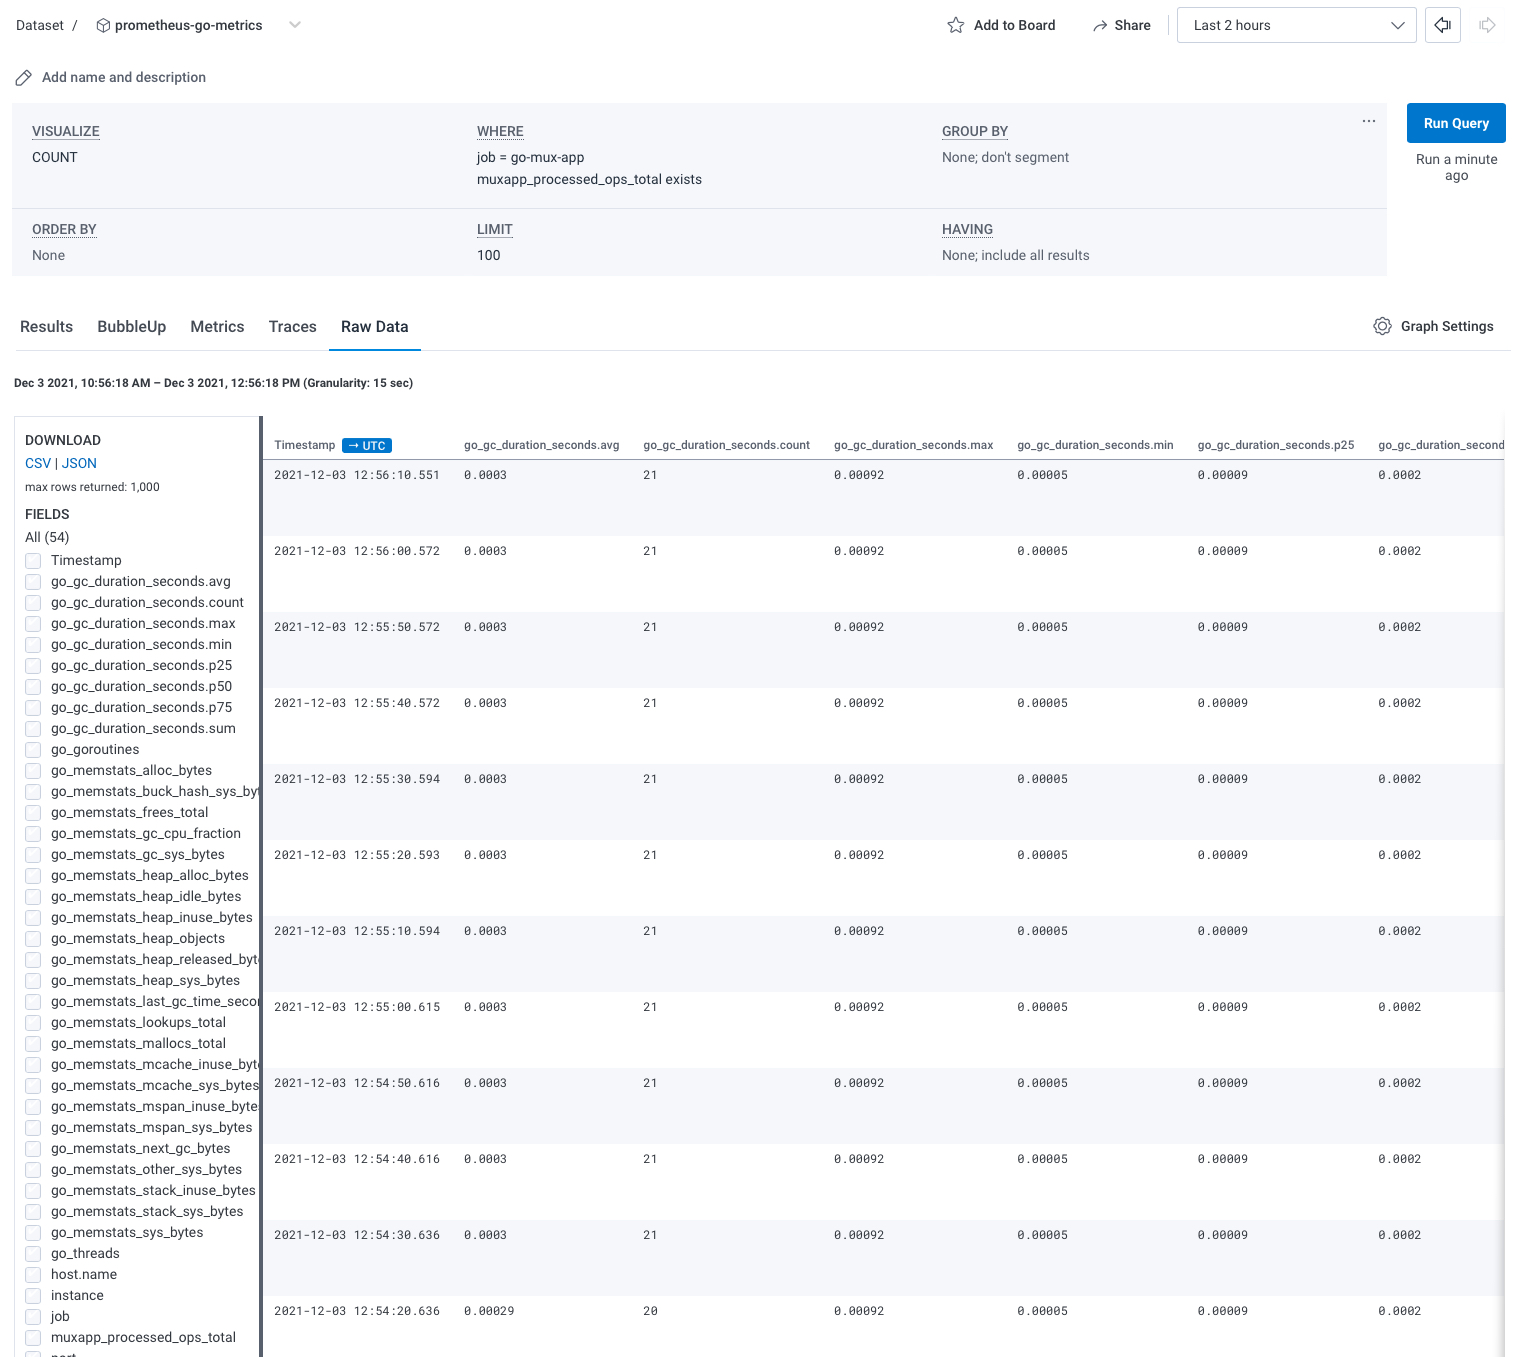
To view the metrics in Honeycomb, go to the appropriate dataset and search for the job using the WHERE clause, where job = “NAME_OF_THE_JOB”.
Tab over to the Raw Data tab to see all of the metrics, including the custom metrics created. An example of the go metrics within the Raw Data tab is seen below:
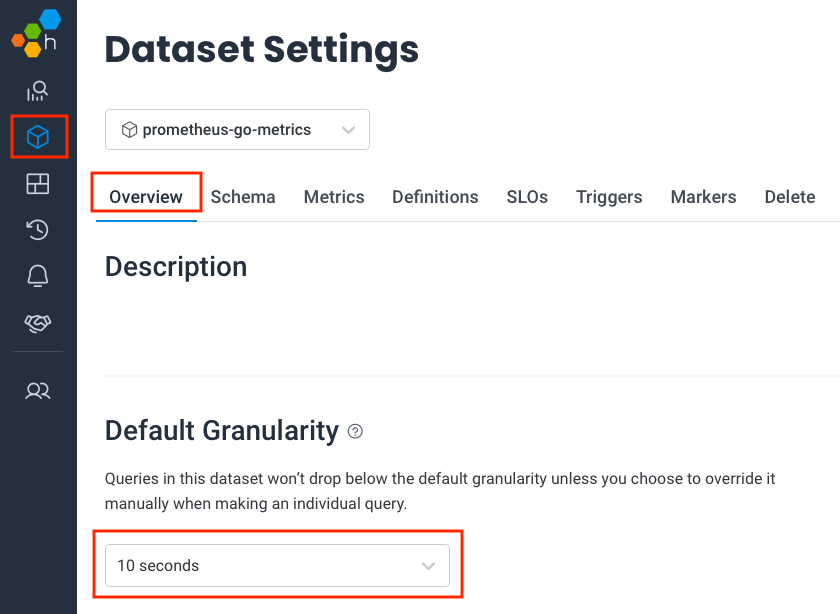
Changing the Dataset’s Default Granularity
Since datasets that contain metrics are periodic, granularity needs to be captured at the scrape_interval or higher to avoid having spiky or confusing graphs. In the case of this example, the Default Granularity will be modified to 10 .
To modify the Default Granularity Setting:
- Navigate to
Datasetstab in Honeycomb - Select
Settingslocated on the right side of the dataset’s row. - Under
Overview→Default Granularity, use the dropdown to select the minimum interval for this dataset
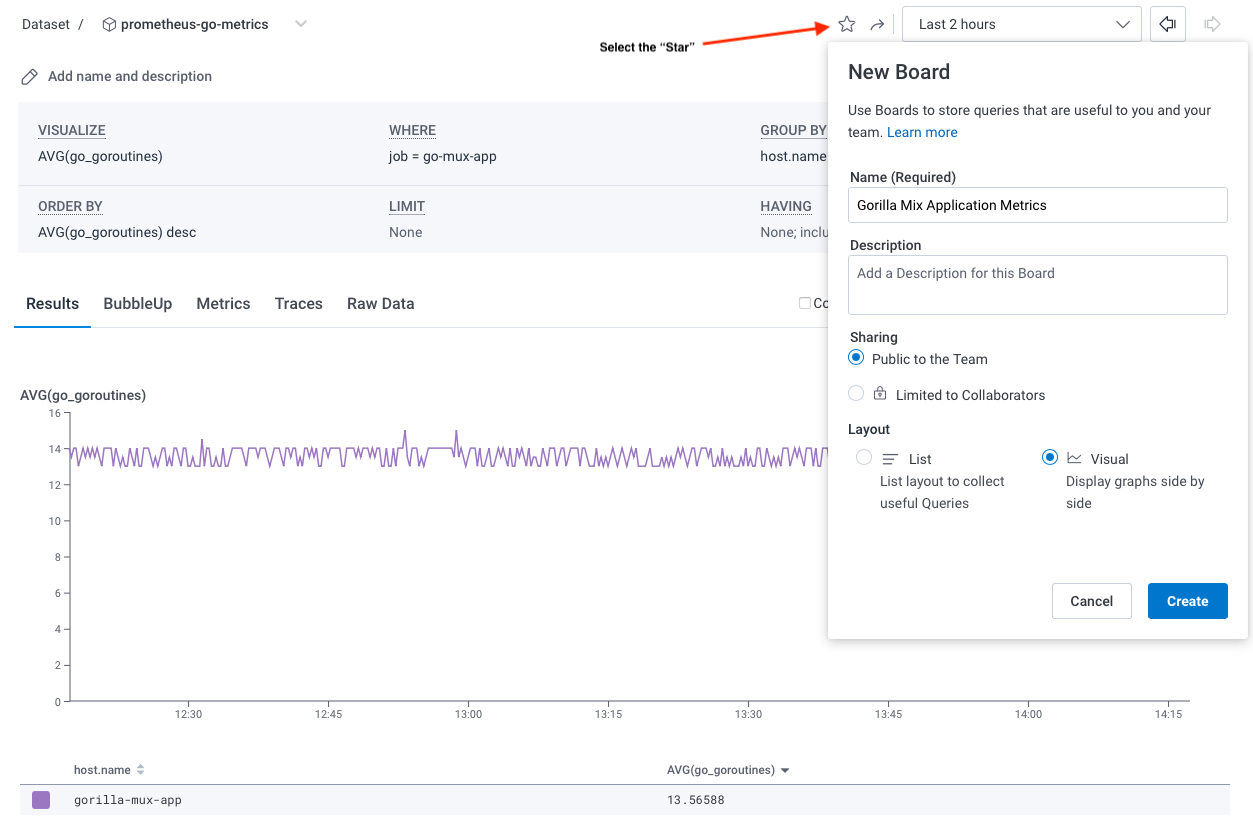
Board creation in Honeycomb
Tracing data and metrics data normally live in different datasets. So, how do we allow them to do their magic? The answer is a board, which provides a bridge to connect metrics with application tracing.
To create a board for a metric, build up a query for what you would like to see in the Query Builder.
In the following example, go routines are being tracked.
WHERE:
- VISUALIZE:
AVG(go_goroutines) - WHERE:
job = JOB_NAME - GROUP BY:
host.name
Utilizing boards with the tracing data set
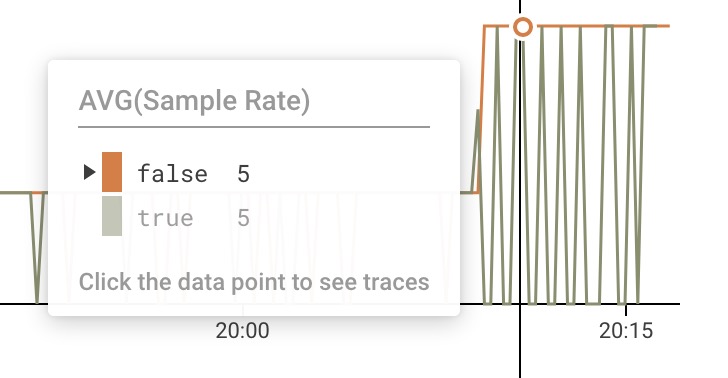
Once the board is created, you can use it to highlight correlations in the graphs and cross-reference it in your tracing dataset using the Metrics tab.
The graphs can then be utilized in correlation with the dataset to see the important metrics you need.
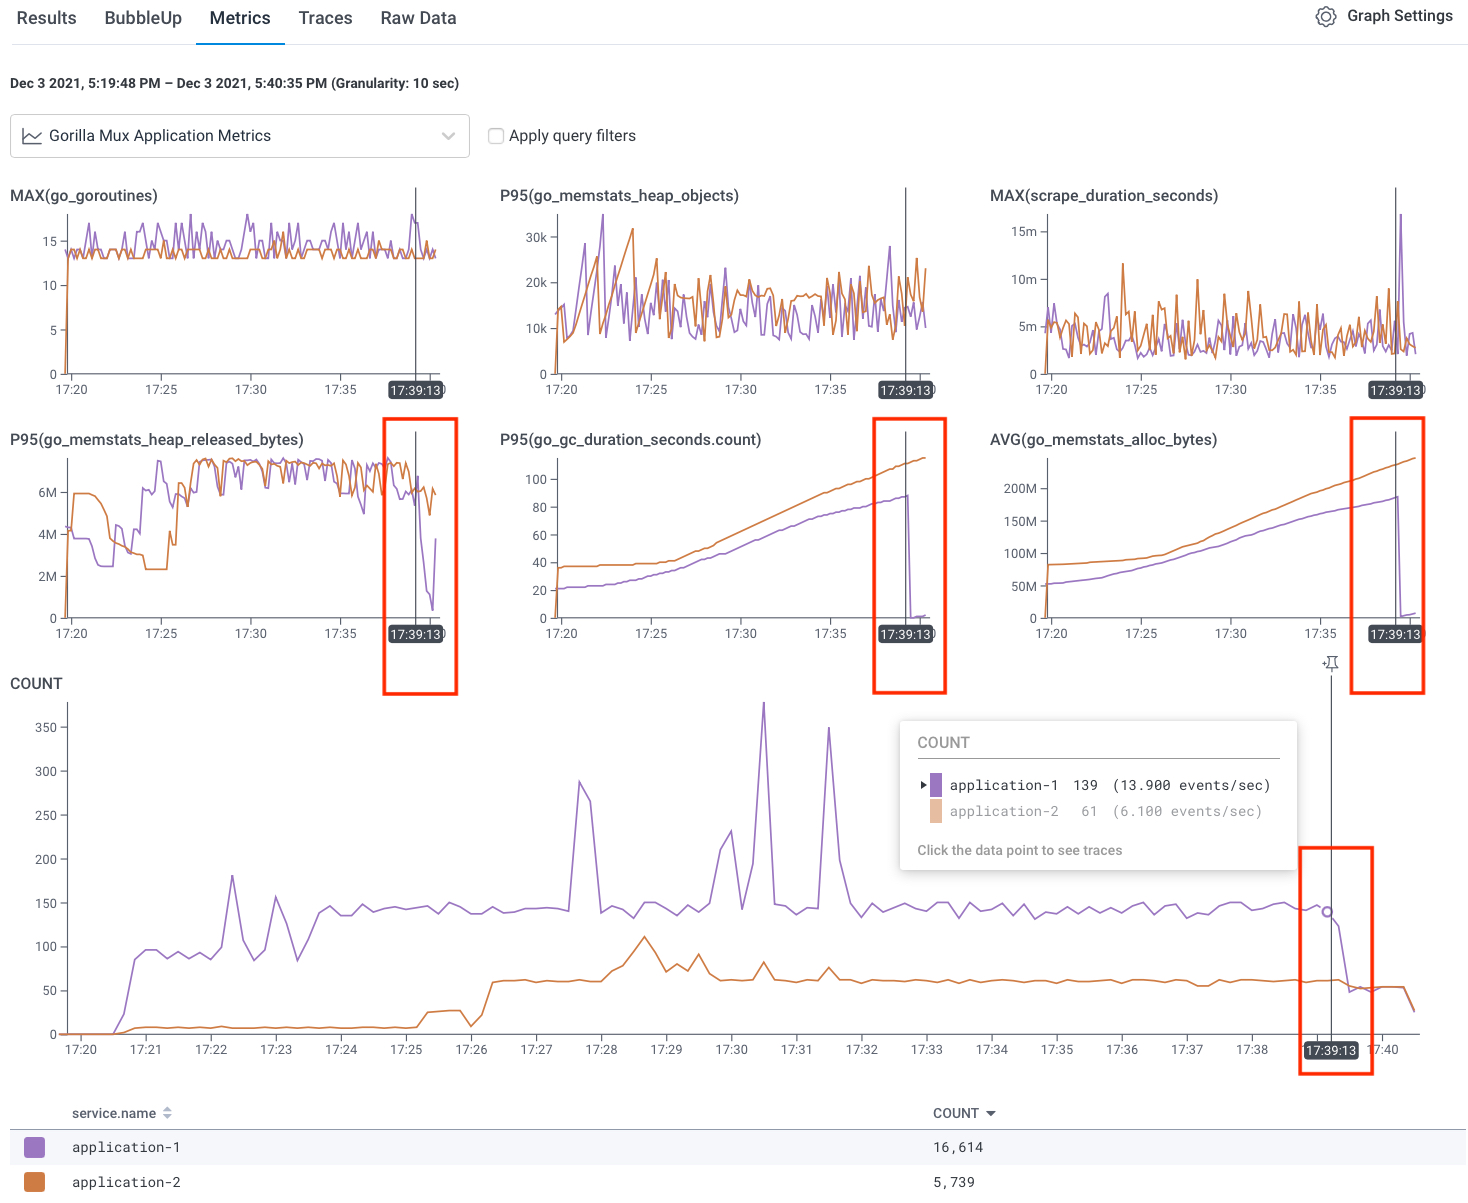
Keep in mind that you can add additional high-cardinality fields to your tracing data that correspond to the metrics data. Using this, you can then apply query filters as well as step into one of the corresponding graphs from the boards to do further analysis.
In this HoneyByte, we’ve sent Go application metrics using the Prometheus Go Client to send metrics data to Honeycomb via a configured OpenTelemetry Collector. We also learned about creating boards and the power behind using metrics in the tracing view. Ready to explore metrics alongside your telemetry data on your own? Sign up for an enterprise trial today.