Update: We now have a browser js guide with practical tips on how to send browser data to Honeycomb.
“Nines don’t matter if users aren’t happy” – my boss
As web applications have grown more complex (Responsive design! React! Redux!) and browser capabilities have grown more awesome (Web sockets! Prefetch/Prerender! Service Worker!), the mapping between a single http request and what the customer actually experiences when loading the page has gotten fuzzier and fuzzier. As a result, the best way to understand what our users experience when using our app is to instrument the browser directly.
The Problem
Unfortunately, browsers are usually ground zero for exactly the sorts of high-cardinality problems and cross-product problems that can crop up with traditional metrics approaches. As that person who cares about client-side instrumentation, I’ve repeatedly had this experience attempting to send my browser metrics to Graphite:
- Start capturing page load time metrics, with a key like:
browser.performance.page_load_time
- Realize I want to slice and dice those by controller & action to understand which pages are slow, and start capturing page load time metrics with this key:
browser.performance.[controller].[action].page_load_time
- Realize I also want to capture which browsers are slow, and start also capturing page load time metrics with this key:
browser.performance.[operating system].[browser name].[browser version].page_load_time
- Realize I really need both together to find the true worst performance hot spots. Capture both of these:
browser.performance.[controller].[action].[operating system].[browser name].[browser version].page_load_time
browser.performance.[operating system].[browser name].[browser version].[controller].[action].page_load_time
in Graphite and then create an Extremely Large Dashboard™ where I can scroll for many minutes, looking at each major browser, controller, and action combo to see which things are the slowest. Repeat across the various metrics I care about (time to first paint, dns resolution time, ssl handshake time, initial js parse & execute time…) until tired.
- Nervously wait by the phone for a call from The Metrics Team asking why I’m blowing up the keyspace with all these thousands of new Graphite keys. Hang up the phone and quietly slink off into the night.

These events have been dramatized for television, but you get the idea.
Enter Honeycomb
This is all a bit better with Honeycomb. Instead of all these combinations, I can send an event for each page load with OS, browser, controller, action, and various timings as keys. Rather than having to look at graphs of thousands of different metrics, we can use breakdowns in the Honeycomb query builder to find which browsers or pages are slow, and then drill in to figure out what the outliers have in common.
If that sounds a bit abstract, here’s how we do this at Honeycomb. We haven’t spent too much time on our browser instrumentation and our setup is fairly simple right now, so I’ve included the whole thing below.
The client-side bits
We collect page load stats at two points: right after the page loads, and right as the user leaves the page. This lets us collect data about both the initial page load and also the user’s experience interacting with the page — for example, whether they ran into any javascript errors and how long they kept the tab open.
This is the code we use to construct the “page-load” event:
// Send a user event to Honeycomb every time someone loads a page in the browser
// so we can capture perf & device stats.
//
// Assumes the presence of `window`, `window.performance`, `window.navigator`,
// and `window.performance.timing` objects
import _ from "underscore";
import honeycomb from "../honeycomb";

// Randomly generate a page load ID so we can correlate load/unload events
export let pageLoadId = Math.floor(Math.random() * 100000000);

// Memory usage stats collected as soon as JS executes, so we can compare the
// delta later on page unload
export let jsHeapUsed = window.performance.memory && window.performance.memory.usedJSHeapSize;
const jsHeapTotal = window.performance.memory && window.performance.memory.totalJSHeapSize;

// Names of static asset files we care to collect metrics about
const trackedAssets = ["/main.css", "/main.js"];

// Returns a very wide event of perf/client stats to send to Honeycomb
const pageLoadEvent = function() {
  const nt = window.performance.timing;

  const event = {
    type: "page-load",
    page_load_id: pageLoadId,

    // User agent. We can parse the user agent into device, os name, os version,
    // browser name, and browser version fields server-side if we want to later.
    user_agent: window.navigator.userAgent,

    // Current window size & screen size stats
    // We use a derived column in Honeycomb to also be able to query window
    // total pixels and the ratio of window size to screen size. That way we
    // can understand whether users are making their window as large as they can
    // to try to fit Honeycomb content on screen, or whether they find a smaller
    // window size more comfortable.
    //
    // Capture how large the user has made their current window
    window_height: window.innerHeight,
    window_width: window.innerWidth,
    // Capture how large the user's entire screen is
    screen_height: window.screen && window.screen.height,
    screen_width: window.screen && window.screen.width,

    // The shape of the current url, similar to collecting rail's controller +
    // action, so we know which type of page the user was on. e.g.
    //   "/:team_slug/datasets/:dataset_slug/triggers"
    path_shape: document.querySelector('meta[name=goji-path]').content,

    // Chrome-only (for now) information on internet connection type (4g, wifi, etc.)
    // https://developers.google.com/web/updates/2017/10/nic62
    connection_type: navigator.connection && navigator.connection.type,
    connection_type_effective: navigator.connection && navigator.connection.effectiveType,
    connection_rtt: navigator.connection && navigator.connection.rtt,

    // Navigation (page load) timings, transformed from timestamps into deltas
    timing_unload_ms: nt.unloadEnd - nt.navigationStart,
    timing_dns_end_ms: nt.domainLookupEnd - nt.navigationStart,
    timing_ssl_end_ms: nt.connectEnd - nt.navigationStart,
    timing_response_end_ms: nt.responseEnd - nt.navigationStart,
    timing_dom_interactive_ms: nt.domInteractive - nt.navigationStart,
    timing_dom_complete_ms: nt.domComplete - nt.navigationStart,
    timing_dom_loaded_ms: nt.loadEventEnd - nt.navigationStart,
    timing_ms_first_paint: nt.msFirstPaint - nt.navigationStart, // Nonstandard IE/Edge-only first paint

    // Some calculated navigation timing durations, for easier graphing in Honeycomb
    // We could also use a derived column to do these calculations in the UI
    // from the above fields if we wanted to keep our event payload smaller.
    timing_dns_duration_ms: nt.domainLookupEnd - nt.domainLookupStart,
    timing_ssl_duration_ms: nt.connectEnd - nt.connectStart,
    timing_server_duration_ms: nt.responseEnd - nt.requestStart,
    timing_dom_loaded_duration_ms: nt.loadEventEnd - nt.domComplete,

    // Entire page load duration
    timing_total_duration_ms: nt.loadEventEnd - nt.connectStart,
  };

  // First paint data via PerformancePaintTiming (Chrome only for now)
  const hasPerfTimeline = !!window.performance.getEntriesByType;
  if (hasPerfTimeline) {
    let paints = window.performance.getEntriesByType("paint");

    // Loop through array of two PerformancePaintTimings and send both
    _.each(paints, function(paint) {
      if (paint.name === "first-paint") {
        event.timing_first_paint_ms = paint.startTime;
      } else if (paint.name === "first-contentful-paint") {
        event.timing_first_contentful_paint_ms = paint.startTime;
      }
    });
  }

  // Redirect count (inconsistent browser support)
  // Find out if the user was redirected on their way to landing on this page,
  // so we can have visibility into whether redirects are slowing down the experience
  event.redirect_count = window.performance.navigation && window.performance.navigation.redirectCount;

  // Memory info (Chrome) — also send this on unload so we can compare heap size
  // and understand how much memory we're using as the user interacts with the page
  if (window.performance.memory) {
    event.js_heap_size_total_b = jsHeapTotal;
    event.js_heap_size_used_b = jsHeapUsed;
  }

  // ResourceTiming stats
  // We don't care about getting stats for every single static asset, but we do
  // care about the overall count (e.g. which pages could be slow because they
  // make a million asset requests?) and the sizes of key files (are we sending
  // our users massive js files that could slow down their experience? should we
  // be code-splitting for more manageable file sizes?).
  if (hasPerfTimeline) {
    let resources = window.performance.getEntriesByType("resource");
    event.resource_count = resources.length;

    // Loop through resources looking for ones that match tracked asset names
    _.each(resources, function(resource) {
      const fileName = _.find(trackedAssets, fileName => resource.name.indexOf(fileName) > -1);
      if (fileName) {
        // Don't put chars like . and / in the key name
        const name = fileName.replace("/", "").replace(".", "_");

        event[`resource_${name}_encoded_size_kb`] = resource.encodedBodySize;
        event[`resource_${name}_decoded_size_kb`] = resource.decodedBodySize;
        event[`resource_${name}_timing_duration_ms`] = resource.responseEnd - resource.startTime;
      }
    });
  }

  return event;
};


// Send this wide event we've constructed after the page has fully loaded
window.addEventListener("load", function() {
  // Wait a tick so this all runs after any onload handlers
  setTimeout(function() {
    // Sends the event to our servers for forwarding on to api.honeycomb.io
    honeycomb.sendEvent(pageLoadEvent());
  }, 0);
});
And here’s the code we use to construct the “page-unload” event, which runs
when the user closes the tab or navigates way from the current page:
// Send a user event to Honeycomb every time someone closes or navigates away
// from a page in the browser, so we can capture stats about their usage of a
// particular page.
//
// Assumes the presence of `window`, `window.performance`, and
// `window.performance.timing` objects
import honeycomb from "../honeycomb";

// Import these numbers from our earlier "page-load" event so we can correlate
// load and unload events together and check memory usage increases.
import { pageLoadId, jsHeapUsed } from "./page_load";

// Capture a _count_ of errors that occurred while interacting with this page.
// We use an error monitoring service (Sentry) as the source of truth for
// information about errors, but this lets us cross-reference and ask questions
// like, "are we ever failing to report errors to Sentry?" and "was this user's
// experience on this page potentially impacted by JS errors?"
const oldOnError = window.onerror;
let errorCount = 0;
window.onerror = function() {
  // call any previously defined onError handlers
  if (oldOnError) { oldOnError.apply(this, arguments); }
  errorCount++;
};

// Returns a wide event of perf/client stats to send to Honeycomb
const pageUnloadEvent = function() {
  // Capture how long the user kept this window or tab open for
  const openDuration = (Date.now() - window.performance.timing.connectStart) / 1000;

  const event = {
    page_load_id: pageLoadId,
    error_count: errorCount,
    user_timing_window_open_duration_s: openDuration,
  };

  // Memory info (Chrome) — also send this on load so we can compare heap size
  // and understand how much memory we're using as the user interacts with the page.
  if (window.performance.memory) {
    event.js_heap_size_used_start_b = jsHeapUsed;
    event.js_heap_size_total_b = window.performance.memory.totalJSHeapSize;
    event.js_heap_size_used_b = window.performance.memory.usedJSHeapSize;
    event.js_heap_change_b = window.performance.memory.usedJSHeapSize - jsHeapUsed;
  }

  return event;
};

// Only attempt to send stats if the browser is modern enough to have nav timing
window.addEventListener("pagehide", honeycomb.sendEvent(pageUnloadEvent()));
The server-side bit
Our primary customer-facing web app, Poodle, has an endpoint that forwards these events to Honeycomb’s ingestion API endpoint. Sending events through Poodle lets us keep our Honeycomb write key private (we don’t recommend exposing it in the browser for now since write keys allow you to read markers and create new datasets) and also allows us to add extra metadata using our server-side instrumentation code. For example, since Poodle knows the currently logged-in user and the team they are viewing, we can add fields like user_id , user_name, user_email, team_id, and team_name to our events before sending them to Honeycomb.
We send these events to the same Honeycomb dataset that we use for our product analytics. In addition to allowing us to reuse our proxy endpoint logic, it means that we can query the dataset for both technical and behavior questions about the Honeycomb web experience and more easily look for correlations between the technical details like device type, performance, errors and customers’ product usage (number of queries run, triggers created, boards shared).
Here’s the handler function we use to forward these events to the Honeycomb API:
func (h *UserEventsHandler) sendToHoneycombAPI(eventType string, metadata map[string]interface{}, user *types.User) {
    ev := h.Libhoney.NewEvent()
    ev.Dataset = "user-events"      // Name of the Honeycomb dataset we'll send these events to
    ev.AddField("type", eventType)  // Name of the type of event, in our case either "page-load" or "page-unload"
    ev.Add(metadata)                // All those event fields we constructed in the browser

    // And then we add some fields we have easy access to, because we know the
    // current user by their session:
    ev.AddField("user_id", user.ID)
    ev.AddField("user_email", user.Email)

    // Send the event to the Honeycomb API (goes to our internal Dogfood
    // Honeycomb cluster when called in Production).
    ev.Send()
}
The Libhoney.NewEvent() call will also pick up any global metadata we’ve added to send to Honeycomb, so we’ll get extras like build ID and environment for free.
How it’s going
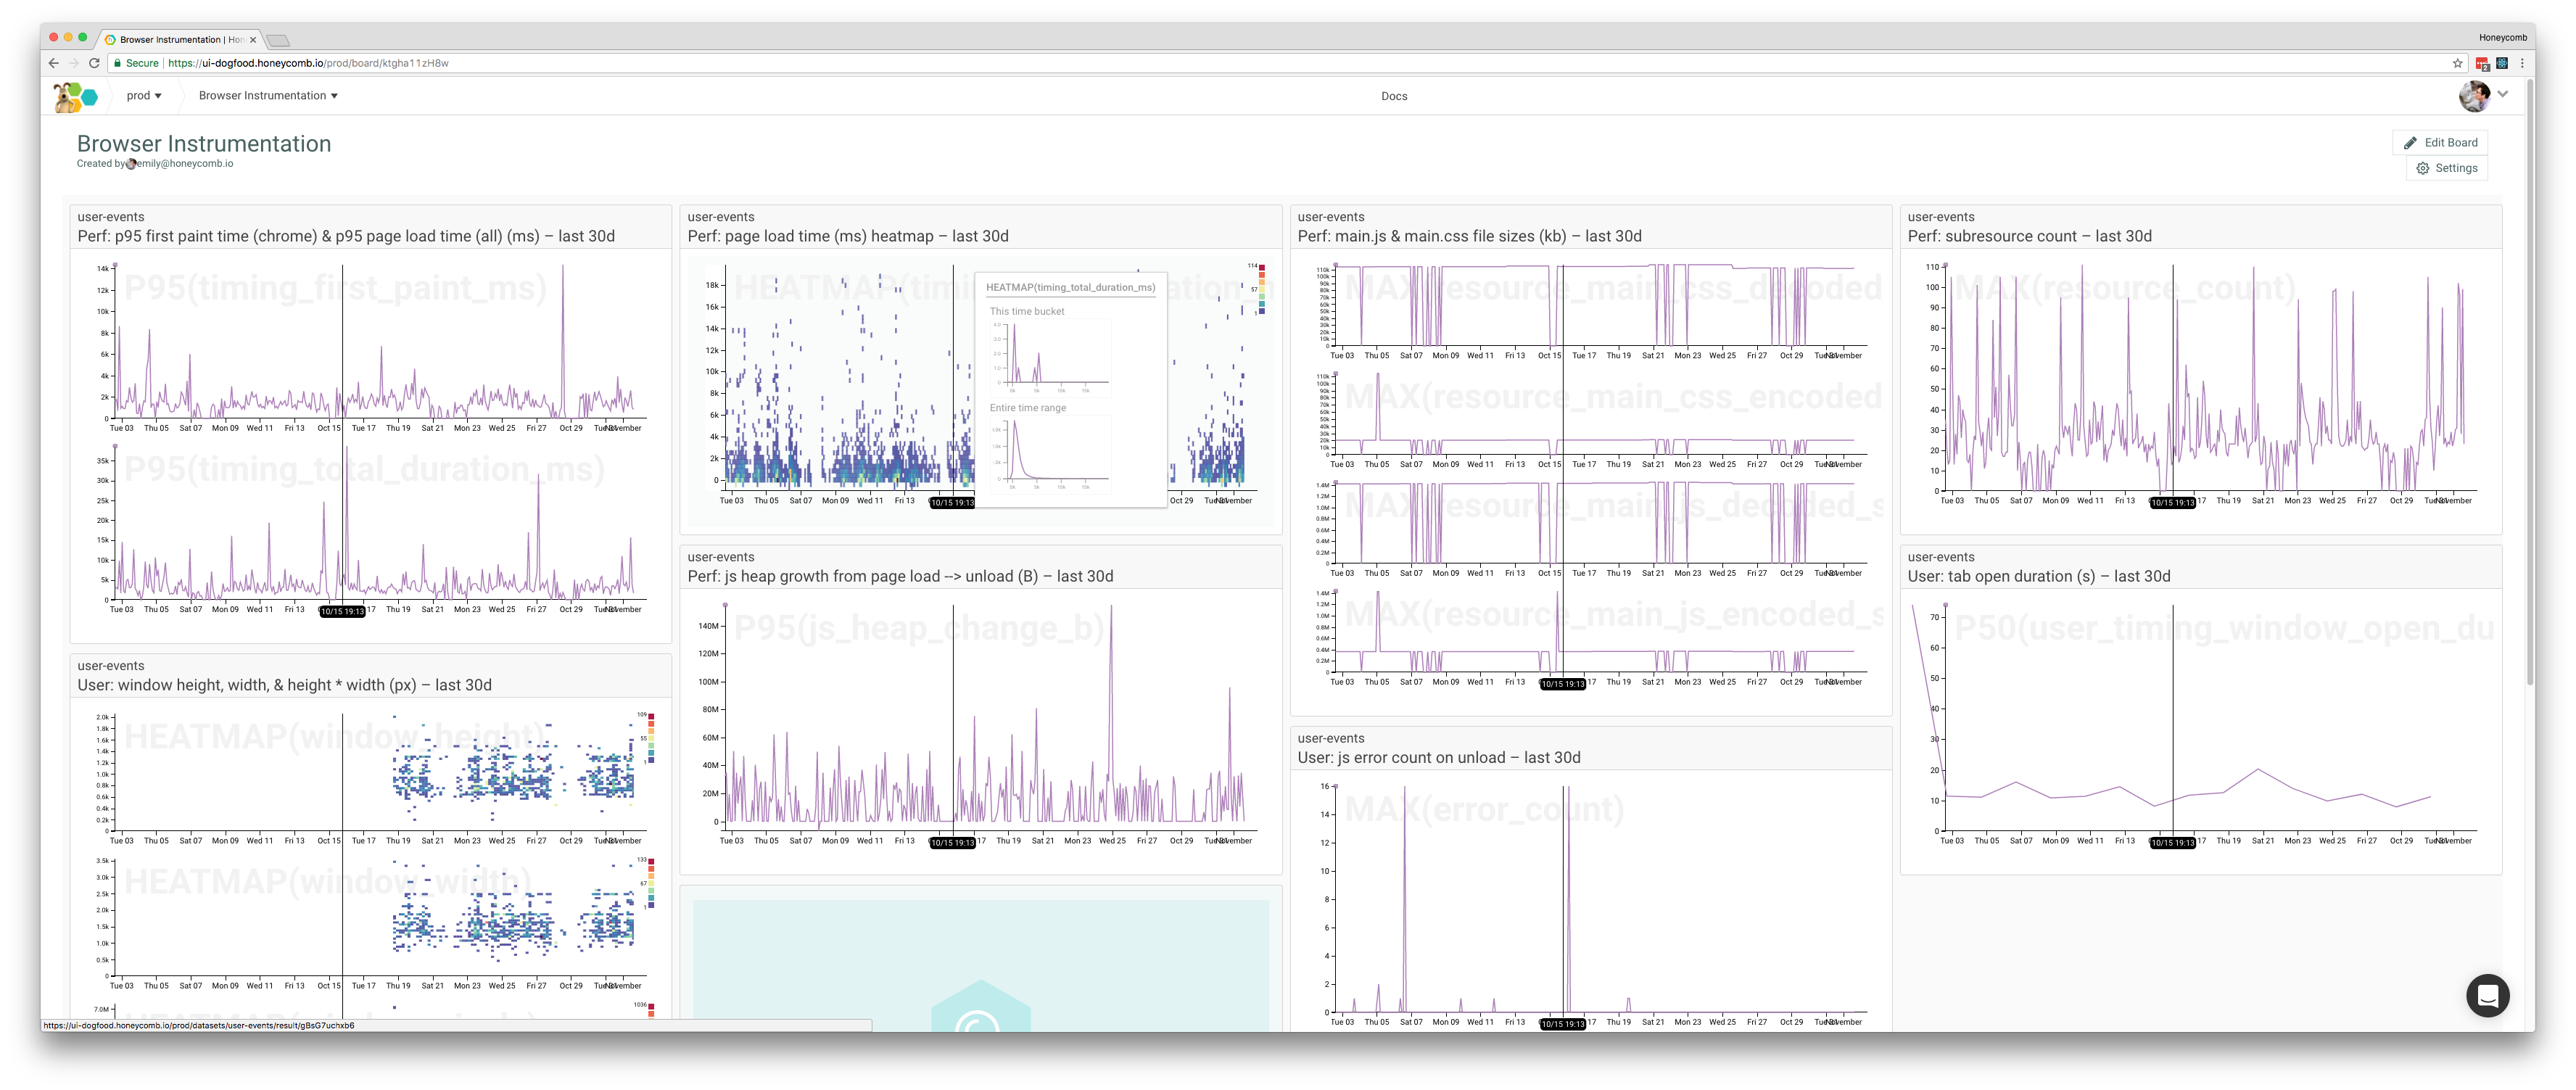
From these three files, we get some relatively actionable data. Here’s a board of the queries I look at the most:
My favorite graph so far is this one of our javascript and css bundle sizes. (It just needs markers so we can correlate these changes to specific deploys.)
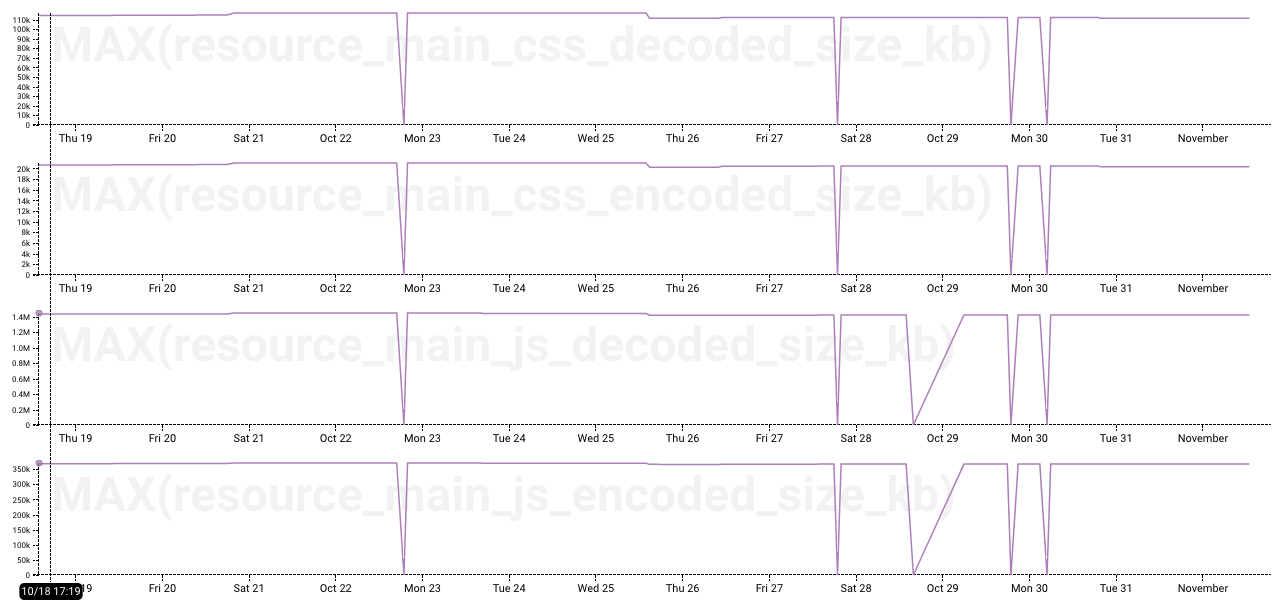
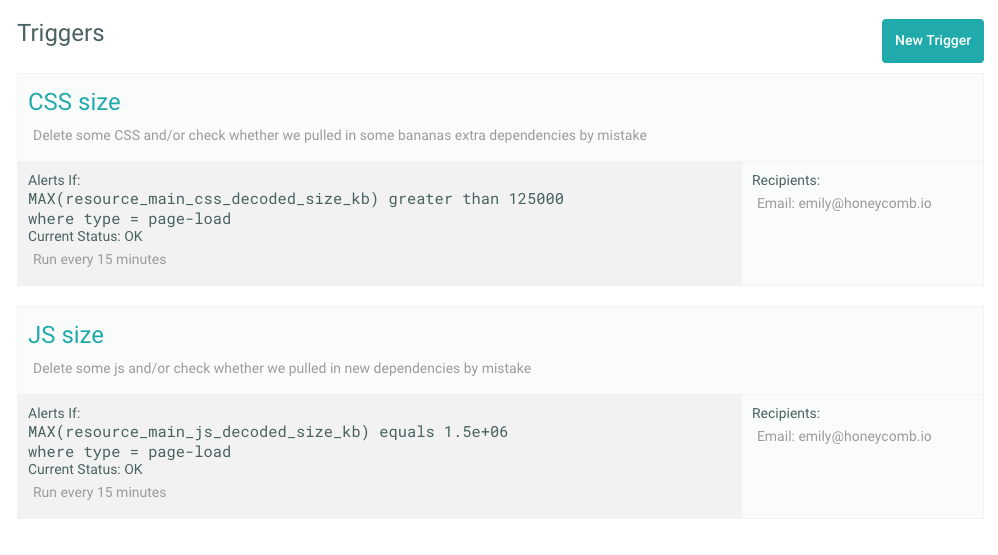
Using the data in this graph, I can set up a trigger in the honeycomb UI and get an email or slack alert the next time I accidentally import “lodash” instead of “underscore” in our JS and inadvertently deploy another 20k of dependencies. (Whoops.)

We can also use it as a quick and dirty way of enforcing performance budgets.
What next?
With a few hundred lines of code, we already have good visibility into what our customers are experiencing in the browser. But there’s a lot more we could start collecting without too much trouble, if we got curious:
On page load:
- Active feature flags and their values
- Referring search term, if on a search result page
- Browser capability support. Using a library like Modernizr, we could check to see what percentage of our customers’ browsers support features we’d like to use (emoji, video element, web workers, css grid, etc.) to help us decide if we can use these features in our code.
On page unload:
Any custom user timings. For example, we might want to time how long it takes to fetch and render data for async-loaded UI elements, but not hold up sending the initial page load event to capture these.
New events:
There are some significant actions users can take while interacting with a page that may warrant their own event. For example, we know want to time how long it takes to run a query, poll for the result, and render the resulting graph on screen. We already send an analytics event whenever a user runs a new query, but we may want to add those performance timings (initial request, polling duration, render duration, overall user-perceive wait time) to the event so we can start to understand how query performance affects customers’ usage of queries.
Server-side:
- Better user agent to device type, operating system, and browser mappings. We don’t currently use a library to transform UA strings to friendly names, but we should. Using “browser name” and “browser version” in Honeycomb breakdowns would help us spot browser-specific performance issues more quickly.
- Geo-IP mapping. Using a library to map users’ IP addresses to approximate location could help us better understand app performance for customers in Europe, Australia, etc.
Let us know
This post covers collecting general-purpose data that would be relevant to many web applications, but as you continue to to instrument, you’ll likely find more app-specific and domain-specific bits of your experience to capture in your events too.
Happy instrumenting! If you run into any interesting use cases or stories in your browser instrumentation journey, we want to hear about it: support@honeycomb.io