
CONCURRENCY is now enabled for all customers. See our docs page for information about how it works and how to use it effectively. Questions or would like to test out CONCURRENCY and Honeycomb? Sign up today for a free account.
It started with a simple question: Why did one query take 10 seconds, while another almost identical query took 5? At Honeycomb, we use AWS Lambda to accelerate our query processing. It mostly works well, but it can be hard to understand and led us to wonder: What was really going on inside this box called Lambda?
These questions kicked off the development of CONCURRENCY, a new aggregate in the Query Builder that lets us look at how many spans are active at once. In this blog, we’ll take a look at what it does and why it’s so helpful.
CONCURRENCY in action
Tracing a distributed query across a few dozen servers is one thing, but gather any detail from the many thousands of Lambda invocations and things get unwieldy fast. Add co-tenancy—lots of our own customers doing different jobs but sharing a pool of Lambda resources—and limited information from AWS itself about what it’s doing, and we were left scratching our heads. Until we used CONCURRENCY, that is.
We can start with a trace of a single query, which shows how the query engine uses Lambda. Here’s a large one, which took around 10 seconds and weighs in at over 750,000 spans.
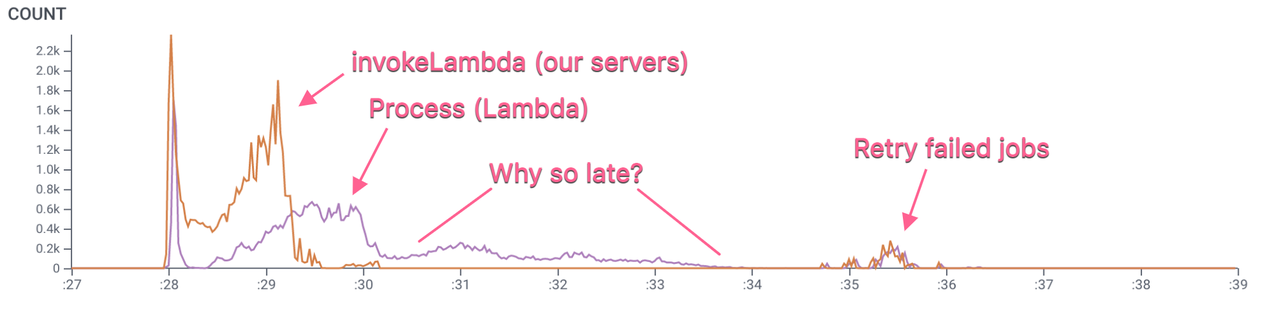
Figure 1
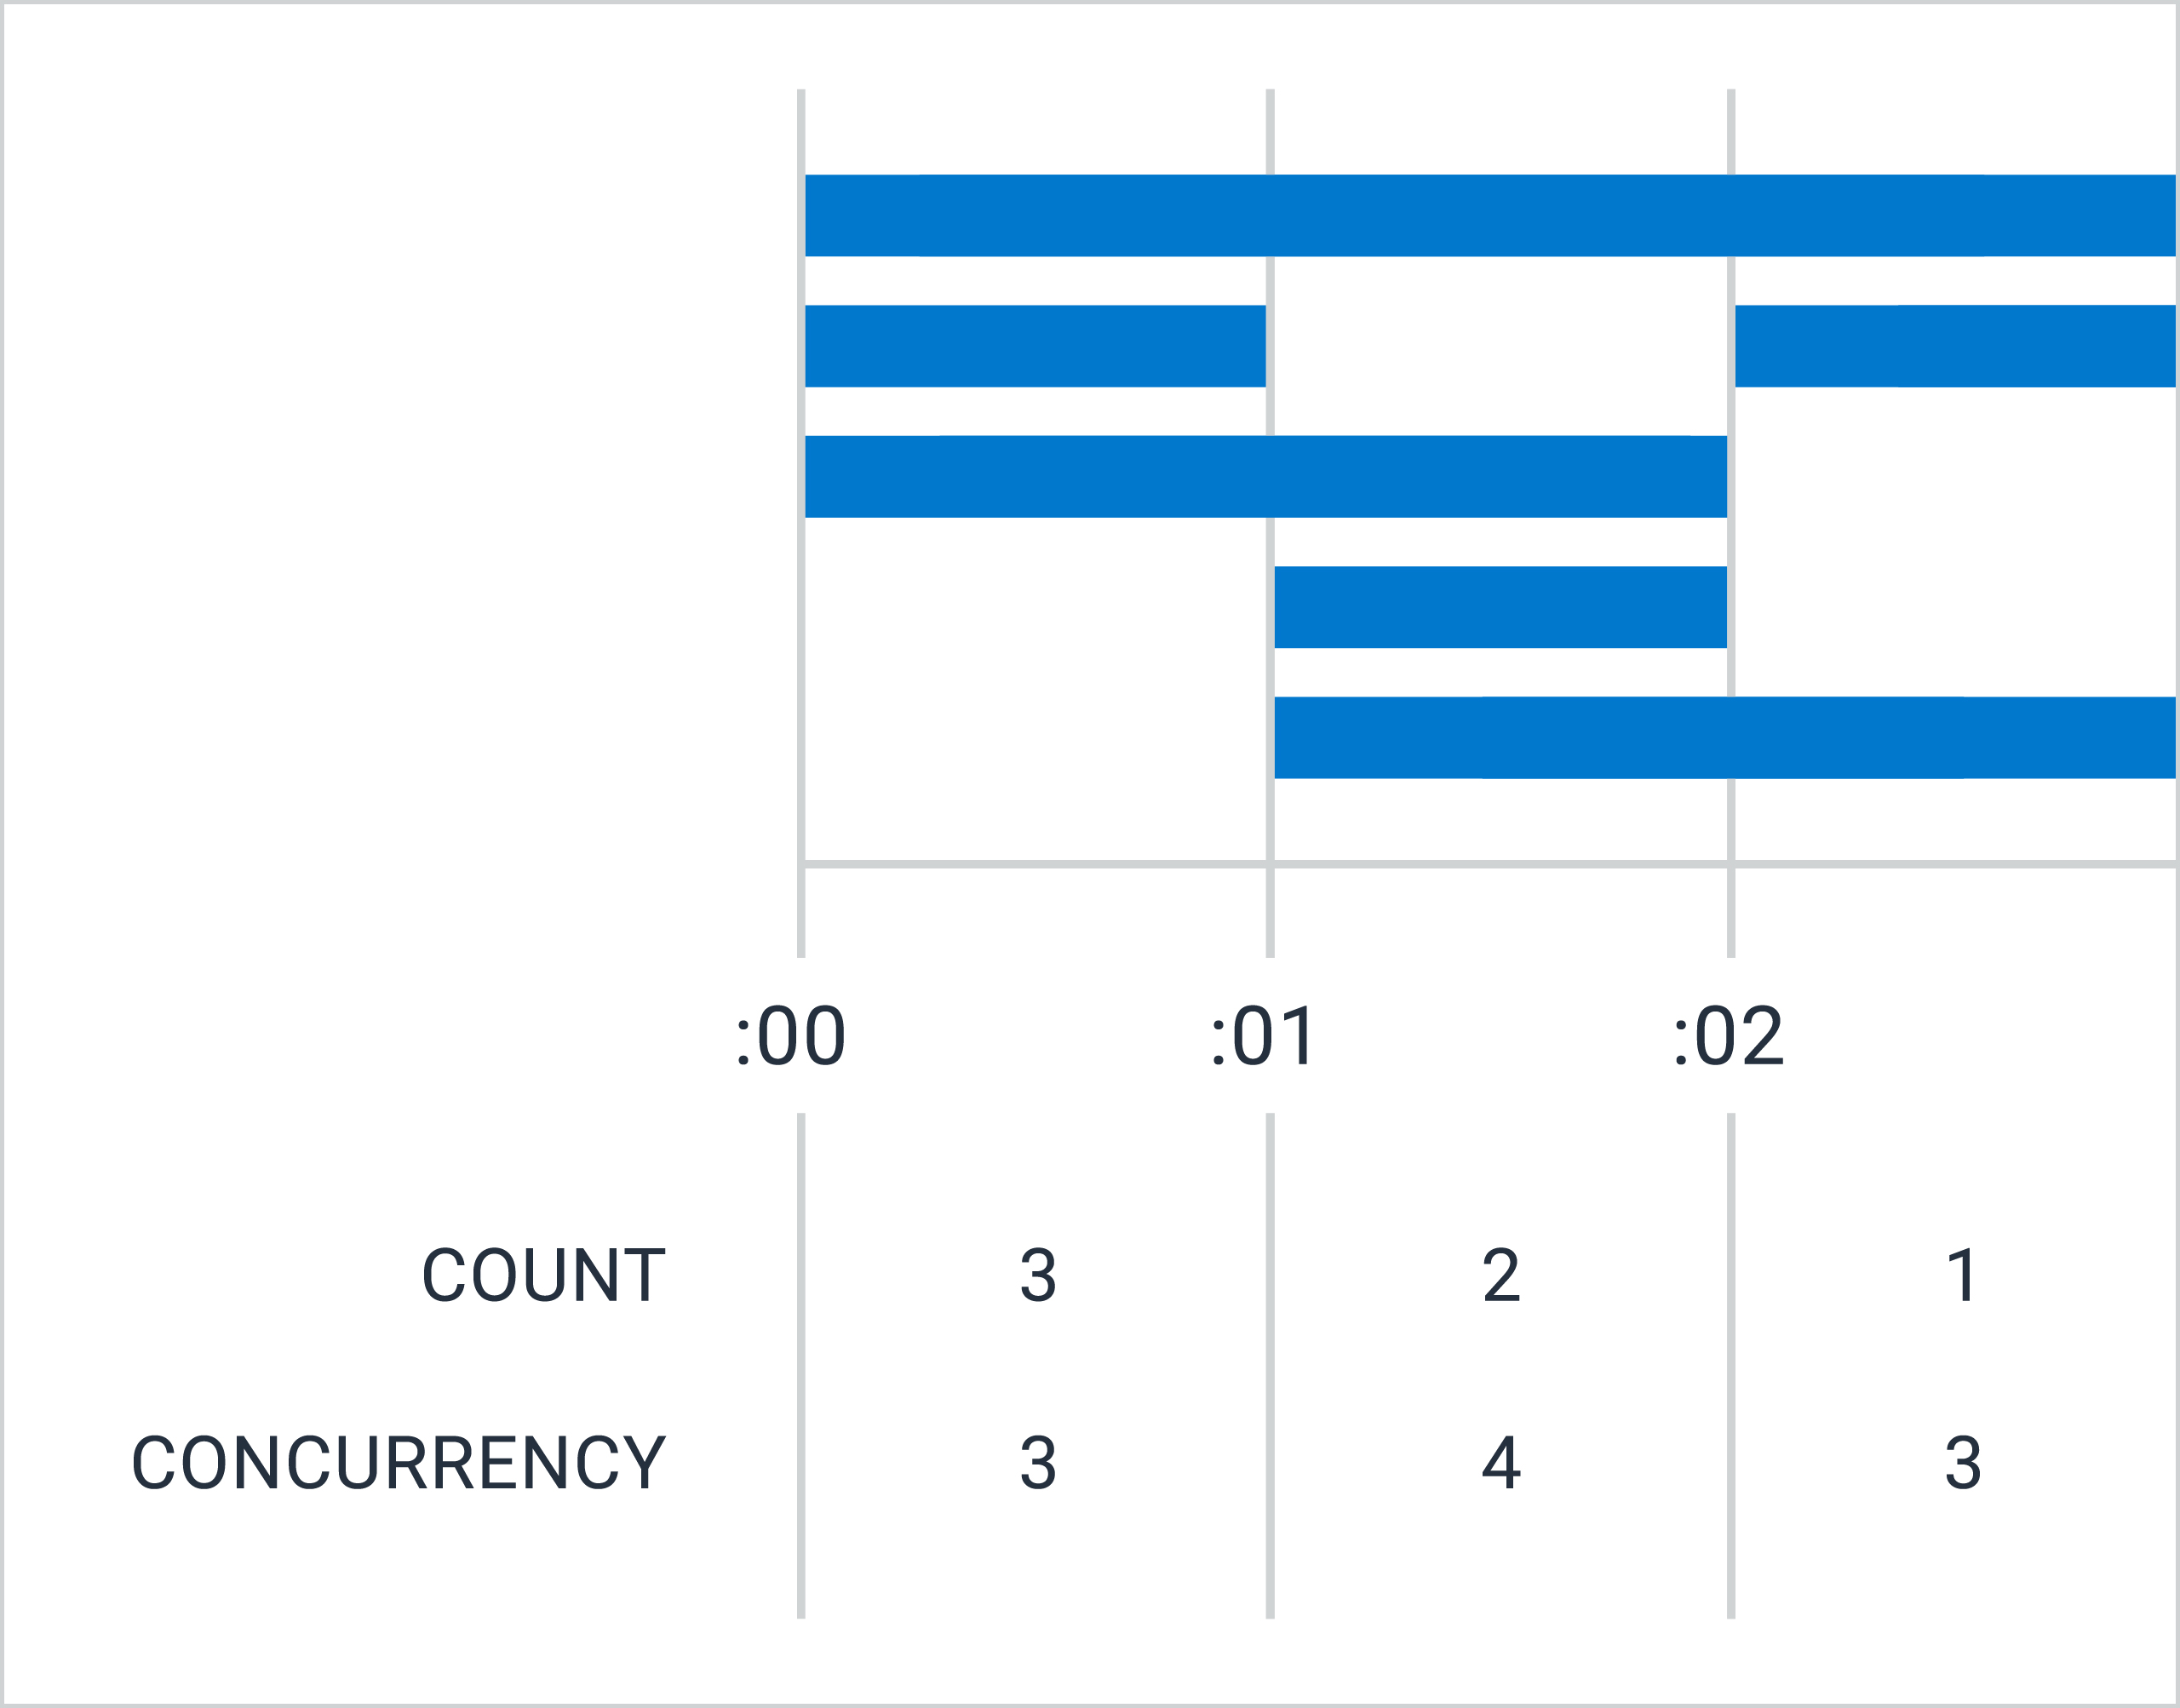
This trace is too big to use the trace viewer, but we can COUNT the relevant spans—our servers create invokeLambda spans (orange) for each Lambda call they make, and the Lambda jobs do their work in a single Process span (purple), so there’s a 1:1 relationship between the two spans. Therefore, the space between the curves tells us how long the jobs took to start.
In the Figure 1, we can see that after an initial burst, there’s a delay between when we ask for a Lambda and when we get one. These delays are short for the most part, but there are also quite a few stragglers that don’t start until quite late. (Note the x-axis scale is seconds, not minutes.)
How come? What are those late starts waiting for? We don’t have much to go on here, so it’s not easy to reach conclusions about the state of the system. Notably, no matter how long a span runs, it appears in the COUNT graph as a single point at its start time, so all we can see in Figure 1 is when these spans started and not what happened to them after that.
But what if we could see how many processes were actually running at any given time?
Say hello to the CONCURRENCY aggregate (Figure 2), which lets us look at how many spans are running at once. We can see not just when these jobs started, but how long they ran.
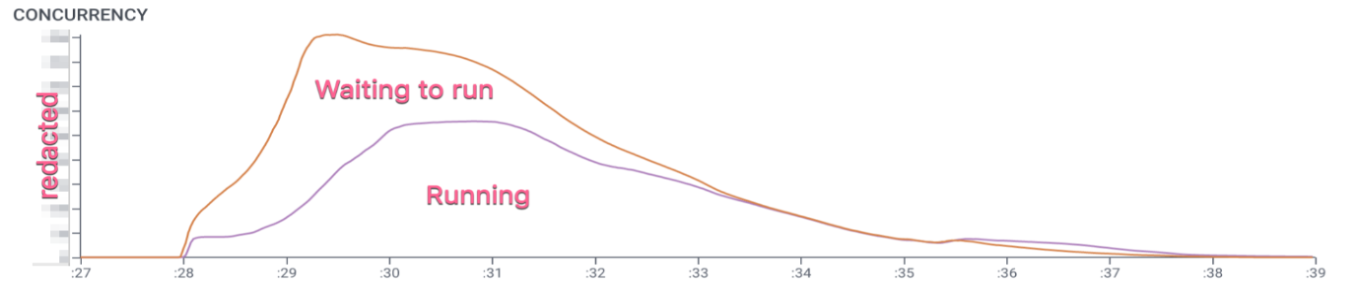
Figure 2
Now this is a little more interesting. The demand curve ramps up, quickly but not vertically (it takes a little while for our servers to queue up all the jobs for a giant query like this), while Lambda ramps up more slowly before hitting a plateau, and then both taper off. The height of the purple line is the number of Lambdas we have actively running, while the height of the orange line above that is the depth of the queue. The two lines finally meet around :33.5, the same time we see the last of the Process spans start in Figure 1.
So why the plateau? And why the slow taper? We might expect, or at least hope, that Lambda execution would proceed a bit more expeditiously.
To dig deeper, we added new instrumentation of the Lambda lifecycle. This creates very simple, linear traces: a run span (purple) while running, followed by a sleep span (orange) while asleep, repeated as long as the process lives. (The sleep span is opened at the end of one run, and then closed at the start of the next.) In the trace viewer, these are pretty boring, but with CONCURRENCY we can aggregate all of those traces to see the state of our Lambda pool:
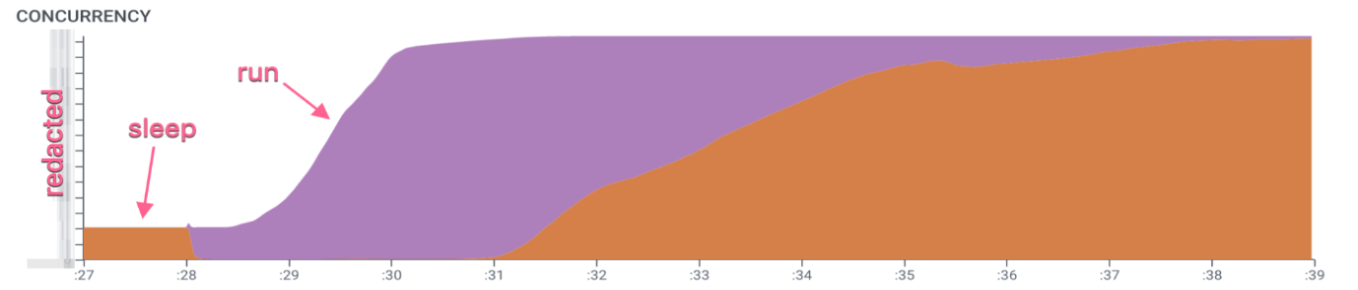
Figure 3
Now things start to make sense. The size of the pool scales based on demand, and prior to this query, it was pretty small. That initial burst of Process spans in Figure 1 corresponds to the entirety of this small pool jumping into action, but scaling up the pool takes longer—over one full second. The pool also has a maximum size, and this explains the plateau in Figure 2. Once we reached that level of concurrency, AWS wasn’t going to give us any more instances, so everything else had to wait.
At the :31 mark, however, you can see that some of the Lambdas start to go back to sleep, even though there are still jobs in the queue. Figures 1 and 2 show that we were waiting until well past the :33 mark for Lambda jobs to start. This is the source of the long, slow taper. We’d expect jobs to run as soon as space in the Lambda pool is available for them, but instead some of them waited almost 3 more seconds before they started.
What this means is that jobs are not being scheduled with perfect efficiency; they’re hanging around in the queue even when there are resources available. A quick look at the code we use to manage Lambda jobs explains why. AWS’s Lambda API doesn’t enqueue jobs itself; it just returns an HTTP 429 when there are no instances available. It’s up to the caller to keep retrying until it gets a slot, and during the interval between retries, jobs simply wait, even if Lambda instances become available in the meantime.
The AWS SDK we use lets you configure the minimum and maximum retry interval for invocations which get a 429 response, and uses its own internal logic to scale up to the max. The maximum retry interval we specified in the configuration?
MaxThrottleDelay: 3 * time.Second
And that’s exactly how much extra time our least-lucky, latest jobs had to wait.
It would have been possible to figure this out without CONCURRENCY, but the new visualization makes it much easier to quickly understand the state of the system. We hope you find it useful!
Using CONCURRENCY yourself
CONCURRENCY is now enabled for all customers. See our docs page for information about how it works and how to use it effectively. It may enable, or depend on, novel instrumentation like our lifecycle tracing above. And please, share your experiences and feedback with us!
Questions or would like to test out CONCURRENCY and Honeycomb? Sign up today for a free account.


