The Guide to Kubernetes Debugging
Kubernetes is widely used for deploying, scaling, and managing systems and applications and is an industry standard for container orchestration. Google engineers originally developed Kubernetes as an open-source project. Its first release was in September 2014, and since then, it has matured into a graduate project maintained by the Cloud Native Computing Foundation (CNCF). With the complexities of scale and distributed systems, debugging in Kubernetes environments can be difficult.

By: Rox Williams
How FireHydrant Implemented Honeycomb to Streamline Their Migration to Kubernetes
Learn MoreKubernetes is widely used for deploying, scaling, and managing systems and applications and is an industry standard for container orchestration. Google engineers originally developed Kubernetes as an open-source project. Its first release was in September 2014, and since then, it has matured into a graduate project maintained by the Cloud Native Computing Foundation (CNCF). With the complexities of scale and distributed systems, debugging in Kubernetes environments can be difficult.
In this blog post, we’ll walk through the essentials of Kubernetes debugging, including the commands, tools, and practices that help you quickly diagnose and resolve issues.
Understanding Kubernetes architecture
We’ll describe Kubernetes’ basic architecture and components, which are important to understand when debugging issues arise.
Key Kubernetes components
These are some components to understand when debugging and managing applications on Kubernetes.
- Pods: the smallest deployable unit in Kubernetes, containing one or more containers.
- Nodes: the worker machines where pods are deployed.
- Cluster: a collection of nodes managed by Kubernetes.
- Service: a method for exposing applications running on pods and managing internal networking.
- Namespaces: a way to logically divide cluster resources, enabling resource isolation within a single Kubernetes cluster.
- Deployments: a Kubernetes resource that manages the lifecycle of pods, ensuring desired replicas, rolling updates, and rollback capabilities.
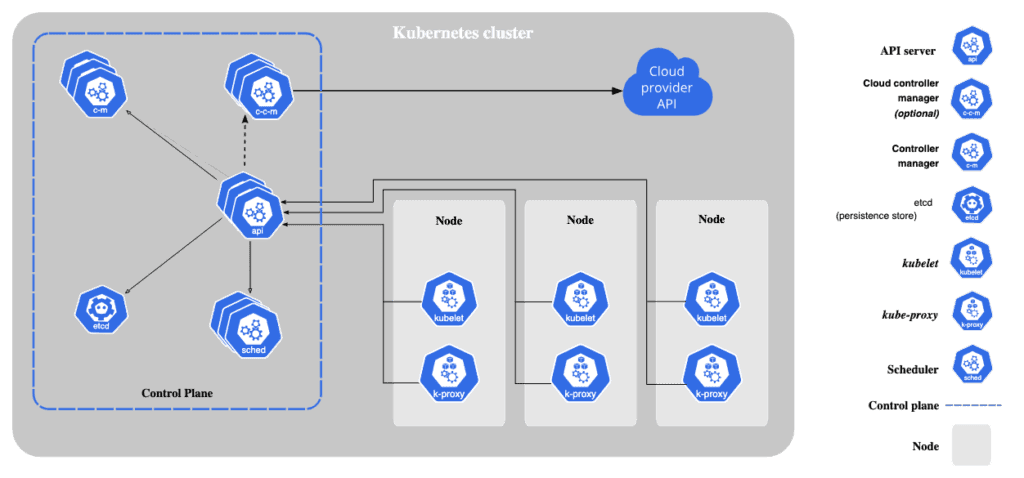
The state of a Kubernetes cluster is set by configuration and manifest files that are written in YAML. The manifest files declare the desired state of the cluster and are sent to the Kubernetes control plane. The control plane, which includes components such as the kube-apiserver, etcd, controller manager, and scheduler, works continuously to bring the actual cluster state in line with the desired state. It does this with the help of kubelets, which are node-level gents responsible for ensuring that containers are running as specified. This ongoing process, which observes the current state, determines the necessary changes, applies the changes, and repeats, is known as the reconciliation loop. This model makes Kubernetes a powerful platform for managing and scaling containerized workloads effectively.
The ecosystem for Kubernetes tools, addons, and extensions is constantly expanding, and there are several tools and integrations that introduce simpler management of resources and additional components to Kubernetes clusters. These components can be valuable for running, scaling, and managing applications efficiently in Kubernetes, but they always build on the core/native components of Kubernetes.
New to Honeycomb? Learn how we work with Kubernetes.
Kubernetes Debugging Tools
For anyone working with Kubernetes, it’s important to have kubectl, the go-to command-line tool for interacting with Kubernetes, and a UI mechanism, such as the Kubernetes dashboard or k9s, to make it easier to navigate debugging and working with Kubernetes.
Most issues in a Kubernetes cluster can be triaged using the CLI command kubectl get <resource-name> within the relevant namespace to check the status of resources.
For a more detailed view of resources, including recent events related to scheduling, networking, or resource startup, use the command kubectl describe <resource-name> <resource-instance-name>. These events are useful for diagnosing issues.
To view logs emitted by a running container, use kubectl logs <pod-name>, which is a command that shows the stdout and stderr output from the containerized application.
5 Common Kubernetes Debugging Scenarios
Here are some of the most common Kubernetes scenarios and how to resolve them.
1. Application downtime
Symptoms: Application downtime is caused by pods failing unexpectedly before completing their tasks.
Possible causes:
- The application inside the container is failing.
- Missing environment variables or incorrect startup commands.
- Insufficient resources are preventing the scheduler from assigning a pod to a node.
- Readiness and liveness probes are failing, causing the pod to restart indefinitely.
- The pod exceeds memory limits, triggering an OutOfMemory (OOM) error.
- The container image is invalid, or the container image pull failed because of incorrect container image names or authentication issues.
- The pod is part of a Job and gets terminated before completion.
Debugging steps:
- List the pods in the namespace using the kubectl get pods command and find the problematic one(s).
- Check for failure messages using the command kubectl describe pod <pod-name>. Describing pods will show events at the bottom along with the entire pod and service specifications, including which node the pod was trying to run on. Using this information, fix the issue.
If you can’t find any problematic pods, then try the following:
- Check on the relevant deployment using kubectl get deployments and kubectl describe deployment <deployment-name> commands.
- Check the status of any potentially problematic node(s) across your Kubernetes namespace:
kubectl get nodes
kubectl describe node <node-name>- Check logs for errors using the command kubectl get events --sort-by=.metadata.creationTimestamp. If the logs point to the potential cause, fix the problem and recheck the deployment status; if not, continue debugging.
- Check for CPU/memory usage on any problematic pods: kubectl top pod <pod-name>. Note that you can adjust the OOMKill settings if pods are being terminated too quickly. For example, you can change the pod’s terminationGracePeriodSeconds configuration to give the pod more time to gracefully shut down before being killed, or change the pod’s oomScoreAdj value to adjust its priority in being killed during memory pressure.
- View logs for errors: kubectl logs <pod-name>.
- Open an interactive shell inside the pod: kubectl exec -it <pod-name> -- /bin/sh.
- Verify startup commands in the pod spec and review container exit codes. Correct the necessary configuration and restart the deployment if any of the resulting details point to a particular cause.
2. Service is unreachable (4xx or 5xx errors)
Symptom: You receive a 4xx or 5xx error when accessing an application.
Possible causes:
- 4xx Errors (Client Errors):
- The request is malformed, or the API endpoint does not exist.
- The application has authentication/authorization failures.
- Misconfigured ingress rules or network policies are blocking traffic.
- 5xx Errors (server errors)
- Service is down or crashing
- The service experiences high load or insufficient resources
Debugging steps:
- List the pods in the namespace using the kubectl get pods command and find the problematic one(s).
- Inspect pod logs for runtime errors: kubectl logs <pod-name>.
- Verify the service and ensure the service exists and has healthy endpoints:
kubectl get service
kubectl get endpoints <service-name>
kubectl describe svc <service-name>- Inspect network policies. See if there are any polices that might be restricting traffic:
kubectl get networkpolicy
kubectl describe networkpolicy <networkpolicy-name>And if applicable:
- Review the ingress rules for any policies that might be restricting traffic: kubectl describe ingress <ingress-name>.
- Test connectivity using port-forwarding: kubectl port-forward <pod-name> 8080:80.
- To check for an authentication failure, use the kubectl auth can-i command to debug the RBAC auth settings.
kubectl auth can-i <verb> <resource> --as=system:serviceaccount:<namespace>:<service-account>3. Missing storage volumes
Symptom: Service is failing because of a missing or unmounted storage volume.
Possible causes:
- The PersistentVolumeClaim is not bound to a PersistentVolume.
- The storage class is not correctly configured.
- The underlying storage provider is unavailable.
Debugging steps:
- Check persistent volumes and claims.
kubectl get pvc
kubectl get pv- Describe the PVC for status details: kubectl describe pvc <pvc-name>.
- Verify that the storage backend is operational.
4. Network issues blocking pod communication
Symptom: Services or applications cannot communicate with each other. Logs show errors like “Error: permission denied.”
Possible causes:
- The service account associated with the pod lacks the necessary Role-Based Access Control (RBAC) permissions to access the required resources.
- The service selector does not match the pod labels.
- Network policies are incorrectly restricting access.
- DNS resolution within the cluster is failing.
Debugging steps:
To resolve an issue caused by a missing RBAC permission:
- Run the following to confirm which service account the pod is using kubectl get pod <pod-name> -o jsonpath='{.spec.serviceAccount}'.
- Check what the service account is allowed to do at the Kubernetes layer.
kubectl auth can-i list pods --as=system:serviceaccount:<namespace>:<service-account>Verify RBAC permissions and look at RoleBindings and ClusterRoleBindings for missing permissions that need to be granted.
kubectl get rolebindings -n <namespace>
kubectl get clusterrolebindings -n <namespace>- If you are using a cloud provider, ensure the correct IAM role is attached to the service account: kubectl get svc <service-account> -o yaml in the cloud provider’s console or CLI. You should ensure the IAM role attached to your service account has been granted the necessary policies.
Sometimes, access control issues can mimic network problems. If your RBAC permissions look fine, you can also follow these general steps to check on the network policies.
- Verify pod labels and service selectors: kubectl get pods --show-labels.
- Check network policies: kubectl describe networkpolicy.
- Test DNS resolution inside a pod: kubectl exec -it <pod-name> -- nslookup <service-name>.
5. Jobs or CronJobs stuck in pending or failing
Symptom: A scheduled job does not start, or it repeatedly fails.
Possible causes:
- The job lacks the necessary resources to schedule on any node.
- The job has incorrect permissions or access settings.
- The job spec is misconfigured (e.g., incorrect command).
Debugging steps:
- Find failed jobs with kubectl get jobs and use the describe command to learn more about the problematic job’s events: kubectl describe job <job-name>.
- Review output and address the fixes.
- Manually restart or delete problematic jobs: kubectl delete job <job-name>.
Common debugging mistakes
Some issues in Kubernetes can take more time to debug because of mistakes that are commonly made that can be avoided. Here are five additional common errors that can generally prolong debugging container workloads on Kubernetes.
1. Not checking events and descriptions for clues
Mistake: Only looking at pod logs and not checking the kubectl describe output.
Why it is a problem: Events can reveal crucial errors like failed mounts, scheduling issues, or OOM kills.
Fix: Always check detailed pod events: kubectl describe pod <pod-name>.
2. Ignoring resource limits and requests
Mistake: Deploying workloads without setting or checking the CPU/memory requests and limits.
Why it is a problem: Pods may get throttled or killed due to resource exhaustion.
Fix: Make sure resource limits are defined in the Kubernetes deployment.
resources:
  requests:
    memory: "256Mi"
    cpu: "100m"
  limits:
    memory: "512Mi"
cpu: "500m"3. Misconfiguring liveness and readiness probes
Mistake: Setting aggressive liveness probes that restart healthy, but slow-starting apps.
Why it is a problem: restarts prolong deployments, and even cause them to fail entirely if Kubernetes keeps killing containers before they finish starting up.
Fix: Use a startup probe for slow-starting containers. This allows you to keep your liveness and readiness probe settings tight– meaning faster failure detection and quicker traffic routing once the container is ready.
livenessProbe:
  httpGet:
    path: /healthz
    port: 8080
  initialDelaySeconds: 10
  periodSeconds: 5
failureThreshold: 34. Restarting a pod without checking logs first
Mistake: Deleting or restarting a failing pod before inspecting its logs.
Why it is a problem: Valuable debugging information is lost when the pod is removed.
Fix: Add telemetry to Kubernetes. Send data from Kubernetes using OpenTelemetry. The data sent from Kubernetes resources can answer important questions for debugging issues.
5. Overlooking sidecar containers in debugging
Mistake: Checking logs only for the main application container, ignoring sidecars.
Why it is a problem: Sidecars (e.g., logging or service mesh containers) can fail and impact the main app.
Fix: List all containers and check their logs separately: kubectl logs <pod-name> -c <container-name>.
How to make debugging in Kubernetes easier
Typos or issues with the YAML code in Kubernetes manifest and configurations files are fairly common and should also be checked as part of the debugging practice.
Here are other best practices to incorporate for debugging issues.
- Always check for events and logs first. This is the best practice for debugging in Kubernetes.
- Use namespaces. Group workloads logically using namespaces to make debugging easier.
- Gain Kubernetes observability. Introducing observability can save a lot of time when debugging issues. We recommend leveraging OpenTelemetry to get started.
- Use tools for consistent deployments. Use tools like Helm to manage Kubernetes deployments. Introducing consistency reduces the time it takes to debug an issue, and Helm helps package applications with consistent configurations.
If you’d like to learn how to leverage more tools for gaining insights in your Kubernetes clusters, you can read our blog about how Honeycomb uses Honeycomb to gain insights into our Kubernetes clusters.
Conclusion
Debugging in Kubernetes doesn’t have to be a frustrating experience. By understanding the architecture, leveraging some debugging tools, and following the troubleshooting flows we shared, you can keep your Kubernetes workloads active and working. If you need even deeper visibility and faster troubleshooting support, Honeycomb’s observability solutions for Kubernetes work across complex environments to deliver key insights about your systems.
Want to know more?
Talk to our team to arrange a custom demo or for help finding the right plan.